1964 Illinois House of Representatives election
The 1964 Illinois House of Representatives election was held on November 3, 1964, to elect all 177 members of the Illinois House of Representatives for the 74th Illinois General Assembly. The state had been unable to redistrict following the 1960 United States census, with Democratic governor Otto Kerner Jr. vetoing the Republican-controlled legislature's maps. A provision in the state's constitution required that elections be held at-large if a redistricting map could not be passed. The ballot contained 236 names, with 118 candidates from both the Democratic and Republican parties.
| |||||||||||||||||||||||||
All 177 seats in the Illinois House of Representatives 89 seats needed for a majority | |||||||||||||||||||||||||
|---|---|---|---|---|---|---|---|---|---|---|---|---|---|---|---|---|---|---|---|---|---|---|---|---|---|
| |||||||||||||||||||||||||
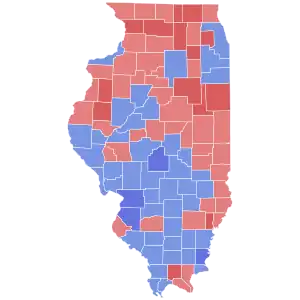 Composite vote by county
| |||||||||||||||||||||||||
| |||||||||||||||||||||||||
.png.webp)
Due to straight-ticket voting and the coattails of Lyndon B. Johnson in the concurrent presidential election, every Democratic candidate got more votes than any Republican candidate, flipping the chamber and giving Democrats a super-majority in the state House. Democrats won a total of 118 seats to Republicans' 59 seats.
Background
Constitutional procedure
Prior to the 1960s, Illinois had only redistricted its House of Representatives once since 1901. While the Constitution of Illinois stated that the legislature was required to redistrict the state, it did not provide any method of enforcement. Population shifts in the state had resulted in Chicago having a higher percentage of the state's population, and downstate legislators did not want their region of the state to lose influence. Therefore, starting in the cycle after the 1910 United States census, legislators chose not to redistrict the state, with courts continuing to allow this practice.[1]: 291–292 A constitutional convention, approved by voters in 1918, aimed to deal with the issue,[2]: 443 but voters rejected its proposed constitution in 1922.[1]: 291–292 The 1901 legislative map had 51 districts, with 19 located in Cook County.[1]: 291 [lower-alpha 2]
As the population of Chicago and Cook County grew, the level of malapportionment continued to increase. In the 1930 United States census, Cook County contained a majority of the state's population, but it continued to contain only 37.3% of the state's legislative districts.[1]: 294 Throughout the 1920s and 1930s, residents of the Chicago area, most notably John B. Fergus and John W. Keogh, argued before both state and federal courts in unsuccessful attempts to force redistricting.[1]: 292–294 In the 1930s, there were various efforts supported by governors Louis L. Emmerson and Henry Horner to allow Cook County proportional representation in one legislative chamber, but limit its representation in the other, but these proposals died due to strong bipartisan opposition from downstate politicians.[1]: 295
Due to increasing public pressure over malapportionment, in 1953, newly-elected Republican governor William Stratton viewed redistricting a priority. Through a number of compromises, he managed to convince the legislature to pass a constitutional amendment to establish new redistricting procedures. The amendment split the state into three permanent divisions: Chicago, suburban Cook County, and downstate. There were 58 Senate districts, of which 18 were assigned to Chicago, 6 to suburban Cook County, and 34 to downstate. The amendment did not contain any provision for reapportioning the Senate, with the intent of keeping the chamber permanently controlled by downstate. However, the House of Representatives would have 59 districts that would be regularly reapportioned by population. Initially, 23 would be assigned to Chicago, 7 to suburban Cook County, and 29 to downstate.[1]: 296–297 To ensure regular reapportionment, the constitution contained two separate procedures for if the legislature failed to redistrict. First, redistricting would be done by a ten-member commission, with five members appointed from each political party by the governor. If that commission failed to create districts after four months, an at-large election would be held.[1]: 297
Opposition to the amendment was disorganized, while supporters included many state politicians and newspapers. The new redistricting process was approved by voters in a 1954 referendum with about 80% of the vote.[1]: 297–298 Following the passage of the amendment, new districts were drawn in 1955. At this time, both chambers were Republican-controlled, as was the governorship, leading to a relatively non-controversial redistricting cycle. Each chamber created their own map, and passed the proposed map of the other chamber, with the maps being signed by Stratton. The map used for the House of Representatives map was fairly apportioned, while the Senate's map still retained significant malapportionment. Overall, though, the maps were considered a significant improvement.[1]: 298
1960 redistricting cycle
Following the 1962 elections, Republicans controlled the Illinois House of Representatives and the Illinois Senate, though they only had a one-seat majority in the House. The governor of Illinois was Democrat Otto Kerner Jr., resulting in a divided government. Redistricting for the Illinois House of Representatives was required to take place before the 1964 elections.[3][4]: 380 In data from the 1960 census, the state's population had shifted towards suburbs of Chicago, particularly in Cook County, Lake County, and DuPage County. Using population-based apportionment, two districts would be shifted from Chicago to the suburbs, and two more from southern Illinois to northeastern Illinois.[1]: 298 On April 23, Republicans in the legislature introduced a plan to that effect. Democrats responded on the same day with a plan to instead have districts that would cross include parts of both Chicago and its suburbs, allowing the city to have control of 23 districts, arguing that this was fair given Chicago's under-representation in the Senate.[1]: 299
Democrats received no Republican support for their redistricting plan, while Republicans could not pass theirs with any defections from theirs given their narrow majority. However, some southern Illinois lawmakers refused to support the initial Republican plan, given its removal of two districts from southern Illinois. Republicans created a compromise plan that would only remove one district from southern Illinois, at the expense of a district in Lake County.[1]: 299 However, this bill was vetoed by Kerner on July 1, as he deemed it unfair.[1]: 299 [3] Kerner had previously promised to veto any partisan redistricting plan, and his veto message referred to the deliberate under-representation of Republican areas (which occurred as a result of the compromises made to appease downstate lawmakers).[1]: 299 Kerner's veto was challenged at the Supreme Court of Illinois, where it was upheld. The failure of the legislature to redistrict caused the responsibility to fall to the backup commission.[1]: 299
Special commission deadlock
A special commission was also unsuccessful in agreeing on maps.[3]
On January 4, 1964, Supreme Court of Illinois ruled that an at-large election had to take place, as the legislature had not been able to redistrict the state. The court rejected an argument brought by Republican state representative Fred Branson, who argued that districts from 1955 could be used. The court also rejected an argument brought by Chicago lawyer Gus Giannis that if elections to the House were required to be held at-large, elections to the State Senate should also be held at-large.[5]
Following the court's decision, Kerner called a special session of the legislature on January 6 to set up procedures for the at-large election.[6]

Election procedure and campaign
The emergency bill passed by the legislature in the special session allowed each party to nominate up to 118 candidates at their party convention.[6] Delegates to each party's convention were elected using the previous districts during the state's April primary.[4]: 324 The House recommended that each party nominate 100 candidates, to protect incumbent House members and ensure the minority party would have at least 77 seats.[6]
Candidate selection
There were multiple attempts to run a "Third Slate" of candidates. The Better Government Association of Chicago, along with some downstate politicians, presented a "blue ribbon" slate of candidates. Republicans nominated 118 candidates at their convention, including some of the blue ribbon candidates. Democrats followed in nominating 118 candidates at their convention. With both parties putting up what were deemed to be acceptable slates of candidates, and Republicans choosing to not renominate some controversial "West Side bloc" legislators, this Third Slate effort disbanded.[7][8]
Another attempt to put a Third Slate on the ballot was backed by various civil rights groups and labor unions, including the United Auto Workers.[9] Their planned platform focused on election reform and civil rights. The Third Slate intended on nominating 59 candidates, allowing a voter to straight-ticket vote for the slate as well as one of the two major parties.[10] However, this Third Slate failed to make the ballot, with the state's election board ruling on August 21 that they had failed to gather enough signatures.[11]
Popular figures were picked to run at the top of each party's ticket. Democrats nominated Adlai Stevenson III, the son of Adlai Stevenson II, a popular former governor in the state, and John A. Kennedy, a businessman who had a similar name but no relation to president John F. Kennedy, who had been murdered the previous year. Republicans led their ticket with Earl D. Eisenhower, the brother of popular former president Dwight D. Eisenhower.[8]
Ballot
The ballot for the State House election was separate from the ballot for other concurrent elections. Voters were allowed to cast up to 177 votes, with a straight-ticket voting option available to vote for all 118 candidates of a party's slate. Voters who voted straight-ticket could also vote for up to 59 candidates from the other party. Both parties recommended utilizing straight-ticket voting.[12] The ballot was 33 inches long and was often referred to as the "bedsheet ballot".[8]
There were four ballots given to voters in 1964: a white ballot, containing most of the typical races (such as for president and governor); a green ballot, voting on the retention elections for various judges; a blue ballot, containing two constitutional amendments to be voted on; and the orange ballot, solely reserved for the House of Representatives election. Before the election, the sheer number of ballots to be voted on led to predictions of a high number of undervotes in the House of Representatives election, but post-election analysis revealed that this did not take place.[1]: 303
Campaigning and endorsements
Both parties encouraged a straight-ticket vote. Republicans explicitly discouraged voting for any Democratic candidates, arguing that voting for Democrats would cause the legislature to become controlled by Richard J. Daley, the mayor of Chicago. Democrats argued that a straight-ticket vote would "ensure representation from every district in Illinois".[1]: 303 Individual candidates for the legislature generally avoided campaigning across the state, instead only campaigning around their home region, if at all.[8][1]: 303
Given the unique electoral system allowing voters to vote for candidates of both parties, some newspapers made bipartisan endorsements of candidates. The Southern Illinoisan endorsed 48 Democrats and 48 Republicans after sending a questionnaire to all candidates in the election, suggesting voters to vote straight-ticket and for all of the newspaper's endorsed candidates of the opposing party.[7] Likewise, the Daily Herald, a newspaper serving the suburbs of Chicago, endorsed seven candidates (four Republicans and three Democrats) who they believed had a good understanding of suburban issues.[13]
Results
Results were not known immediately after the election; while the results in other statewide races were known on November 4th, the statewide tally and canvass for the House elections took multiple weeks.[14] Based on early reported returns in some downstate precincts, Democrats declared victory on November 4, predicting that they had elected their entire slate. However, Republicans did not yet concede, stating that they still believed they had a chance of victory.[15] Cook County's results were fully counted by November 9, though not reported until later.[16] Unofficial results for 100 downstate counties, excluding Cook and DuPage, were reported on November 26th, showing a strong performance by Democrats.[17] Unofficial statewide results were reported on December 3, showing that every Democratic candidate had won, with many Republican incumbents losing re-election.[18]
Five Republican candidates obtained an injunction over the results in DuPage County, claiming that there were more votes cast than voters registered in five precincts.[19] The injunction was issued by circuit judge Philip Locke on November 30. After the release of statewide results, it became apparent that the discrepancies would not affect the overall balance of power in the legislature.[20] On December 14, Democratic Attorney General William G. Clark filed a motion to move the case to the Illinois Supreme Court, to force the vote count to be released. The Illinois Supreme Court acted on this on January 6, 1965, releasing the DuPage results only hours before legislators were sworn-in. Locke interpreted the Supreme Court's order as allowing him to order recounts in certain precincts, which he did. The recounts found only minor errors with no significant impact on the results.[21]
In the certified results, the top-placing Democrat was Adlai E. Stevenson III, while the top-placing Republican was Earl D. Eisenhower. Every Democrat received more votes than any Republican.[8][22] The strong Democratic performance was attributed to coattails from Democratic president Lyndon B. Johnson's victory over Republican Barry Goldwater in the 1964 United States presidential election in Illinois.[8]
| Party | Candidate | Votes | % | |
|---|---|---|---|---|
| Democratic | Adlai E. Stevenson III | 2,417,978 | 0.46% | |
| Democratic | John K. Morris (incumbent) | 2,410,365 | 0.46% | |
| Democratic | Anthony Scariano (incumbent) | 2,385,622 | 0.45% | |
| Democratic | John P. Touhy (incumbent) | 2,378,228 | 0.45% | |
| Democratic | Abner J. Mikva (incumbent) | 2,377,439 | 0.45% | |
| Democratic | William A. Redmond (incumbent) | 2,371,134 | 0.45% | |
| Democratic | Joseph T. Connelly | 2,369,556 | 0.45% | |
| Democratic | John E. Cassidy, Jr. | 2,368,063 | 0.45% | |
| Democratic | John A. Kennedy | 2,367,755 | 0.45% | |
| Democratic | Bernard M. Peskin (incumbent) | 2,367,287 | 0.45% | |
| Democratic | Chester P. Majewski (incumbent) | 2,366,785 | 0.45% | |
| Democratic | Daniel M. Pierce | 2,364,469 | 0.45% | |
| Democratic | James P. Loukas (incumbent) | 2,363,338 | 0.45% | |
| Democratic | Esther Saperstein (incumbent) | 2,361,847 | 0.45% | |
| Democratic | Mrs. Dorah Grow | 2,360,574 | 0.45% | |
| Democratic | Harold D. Stedelin | 2,358,491 | 0.45% | |
| Democratic | Lloyd (Curly) Harris (incumbent) | 2,357,709 | 0.45% | |
| Democratic | Paul F. Elward (incumbent) | 2,357,524 | 0.45% | |
| Democratic | William E. Hartnett | 2,356,700 | 0.45% | |
| Democratic | Marvin S. Lieberman | 2,356,576 | 0.45% | |
| Democratic | Robert E. Mann (incumbent) | 2,356,342 | 0.45% | |
| Democratic | Harold A. Katz | 2,355,168 | 0.45% | |
| Democratic | James Moran | 2,354,684 | 0.45% | |
| Democratic | Cecil A. Partee (incumbent) | 2,351,757 | 0.45% | |
| Democratic | Eugenia S. Chapman | 2,351,257 | 0.45% | |
| Democratic | Raymond J. Welsh, Jr. (incumbent) | 2,349,573 | 0.45% | |
| Democratic | Joe (Joseph) Callahan | 2,348,350 | 0.45% | |
| Democratic | J. W. (Bill) Scott (incumbent) | 2,343,772 | 0.45% | |
| Democratic | William Pierce (incumbent) | 2,341,983 | 0.45% | |
| Democratic | James C. Kirie | 2,340,388 | 0.45% | |
| Democratic | Edward A. Warman | 2,340,263 | 0.45% | |
| Democratic | Leland Rayson | 2,339,745 | 0.45% | |
| Democratic | E. J. (Zeke) Giorgi | 2,339,506 | 0.45% | |
| Democratic | Phillip C. Goldstick | 2,337,565 | 0.44% | |
| Democratic | John Merlo (incumbent) | 2,337,425 | 0.44% | |
| Democratic | Allen T. Lucas (incumbent) | 2,333,588 | 0.44% | |
| Democratic | James A. McLendon | 2,332,951 | 0.44% | |
| Democratic | John M. Daley | 2,332,665 | 0.44% | |
| Democratic | Leland J. Kennedy (incumbent) | 2,331,981 | 0.44% | |
| Democratic | Paul E. Rink (incumbent) | 2,331,722 | 0.44% | |
| Democratic | James D. Carrigan (incumbent) | 2,330,860 | 0.44% | |
| Democratic | Joe W. Russell (incumbent) | 2,330,466 | 0.44% | |
| Democratic | Melvin McNairy | 2,328,466 | 0.44% | |
| Democratic | Harold Washington | 2,328,125 | 0.44% | |
| Democratic | John Jerome (Jack) Hill (incumbent) | 2,328,023 | 0.44% | |
| Democratic | Clyde Lee (incumbent) | 2,326,629 | 0.44% | |
| Democratic | Clyde L. Choate (incumbent) | 2,324,383 | 0.44% | |
| Democratic | Charles Ed Schaefer (incumbent) | 2,324,100 | 0.44% | |
| Democratic | James D. Holloway (incumbent) | 2,323,732 | 0.44% | |
| Democratic | Chester R. Wiktorski, Jr. (incumbent) | 2,321,044 | 0.44% | |
| Democratic | Robert V. Walsh (incumbent) | 2,320,956 | 0.44% | |
| Democratic | William J. Schoeninger | 2,320,724 | 0.44% | |
| Democratic | James Von Boeckman | 2,320,580 | 0.44% | |
| Democratic | Roy Curtis Small | 2,320,211 | 0.44% | |
| Democratic | C. R. (Butch) Ratcliffe (incumbent) | 2,318,456 | 0.44% | |
| Democratic | Joseph P. Stremlau (incumbent) | 2,316,029 | 0.44% | |
| Democratic | Francis X. Mahoney | 2,315,855 | 0.44% | |
| Democratic | Carl H. Wittmond (incumbent) | 2,315,638 | 0.44% | |
| Democratic | Miles E. Mills (incumbent) | 2,315,065 | 0.44% | |
| Democratic | Elmo (Mac) McClain | 2,314,645 | 0.44% | |
| Democratic | Corneal A. Davis (incumbent) | 2,313,943 | 0.44% | |
| Democratic | Robert Craig (incumbent) | 2,313,925 | 0.44% | |
| Democratic | Tobias (Toby) Barry (incumbent) | 2,312,923 | 0.44% | |
| Democratic | Fred J. Schraeder | 2,312,797 | 0.44% | |
| Democratic | William A. Moore, M.D. | 2,311,742 | 0.44% | |
| Democratic | Bert Baker (incumbent) | 2,311,412 | 0.44% | |
| Democratic | Leo F. O'Brien | 2,309,250 | 0.44% | |
| Democratic | John J. McNichols | 2,306,601 | 0.44% | |
| Democratic | Leo Pfeffer (incumbent) | 2,306,163 | 0.44% | |
| Democratic | John W. Alsup (incumbent) | 2,306,002 | 0.44% | |
| Democratic | Michael H. McDermott (incumbent) | 2,305,217 | 0.44% | |
| Democratic | Frank C. Wolf (incumbent) | 2,304,540 | 0.44% | |
| Democratic | William J. Frey | 2,303,934 | 0.44% | |
| Democratic | Dan E. Costello (incumbent) | 2,303,723 | 0.44% | |
| Democratic | Daniel O'Neill | 2,303,161 | 0.44% | |
| Democratic | Howard R. Slater | 2,301,528 | 0.44% | |
| Democratic | Charles F. Armstrong (incumbent) | 2,301,421 | 0.44% | |
| Democratic | Michael E. Hannigan (incumbent) | 2,299,077 | 0.44% | |
| Democratic | H. B. Tanner | 2,298,128 | 0.44% | |
| Democratic | Thomas J. Hanahan, Jr. | 2,297,898 | 0.44% | |
| Democratic | Francis J. Loughran (incumbent) | 2,297,846 | 0.44% | |
| Democratic | Frank X. Downey (incumbent) | 2,296,178 | 0.44% | |
| Democratic | Joseph Fennessey | 2,295,190 | 0.44% | |
| Democratic | Dan Teefey (incumbent) | 2,293,692 | 0.44% | |
| Democratic | Joseph Tumpach | 2,293,423 | 0.44% | |
| Democratic | Leo B. Obernuefemann | 2,292,278 | 0.44% | |
| Democratic | Matt Ropa (incumbent) | 2,291,587 | 0.44% | |
| Democratic | James Y. Carter (incumbent) | 2,291,419 | 0.44% | |
| Democratic | Henry M. Lenard (incumbent) | 2,291,033 | 0.44% | |
| Democratic | Oral (Jake) Jacobs | 2,290,242 | 0.44% | |
| Democratic | John J. Houlihan | 2,289,912 | 0.44% | |
| Democratic | Frank J. Smith (incumbent) | 2,287,950 | 0.44% | |
| Democratic | Omer Sanders | 2,287,943 | 0.44% | |
| Democratic | Kenneth W. Course (incumbent) | 2,285,860 | 0.43% | |
| Democratic | Sam Romano (incumbent) | 2,285,599 | 0.43% | |
| Democratic | LaSalle J. DeMichaels | 2,285,455 | 0.43% | |
| Democratic | Andrew A. Euzzino (incumbent) | 2,284,415 | 0.43% | |
| Democratic | William A. Giblin | 2,284,254 | 0.43% | |
| Democratic | John P. Downes (incumbent) | 2,283,416 | 0.43% | |
| Democratic | John G. Fary (incumbent) | 2,283,240 | 0.43% | |
| Democratic | Edward J. Shaw (incumbent) | 2,283,155 | 0.43% | |
| Democratic | Peter J. Whalen (incumbent) | 2,281,873 | 0.43% | |
| Democratic | Robert F. McPartlin (incumbent) | 2,281,797 | 0.43% | |
| Democratic | John M. Vitek (incumbent) | 2,281,726 | 0.43% | |
| Democratic | John F. Leon (incumbent) | 2,281,623 | 0.43% | |
| Democratic | Edward F. Sensor | 2,281,431 | 0.43% | |
| Democratic | Joseph F. Fanta | 2,281,018 | 0.43% | |
| Democratic | Bernard B. Wolfe | 2,280,958 | 0.43% | |
| Democratic | Nicholas Zagone (incumbent) | 2,280,192 | 0.43% | |
| Democratic | Edward W. Wolbank (incumbent) | 2,279,315 | 0.43% | |
| Democratic | Frank Lyman (incumbent) | 2,279,018 | 0.43% | |
| Democratic | Peter M. Callan (incumbent) | 2,278,241 | 0.43% | |
| Democratic | Calvin L. Smith | 2,278,068 | 0.43% | |
| Democratic | Frank J. Broucek | 2,276,080 | 0.43% | |
| Democratic | Benedict Garmisa | 2,275,684 | 0.43% | |
| Democratic | Nick Svalina (incumbent) | 2,275,432 | 0.43% | |
| Democratic | Otis G. Collins | 2,274,028 | 0.43% | |
| Democratic | Lawrence DiPrima (incumbent) | 2,262,258 | 0.43% | |
| Republican | Earl D. Eisenhower | 2,191,826 | 0.42% | |
| Republican | Charles W. Clabaugh (incumbent) | 2,186,592 | 0.42% | |
| Republican | John Clinton Youle | 2,184,069 | 0.42% | |
| Republican | William E. Pollack (incumbent) | 2,178,460 | 0.41% | |
| Republican | Noble W. Lee (incumbent) | 2,177,503 | 0.41% | |
| Republican | Paul J. Randolph | 2,176,388 | 0.41% | |
| Republican | Mrs. Robert (Marjorie) Pebworth | 2,175,501 | 0.41% | |
| Republican | Frances L. Dawson (incumbent) | 2,173,989 | 0.41% | |
| Republican | Lawrence X. Pusateri | 2,172,480 | 0.41% | |
| Republican | Carl W. Soderstrom (incumbent) | 2,172,032 | 0.41% | |
| Republican | George F. Sisler | 2,171,458 | 0.41% | |
| Republican | John C. Parkhurst (incumbent) | 2,169,751 | 0.41% | |
| Republican | John W. Carroll (incumbent) | 2,169,659 | 0.41% | |
| Republican | Terrel E. Clarke (incumbent) | 2,167,451 | 0.41% | |
| Republican | Albert W. Hachmeister (incumbent) | 2,166,786 | 0.41% | |
| Republican | William D. Walsh (incumbent) | 2,166,243 | 0.41% | |
| Republican | J. David Jones | 2,165,919 | 0.41% | |
| Republican | Mrs. Brooks McCormick | 2,165,415 | 0.41% | |
| Republican | William L. Blaser | 2,163,785 | 0.41% | |
| Republican | George Thiem | 2,162,963 | 0.41% | |
| Republican | Maj. Gen. Robert M. Woodward | 2,161,782 | 0.41% | |
| Republican | Thomas F. Railsback (incumbent) | 2,161,428 | 0.41% | |
| Republican | Harris Rowe (incumbent) | 2,159,212 | 0.41% | |
| Republican | Richard A. Walsh (incumbent) | 2,158,621 | 0.41% | |
| Republican | Arthur E. Simmons (incumbent) | 2,157,072 | 0.41% | |
| Republican | George M. Burditt | 2,156,996 | 0.41% | |
| Republican | Clarence E. Neff (incumbent) | 2,156,668 | 0.41% | |
| Republican | Lewis V. Morgan, Jr. (incumbent) | 2,155,932 | 0.41% | |
| Republican | Alan R. Johnston (incumbent) | 2,155,834 | 0.41% | |
| Republican | John H. Conolly (incumbent) | 2,155,828 | 0.41% | |
| Republican | Ronald A. Hurst | 2,155,622 | 0.41% | |
| Republican | John W. Lewis, Jr. (incumbent) | 2,154,348 | 0.41% | |
| Republican | Leslie N. Jones | 2,153,681 | 0.41% | |
| Republican | G. William Horsley (incumbent) | 2,152,602 | 0.41% | |
| Republican | John Henry Kleine | 2,152,221 | 0.41% | |
| Republican | Herbert F. Geisler | 2,151,603 | 0.41% | |
| Republican | James H. Oughton, Jr. | 2,150,431 | 0.41% | |
| Republican | Paul P. Boswell, M.D. | 2,149,578 | 0.41% | |
| Republican | Edward H. Jenison | 2,149,326 | 0.41% | |
| Republican | Mary K. Meany | 2,147,427 | 0.41% | |
| Republican | Eugene F. Schlickman | 2,145,913 | 0.41% | |
| Republican | W. Robert Blair | 2,145,703 | 0.41% | |
| Republican | Jack T. Knuepfer | 2,143,965 | 0.41% | |
| Republican | Ralph T. Smith (incumbent) | 2,143,304 | 0.41% | |
| Republican | Wayne Fitzgerrell (incumbent) | 2,142,955 | 0.41% | |
| Republican | Robert R. Canfield | 2,142,725 | 0.41% | |
| Republican | Carl L. Klein | 2,142,638 | 0.41% | |
| Republican | Francis J. Berry | 2,142,274 | 0.41% | |
| Republican | Stanley A. Papierz | 2,141,662 | 0.41% | |
| Republican | Ben S. Rhodes (incumbent) | 2,141,539 | 0.41% | |
| Republican | Don A. Moore (incumbent) | 2,140,695 | 0.41% | |
| Republican | Bernard McDevitt (incumbent) | 2,139,731 | 0.41% | |
| Republican | C. L. McCormick (incumbent) | 2,138,193 | 0.41% | |
| Republican | Jack Bowers | 2,137,573 | 0.41% | |
| Republican | Dr Edwin E. Dale (incumbent) | 2,137,486 | 0.41% | |
| Republican | Dean McCully (incumbent) | 2,136,128 | 0.41% | |
| Republican | Ed Lehman (incumbent) | 2,134,749 | 0.41% | |
| Republican | Michael A. Ruddy (incumbent) | 2,134,681 | 0.41% | |
| Republican | William J. "Bill" Cunningham | 2,134,243 | 0.41% | |
| Republican | W. K. (Kenny) Davidson (incumbent) | 2,132,504 | 0.41% | |
| Republican | Louis Janczak (incumbent) | 2,132,011 | 0.41% | |
| Republican | W. J. McDonald | 2,130,597 | 0.41% | |
| Republican | Joseph R. Hale (incumbent) | 2,128,570 | 0.40% | |
| Republican | Fred Branson (incumbent) | 2,127,908 | 0.40% | |
| Republican | Nick Keller | 2,126,958 | 0.40% | |
| Republican | Charles M. (Chuck) Campbell (incumbent) | 2,126,209 | 0.40% | |
| Republican | Edward McBroom (incumbent) | 2,126,189 | 0.40% | |
| Republican | George S. Brydia (incumbent) | 2,126,047 | 0.40% | |
| Republican | Harland D. Warren (incumbent) | 2,125,539 | 0.40% | |
| Republican | Robert J. Lehnhausen | 2,124,841 | 0.40% | |
| Republican | Charles K. Willett (incumbent) | 2,124,588 | 0.40% | |
| Republican | A. B. McConnell (incumbent) | 2,124,433 | 0.40% | |
| Republican | William F. Martin | 2,123,689 | 0.40% | |
| Republican | John E. Velde, Jr. | 2,122,408 | 0.40% | |
| Republican | Meade Baltz (incumbent) | 2,121,885 | 0.40% | |
| Republican | H. B. Ihnen (incumbent) | 2,120,757 | 0.40% | |
| Republican | John W. Johnson | 2,119,621 | 0.40% | |
| Republican | John J. Donovan (incumbent) | 2,119,546 | 0.40% | |
| Republican | Frank A. Marek (incumbent) | 2,119,175 | 0.40% | |
| Republican | Garrel Burgoon (incumbent) | 2,118,800 | 0.40% | |
| Republican | Edward M. Finfgeld (incumbent) | 2,118,682 | 0.40% | |
| Republican | Edward Schneider (incumbent) | 2,118,514 | 0.40% | |
| Republican | Raymond E. (Ray) Anderson (incumbent) | 2,118,462 | 0.40% | |
| Republican | Merle K. Anderson (incumbent) | 2,118,328 | 0.40% | |
| Republican | Orval W. Hittmeier (incumbent) | 2,118,246 | 0.40% | |
| Republican | Paul F. Jones (incumbent) | 2,117,605 | 0.40% | |
| Republican | Claude A. Walker (incumbent) | 2,117,257 | 0.40% | |
| Republican | J. Horace Gardner (incumbent) | 2,116,919 | 0.40% | |
| Republican | Hubert A. Dailey | 2,116,519 | 0.40% | |
| Republican | Bradley L. Manning | 2,116,339 | 0.40% | |
| Republican | Albert E. Bennett | 2,116,319 | 0.40% | |
| Republican | Charles O. Miller (incumbent) | 2,116,139 | 0.40% | |
| Republican | Kenneth W. Miller (incumbent) | 2,116,012 | 0.40% | |
| Republican | Marshall R. Schroeder | 2,115,493 | 0.40% | |
| Republican | George P. Johns (incumbent) | 2,115,224 | 0.40% | |
| Republican | Edwin A. McGowan (incumbent) | 2,115,107 | 0.40% | |
| Republican | Elwood Graham (incumbent) | 2,114,521 | 0.40% | |
| Republican | Arthur J. Reis | 2,114,337 | 0.40% | |
| Republican | Ben C. Blades (incumbent) | 2,114,263 | 0.40% | |
| Republican | Carl T. Hunsicker (incumbent) | 2,114,146 | 0.40% | |
| Republican | Allan L. "Al" Schoeberlein (incumbent) | 2,113,809 | 0.40% | |
| Republican | John F. Wall (incumbent) | 2,113,500 | 0.40% | |
| Republican | Oscar Hansen (incumbent) | 2,113,266 | 0.40% | |
| Republican | Paul K. Zeman | 2,113,065 | 0.40% | |
| Republican | Jack E. Walker (incumbent) | 2,112,532 | 0.40% | |
| Republican | Edward A. Bundy | 2,111,052 | 0.40% | |
| Republican | Sydney L. "Syd" Perkins | 2,109,299 | 0.40% | |
| Republican | Eugene T. Devitt | 2,108,237 | 0.40% | |
| Republican | Jack D. Songer | 2,107,794 | 0.40% | |
| Republican | David W. Johnson | 2,105,944 | 0.40% | |
| Republican | Richard L. LoDestro (incumbent) | 2,104,909 | 0.40% | |
| Republican | James D. Heiple | 2,104,813 | 0.40% | |
| Republican | Romie J. Palmer | 2,103,232 | 0.40% | |
| Republican | J. Theodore Meyer | 2,103,129 | 0.40% | |
| Republican | Raymond J. Kahoun (incumbent) | 2,098,387 | 0.40% | |
| Republican | Norbert L. Lundberg | 2,098,300 | 0.40% | |
| Republican | Alfred B. Two | 2,098,286 | 0.40% | |
| Republican | Hellmut W. Stolle (incumbent) | 2,094,314 | 0.40% | |
| Total votes | 525,723,540 | 100% | ||
Aftermath
The results provided a significant shake-up of the balance of power in the state. While Republicans had maintained control of the Illinois Senate, Democrats now had control of the State House and the governorship. Democrats elected John P. Touhy as the speaker of the House.[23] One of the first matters the legislature had to consider was redistricting. New maps for the State House had to be passed to avoid another at-large election, while new maps for the State Senate had to be passed to comply with the Supreme Court's ruling in Reynolds v. Sims, which required that state legislature districts be roughly equal in population. There was again difficulty in passing maps, with downstate and Chicago legislators not wanting to give up representation in favor of the suburbs, which had grown their relative share of the population. In the end, a five-judge panel decided redistricting for the State Senate, while a legislative committee appointed by the governor was responsible for redistricting the House. The resulting maps were relatively fair to both parties, though caused a significant shift of power from downstate to the Chicago area.[24]
Illinois's constitution was rewritten in 1970. The new constitution modified the procedures for redistricting, adding a tie-breaker to the redistricting commission that would be established if the legislature failed to redistrict.[24] During the contentious 1990 redistricting cycle, the potential of an at-large election was raised, with comparisons being made to 1964. Secretary of State George Ryan noted that the situation could become a constitutional crisis.[8] The redistricting commission, with a Republican tie-breaker, was eventually able to decide on a map which was successfully enacted, surviving court challenges from Democrats.[25]
The 1964 election helped launch the political careers of certain Democrats, including Adlai E. Stevenson III, who later represented Illinois in the U.S. Senate, and Harold Washington, who eventually became mayor of Chicago.[8] The last member elected in 1964 to leave the House was Edolo J. Giorgi, a Democrat from Rockford, who served until his death in 1993.[8][26]
Notes
- Popular vote figures represent the total amounts of Democratic and Republican votes. Since every voter could vote for 177 candidates, this sums to a grand total much larger than the population of Illinois.
- Districts were used for both the House of Representatives and the Senate. Each district elected one member to the Senate and three to the House of Representatives with a version cumulative voting, where each voter had three votes, and had the option to vote multiple times for a single candidate. This system was intended to ensure a bipartisan delegation from each district.[1]: 291
References
- McDowell, James L. (2007). "The Orange-Ballot Election: The 1964 Illinois At-Large Vote—and After". Journal of Illinois History. 10: 289-314.
- Carpentier, Charles F. (ed.). Illinois Blue Book (1961-1962 ed.).
- Wehrwein, Austin (October 29, 1964). "Ballot in Illinois Big as Bath Towel". The New York Times. Retrieved March 8, 2021.
- Chamberlain, William H. (ed.). Illinois Blue Book (1963-1964 ed.).
- "Illinois to Elect House At-large". The New York Times. January 5, 1964. Retrieved April 12, 2023.
- "Newspaper Supplement Explains At-Large House Vote". The Southern Illinoisan. October 25, 1964. Retrieved April 12, 2023.
- Pearson, Rick; Hardy, Thomas (December 17, 1991). "Ruling Rekindles Visions of '64 'Bedsheet' Ballot". Chicago Tribune. Retrieved 2021-03-08.
- "This 'Third Slate' Different". The Pantagraph. August 6, 1964. Retrieved September 17, 2023.
- "Third Slate Party Now Distributing Petitions". The Daily Register. Peoria. July 31, 1964. Retrieved September 17, 2023.
- "Third Party is Ruled Out". Daily Chronicle. August 21, 1964. Retrieved September 17, 2023.
- "Questions and Answers on Illinois At-Large Election". The Daily Register. September 24, 1964.
- "Suburb Candidates Merit Our Support". Daily Herald. October 8, 1964.
- "Results Are Delayed". Chicago Tribune. November 4, 1964. Retrieved September 17, 2023.
- Howard, Robert (November 5, 1964). "Illinois House Vote Count Delayed". Chicago Tribune. Retrieved September 17, 2023.
- "Results to be Kept Secret Till Canvass". Chicago Tribune. November 9, 1964. Retrieved September 17, 2023.
- "Downstaters Head G.O.P. Ballot; Chicagoans Trail". Chicago Tribune. November 26, 1964. Retrieved September 17, 2023.
- "35 in G.O.P. Lose State House Seats". Chicago Tribune. December 4, 1964. Retrieved September 17, 2023.
- Weston, Jean (December 17, 1964). "Attorney General Enters Vote Hassle". Daily Herald. Wheaton. Retrieved September 17, 2023.
- "Won't Delay Legislature, Judge Vows". Chicago Tribune. December 25, 1964. Retrieved September 17, 2023.
- Weston, Jean (January 7, 1965). "Democrats Blast Locke's Order to Recount Ballots". Daily Herald. Retrieved September 17, 2023.
- "Official Vote of the State of Illinois". Illinois State Board of Elections. Retrieved September 16, 2023.
- Simpson, Bob (January 7, 1965). "Touhy Elected Speaker of House". The Pantagraph. Retrieved September 17, 2023.
- Green, Paul M. (1987). Legislative Redistricting in Illinois: An Historical Analysis (PDF) (Report). Illinois Commission on Intergovernmental Cooperation.
- Wheeler, Charles N. (November 10, 1992). "Redistricting '91: the World Series of Illinois politics". Illinois Issues. Retrieved September 17, 2023.
- Pearson, Rick (October 25, 1993). "Rep Edolo J. Giorgi; Created State Lottery". Chicago Tribune. Retrieved October 9, 2023.