1990 elections in India
| This article is part of a series on the |
 |
|---|
|
|
Legislative Assembly elections
Bihar
| Party | Seats contested | Seats | Seat change | Popular vote | Percentage | |
|---|---|---|---|---|---|---|
| Janata Dal | 276 | 122 | New Party | 8,212,666 | 25.61% | |
| Indian National Congress | 323 | 71 | 7,946,635 | 24.78% | ||
| Bharatiya Janata Party | 237 | 39 | 3,721,392 | 11.61% | ||
| Communist Party of India | 109 | 23 | 2,112,887 | 6.59% | ||
| Jharkhand Mukti Morcha | 82 | 19 | 1,008,174 | 3.14% | ||
| Indian People's Front | 82 | 7 | New Party | 889,068 | 2.77% | |
| Communist Party of India (Marxist) | 31 | 6 | 427,214 | 1.33% | ||
| Janata Party (JP) | 158 | 3 | New Party | 494,717 | 1.54% | |
| Marxist Co-ordination | 11 | 2 | New Party | 70,365 | 0.22% | |
| Jharkhand Dal | 28 | 1 | New Party | 134,827 | 0.42% | |
| Socialist Party (Lohia) | 47 | 1 | New Party | 109,871 | 0.34% | |
| Independents | 4320 | 30 | 5,907,134 | 18.42% | ||
| Total | 6629 | 324 | 32,063,793 | |||
Source:[1]
Gujarat
| Parties and coalitions | Popular vote | Seats | ||||
|---|---|---|---|---|---|---|
| Votes | % | Won | +/− | |||
| Janata Dal | 3,725,148 | 29.36 | 70 | +70 | ||
| Bharatiya Janata Party (BJP) | 3,386,256 | 26.69 | 67 | +56 | ||
| Indian National Congress (INC) | 3,899,159 | 30.74 | 33 | −116 | ||
| Yuva Vikas Party (YVP) | 1,07,220 | 2.47 | 1 | +1 | ||
| JNP | 69,829 | 0.55 | 0 | 0 | ||
| CPM | 37,436 | 0.30 | 0 | 0 | ||
| CPI | 11,377 | 0.09 | 0 | 0 | ||
| Bahujan Samaj Party (BSP) | 4,565 | 0.04 | 0 | 0 | ||
| Independents (IND) | 1,323,790 | 10.44 | 11 | |||
| Total | 12,685,977 | 100 | 182 | ±0 | ||
| Valid votes | 12,685,977 | 98.03 | ||||
| Invalid votes | 2,69,244 | 1.97 | ||||
| Votes cast / turnout | 12,955,221 | 52.20 | ||||
| Registered voters | 24,820,379 | |||||
Himachal Pradesh
 | |||||
|---|---|---|---|---|---|
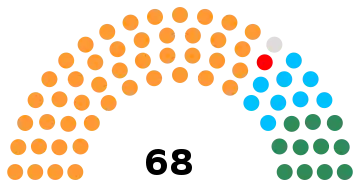
| Party | Votes | % | Seats | +/– | |
| Bharatiya Janata Party | 858,518 | 41.78 | 46 | +39 | |
| Indian National Congress | 750,885 | 36.54 | 9 | –49 | |
| Janata Dal | 222,542 | 10.83 | 11 | New | |
| Communist Party of India | 42,393 | 2.06 | 1 | +1 | |
| Others | 55,139 | 2.68 | 0 | 0 | |
| Independents | 125,421 | 6.10 | 1 | –1 | |
| Total | 2,054,898 | 100.00 | 68 | 0 | |
| Valid votes | 2,054,898 | 99.20 | |||
| Invalid/blank votes | 16,625 | 0.80 | |||
| Total votes | 2,071,523 | 100.00 | |||
| Registered voters/turnout | 2,993,699 | 69.20 | |||
| Source: ECI[2] | |||||
Madhya Pradesh
Source:[3]
| SN | Party | Seats Contested |
Seats won |
Seats Changed |
% Votes |
|---|---|---|---|---|---|
| 1 | Bharatiya Janata Party | 269 | 220 | +162 | 39.14% |
| 2 | Indian National Congress | 318 | 56 | -194 | 33.38% |
| 3 | Janata Dal | 115 | 28 | N/A | 7.71% |
| 4 | Communist Party of India | 183 | 3 | N/A | 1.25% |
| 5 | Bahujan Samaj Party | 63 | 2 | N/A | 3.54% |
| 6 | Krantikari Samajwadi Manch | 20 | +1 | 0.40% | |
| 7 | Independent | 320 | 10 | +4 | 12.31% |
| Total | 320 |
Maharashtra
| Political Party | No. of candidates | No. of elected | Votes polled | Votes (%) | Seat change |
|---|---|---|---|---|---|
| Indian National Congress | 276 | 141 | 11,334,773 | 38.17% | |
| Shiv Sena | 183 | 52 | 4,733,834 | 15.94% | |
| Bharatiya Janata Party | 104 | 42 | 3,180,482 | 10.71% | |
| Janata Dal | 214 | 24 | 3,776,737 | 12.72% | |
| Peasants and Workers Party of India | 40 | 8 | 719,807 | 2.42% | |
| Communist Party of India (Marxist) | 13 | 3 | 258,433 | 0.87% | |
| Communist Party of India | 16 | 2 | 219,080 | 0.74% | |
| Indian Congress (Socialist) – Sarat Chandra Sinha | 71 | 1 | 290,503 | 0.98% | |
| Independents | 2286 | 13 | 4,036,403 | 13.59% | |
Manipur
| Party | Votes | % | Seats | +/– | |
|---|---|---|---|---|---|
| Indian National Congress | 333,765 | 33.71 | 24 | –6 | |
| Janata Dal | 196,207 | 19.82 | 11 | New | |
| Manipur Peoples Party | 192,075 | 19.40 | 9 | +6 | |
| Indian Congress (Socialist) – Sarat Chandra Sinha | 122,829 | 12.41 | 4 | New | |
| Communist Party of India | 41,012 | 4.14 | 3 | +2 | |
| Kuki National Assembly | 25,867 | 2.61 | 2 | +1 | |
| Bharatiya Janata Party | 18,549 | 1.87 | 0 | 0 | |
| Manipur Hill People's Council | 8,820 | 0.89 | 0 | New | |
| National People's Party (India) | 7,762 | 0.78 | 1 | New | |
| Independents | 43,101 | 4.35 | 0 | –21 | |
| Total | 989,987 | 100.00 | 54 | –6 | |
| Valid votes | 989,987 | 98.90 | |||
| Invalid/blank votes | 10,997 | 1.10 | |||
| Total votes | 1,000,984 | 100.00 | |||
| Registered voters/turnout | 1,112,853 | 89.95 | |||
| Source: ECI[4] | |||||
Odisha
 | |||||
|---|---|---|---|---|---|
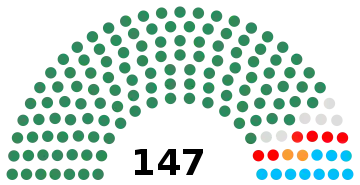
| Party | Votes | % | Seats | +/– | |
| Janata Dal | 5,884,443 | 53.69 | 123 | +102 | |
| Indian National Congress | 3,264,000 | 29.78 | 10 | –107 | |
| Bharatiya Janata Party | 390,060 | 3.56 | 2 | +1 | |
| Communist Party of India | 326,364 | 2.98 | 5 | +4 | |
| Communist Party of India (Marxist) | 91,767 | 0.84 | 1 | 0 | |
| Others | 196,953 | 1.80 | 0 | 0 | |
| Independents | 807,000 | 7.36 | 6 | –1 | |
| Total | 10,960,587 | 100.00 | 147 | 0 | |
| Valid votes | 10,960,587 | 98.02 | |||
| Invalid/blank votes | 221,565 | 1.98 | |||
| Total votes | 11,182,152 | 100.00 | |||
| Registered voters/turnout | 19,745,549 | 56.63 | |||
| Source: ECI[5] | |||||
Rajasthan
 | |||||
|---|---|---|---|---|---|
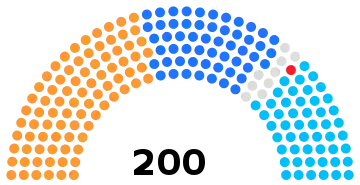
| Party | Votes | % | Seats | +/– | |
| Indian National Congress | 4,988,699 | 33.64 | 50 | –63 | |
| Bharatiya Janata Party | 3,744,945 | 25.25 | 85 | +46 | |
| Janata Dal | 3,200,662 | 21.58 | 55 | +45 | |
| Communist Party of India (Marxist) | 152,555 | 1.03 | 1 | +1 | |
| Others | 539,733 | 3.64 | 0 | 0 | |
| Independents | 2,202,088 | 14.85 | 9 | –1 | |
| Total | 14,828,682 | 100.00 | 200 | 0 | |
| Valid votes | 14,828,682 | 98.37 | |||
| Invalid/blank votes | 245,106 | 1.63 | |||
| Total votes | 15,073,788 | 100.00 | |||
| Registered voters/turnout | 26,405,624 | 57.09 | |||
| Source: ECI[6] | |||||
References
- Election Commission of India. STATISTICAL REPORT ON GENERAL ELECTION, 1990 TO THE LEGISLATIVE ASSEMBLY OF BIHAR
- "Statistical Report on General Election, 1990 to the Legislative Assembly of Himachal Pradesh". Election Commission of India. Retrieved 9 February 2022.
- "STATISTICAL REPORT ON GENERAL ELECTION, 1993 TO THE LEGISLATIVE ASSEMBLY OF MADHYA PRADESH" (PDF). eci.nic.in. Election Commission of India. Retrieved 25 May 2018.
- "Statistical Report on General Election, 1990 to the Legislative Assembly of Manipur". Election Commission of India. Retrieved 29 November 2021.
- "Statistical Report on General Election, 1990 to the Legislative Assembly of Odisha". Election Commission of India. Retrieved 6 February 2022.
- "Statistical Data of Rajasthan Legislative Assembly election 1990". Election Commission of India. Retrieved 14 January 2022.
External links
Wikimedia Commons has media related to 1990 elections in India.
This article is issued from Wikipedia. The text is licensed under Creative Commons - Attribution - Sharealike. Additional terms may apply for the media files.