1994 São Toméan parliamentary election
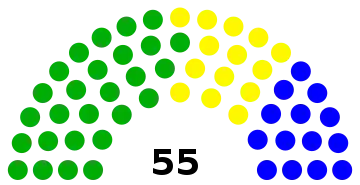
Parliamentary elections were held in São Tomé and Príncipe on 2 October 1994. The result was a victory for the opposition Movement for the Liberation of São Tomé and Príncipe - Social Democratic Party, which won 27 of the 55 seats in the National Assembly. Voter turnout was only 52.1%.[1]
 |
|---|
|
|
Background
In early 1994 relations between the government and the presidency again began to deteriorate. In April Trovoada publicly dissociated himself from government policy. In June political tension increased when the PCD-GR accused Trovoada of systematic obstruction of the government's programme. The same month opposition parties petitioned the president to dismiss the government and to appoint foreign auditors to investigate the management of public funds under its term of office.
On 2 July 1994 Trovoada dismissed the government of Prime Minister Norberto d'Alva Costa Alegre citing 'institutional conflict' as the justification for the decision. Moreover, the president accused the ruling party of ignoring presidential vetoes and of attempting to replace the semi-presidential system with a parliamentary regime without executive powers for the head of state. On 4 July Trovoada appointed Evaristo do Espirito Santo de Carvalho (the minister of defence and security in the outgoing administration) as prime minister. The PCD-GR, which refused to participate in the new government, subsequently expelled Carvalho from the party. An interim administration, comprising eight ministers, took office on 9 July. On the following day, in an attempt to resolve the political crisis, Trovoada dissolved the national assembly and announced that parliamentary elections would be held on 2 October.
Results
 | |||||
|---|---|---|---|---|---|
| Party | Votes | % | Seats | +/– | |
| MLSTP/PSD | 10,782 | 42.53 | 27 | +6 | |
| Independent Democratic Action | 6,660 | 26.27 | 14 | New | |
| Democratic Convergence Party | 6,235 | 24.59 | 14 | –19 | |
| Opposition Democratic Coalition | 1,152 | 4.54 | 0 | –1 | |
| People's Alliance | 342 | 1.35 | 0 | New | |
| Christian Democratic Front | 181 | 0.71 | 0 | 0 | |
| Total | 25,352 | 100.00 | 55 | 0 | |
| Valid votes | 25,352 | 87.12 | |||
| Invalid/blank votes | 3,748 | 12.88 | |||
| Total votes | 29,100 | 100.00 | |||
| Registered voters/turnout | 55,862 | 52.09 | |||
| Source: Nohlen et al. | |||||
References
- Dieter Nohlen, Michael Krennerich & Bernhard Thibaut (1999) Elections in Africa: A data handbook, p746 ISBN 0-19-829645-2