1996 Azorean regional election
The Azores Regional Election (1996) (Portuguese: Eleições Regionais dos Açores, 1996) was an election held on 13 October 1996 for the legislative assembly and government of the Portuguese autonomous region of the Azores.
| |||||||||||||||||||||||||||||||
52 seats to the Legislative Assembly of Azores 27 seats needed for a majority | |||||||||||||||||||||||||||||||
|---|---|---|---|---|---|---|---|---|---|---|---|---|---|---|---|---|---|---|---|---|---|---|---|---|---|---|---|---|---|---|---|
| Turnout | 59.2% | ||||||||||||||||||||||||||||||
| |||||||||||||||||||||||||||||||
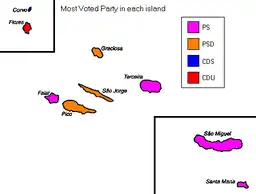
 Map of Azores showing constituencies won | |||||||||||||||||||||||||||||||
| |||||||||||||||||||||||||||||||
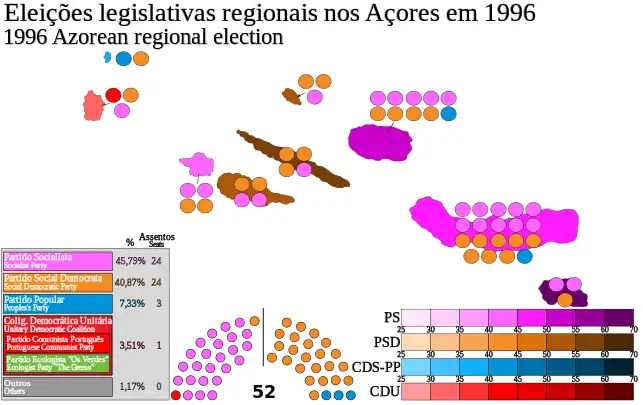
The Socialist Party, under the leadership of Carlos César, was the first party with 45% of the votes, in comparison to their direct rivals, the Social Democratic Party who won 41%, although both parties were tied in seats with each party winning 24 MPs.
Voter turnout was relatively high with just over 59.17% of the electorate casting their ballot on election day.
Political parties
A total of 6 political parties presented lists of candidates for the regional elections in the Azores, where 191,477 electors could elect 52 deputies to the Legislative Assembly. Of these parties, some of the more prominent:
- Democratic Party of the Atlantic (PDA).
- Democratic Unity Coalition (CDU), an alliance of the Greens and Portuguese Communist Party (PCP).
- People's Democratic Union (UDP).
- People's Party (CDS-PP), an alliance with the People's Monarchist Party (PPM).
- Socialist Party (PS), leader Carlos César.
- Social Democratic Party (PSD), leader Alberto Costa.
Results
The winner of the election was the Socialist Party which, for the first time received a plurality of the public vote, although they obtained a comparable number of representatives in the Regional Assembly.
After 20 years of successive right-of-centre Social Democratic victories, Carlos Manuel Martins do Vale César became the new president of the Regional Government, succeeding Alberto Romão Madruga da Costa.
At the same time, the Democratic Alliance of the Azores lost its only deputy, while the People's Party (which had not participated in the last election) elected three deputies (with 7% of the vote). Meanwhile, the Unitary Democratic Coalition, led by the Portuguese Communist Party maintained its one deputy MP by electing one deputy on the island of Flores. The People's Democratic Union did not elect a single deputy.
Summary of votes and seats
| Parties | Votes | % | ±pp swing | MPs | MPs %/ votes % | |||||
|---|---|---|---|---|---|---|---|---|---|---|
| 1992 | 1996 | ± | % | ± | ||||||
| Socialist | 51,906 | 45.82 | 21 | 24 | 46.15 | 1.01 | ||||
| Social Democratic | 46,449 | 41.00 | 28 | 24 | 46.15 | 1.13 | ||||
| People's[A] | 8,346 | 7.37 | — | 1 | 3 | 5.77 | 0.78 | |||
| Democratic Unity Coalition | 3,940 | 3.48 | 1 | 1 | 1.92 | 0.55 | ||||
| People's Democratic Union | 983 | 0.87 | — | — | 0 | — | 0.00 | — | 0.0 | |
| Democratic Party of the Atlantic | 340 | 0.30 | 0 | 0 | 0.00 | 0.0 | ||||
| Total valid | 111,964 | 98.83 | 51 | 52 | 100.00 | — | ||||
| Blank ballots | 705 | 0.62 | ||||||||
| Invalid ballots | 624 | 0.55 | ||||||||
| Total | 113,293 | 100.00 | ||||||||
| Registered voters/turnout | 191,477 | 59.17 | ||||||||
| A The People's Party contested the 1992 election in an alliance formed by the People's Party (1 seat) and the People's Monarchist Party (0 seats). | ||||||||||
| Source: Comissão Nacional de Eleições | ||||||||||
Distribution by constituency
| Constituency | % | S | % | S | % | S | % | S | Total S |
|---|---|---|---|---|---|---|---|---|---|
| PS | PSD | CDS-PP | CDU | ||||||
| Corvo | 29.3 | - | 32.9 | 1 | 35.8 | 1 | 2 | ||
| Faial | 44.6 | 2 | 41.7 | 2 | 6.4 | - | 5.5 | - | 4 |
| Flores | 19.6 | 1 | 30.9 | 1 | 14.9 | - | 33.4 | 1 | 3 |
| Graciosa | 42.5 | 1 | 53.2 | 2 | 1.9 | - | 0.7 | - | 3 |
| Pico | 41.6 | 2 | 50.4 | 2 | 4.7 | - | 1.7 | - | 4 |
| Santa Maria | 60.6 | 2 | 32.3 | 1 | 4.0 | - | 1.5 | - | 3 |
| São Jorge | 29.7 | 1 | 56.0 | 3 | 12.5 | - | 1.0 | - | 4 |
| São Miguel | 46.6 | 10 | 40.3 | 8 | 5.9 | 1 | 3.8 | - | 19 |
| Terceira | 50.4 | 5 | 36.8 | 4 | 10.2 | 1 | 1.2 | - | 10 |
| Total | 45.8 | 24 | 41.0 | 24 | 7.4 | 3 | 3.5 | 1 | 52 |
| Source: Comissão Nacional de Eleições | |||||||||
Maps
 Map showing island constituencies won by political parties.
