2019 Maltese local elections
Local council elections were held in Malta by 25 May 2019.[1] For the first time, all 68 municipal council were renewed at the same time, following a reform partially initiated in the 2015 election, in which half were.[2]
| ||||||||||||||||||||||||||||||||||||||||||||||||||
| Turnout | 62.69% | |||||||||||||||||||||||||||||||||||||||||||||||||
|---|---|---|---|---|---|---|---|---|---|---|---|---|---|---|---|---|---|---|---|---|---|---|---|---|---|---|---|---|---|---|---|---|---|---|---|---|---|---|---|---|---|---|---|---|---|---|---|---|---|---|
| ||||||||||||||||||||||||||||||||||||||||||||||||||
 | ||||||||||||||||||||||||||||||||||||||||||||||||||


Results
Overall results
The election was not held in Mdina, since the number of candidates was equal to the number of seats. Therefore, the five candidates were directly elected. Turnout was under 40% in Gżira, Sliema, St. Julian's and St. Paul's Bay.[3]
| Party | Votes | % | Seats | |
|---|---|---|---|---|
| Labour Party | 150,514 | 57.96 | 270 | |
| Nationalist Party | 103,398 | 39.82 | 190 | |
| Democratic Alternative | 1,997 | 0.77 | 0 | |
| Democratic Party | 555 | 0.21 | 0 | |
| Għarb l-Ewwel | 417 | 0.16 | 2 | |
| Moviment Patrijotti Maltin | 376 | 0.14 | 0 | |
| Floriana First | 141 | 0.05 | 0 | |
| Independents | 2,276 | 0.88 | 2 | |
| Total | 259,674 | 100.00 | 464 | |
| Valid votes | 259,674 | 95.62 | ||
| Invalid/blank votes | 11,895 | 4.38 | ||
| Total votes | 271,569 | 100.00 | ||
| Registered voters/turnout | 433,596 | 62.63 | ||
| Source: Electoral Commission | ||||
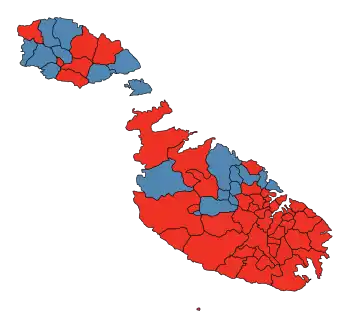
Results by council
| Locality | Labour Party | Nationalist Party | ADand/or
Others |
Control | ||||
|---|---|---|---|---|---|---|---|---|
| % | Seats | % | Seats | % | Seats | Party | ||
| Attard | 28.9 | 3 | 65.5 | 6 | 5.8 | 0 | PN | |
| Balzan | 27.9 | 1 | 72.2 | 4 | – | – | PN | |
| Birgu | 81.2 | 4 | 18.9 | 1 | – | – | PL | |
| Birkirkara | 52.3 | 7 | 43.7 | 6 | 4.2 | 0 | PL | |
| Birżebbuġa | 76.0 | 7 | 24.1 | 2 | – | – | PL | |
| Cospicua | 84.2 | 6 | 15.8 | 1 | – | – | PL | |
| Dingli | 73.9 | 5 | 26.2 | 1 | – | – | PL | |
| Fgura | 74.0 | 7 | 24.9 | 2 | 1.2 | 0 | PL | |
| Floriana | 58.7 | 3 | 31.2 | 2 | 10.3 | 0 | PL | |
| Fontana | 52.1 | 2 | 48.0 | 3 | – | – | PN | |
| Għajnsielem | 31.4 | 1 | 68.7 | 4 | – | – | PN | |
| Għarb | 44.8 | 2 | 12.3 | 1 | 42.9 | 2 | No overall control | |
| Għargħur | 45.7 | 2 | 54.4 | 3 | – | – | PN | |
| Għasri | 46.1 | 2 | 54.0 | 3 | – | – | PN | |
| Għaxaq | 79.3 | 4 | 20.8 | 1 | – | – | PL | |
| Gudja | 62.8 | 3 | 33.5 | 2 | 3.8 | 0 | PL | |
| Gżira | 59.7 | 5 | 37.7 | 4 | 2.8 | 0 | PL | |
| Ħamrun | 62.9 | 5 | 33.9 | 2 | 3.5 | 0 | PL | |
| Iklin | 43.6 | 2 | 56.5 | 3 | – | – | PN | |
| Kalkara | 72.6 | 4 | 27.5 | 1 | – | – | PL | |
| Kerċem | 34.1 | 2 | 66.0 | 3 | – | – | PN | |
| Kirkop | 64.6 | 3 | 30.3 | 2 | 5.3 | 0 | PL | |
| Lija | 34.0 | 2 | 66.1 | 3 | – | – | PN | |
| Luqa | 73.8 | 5 | 26.3 | 2 | – | – | PL | |
| Marsa | 72.9 | 6 | 21.5 | 1 | 5.8 | 0 | PL | |
| Marsaskala | 69.7 | 7 | 26.3 | 2 | 4.2 | 0 | PL | |
| Marsaxlokk | 78.4 | 5 | 21.7 | 1 | – | – | PL | |
| Mdina | – | 1 | – | 4 | – | – | PN | |
| Mellieħa | 48.5 | 5 | 47.2 | 4 | 4.4 | 0 | PL | |
| Mġarr | 41.6 | 2 | 58.5 | 3 | – | – | PN | |
| Mosta | 51.5 | 7 | 48.6 | 6 | – | – | PL | |
| Mqabba | 64.1 | 3 | 36.0 | 2 | – | – | PL | |
| Msida | 51.0 | 5 | 44.8 | 4 | 4.4 | 0 | PL | |
| Mtarfa | 63.1 | 3 | 37.0 | 2 | – | – | PL | |
| Munxar | 48.1 | 2 | 52.0 | 3 | – | – | PN | |
| Nadur | 42.4 | 2 | 57.7 | 3 | – | – | PN | |
| Naxxar | 36.9 | 4 | 59.1 | 5 | 4.2 | 0 | PN | |
| Paola | 74.7 | 5 | 25.4 | 2 | – | – | PL | |
| Pembroke | 60.8 | 3 | 39.3 | 2 | – | – | PL | |
| Pietà | 69.4 | 3 | 30.7 | 2 | – | – | PL | |
| Qala | 70.3 | 3 | 29.8 | 2 | – | – | PL | |
| Qormi | 64.6 | 7 | 35.5 | 4 | – | – | PL | |
| Qrendi | 69.6 | 4 | 28.1 | 1 | 2.4 | 0 | PL | |
| Rabat | 57.0 | 5 | 43.1 | 4 | – | – | PL | |
| Safi | 63.5 | 3 | 36.6 | 2 | – | – | PL | |
| St. Julian's | 35.8 | 3 | 58.6 | 6 | 5.8 | 0 | PN | |
| St. Paul's Bay | 50.2 | 7 | 42.9 | 6 | 7.2 | 0 | PL | |
| San Ġwann | 50.7 | 5 | 49.4 | 4 | – | – | PL | |
| San Lawrenz | 29.8 | 1 | 70.3 | 4 | – | – | PN | |
| Sannat | 77.1 | 4 | 23.0 | 1 | – | – | PL | |
| Santa Luċija | 76.4 | 4 | 23.7 | 1 | – | – | PL | |
| Santa Venera | 58.6 | 4 | 41.5 | 3 | – | – | PL | |
| Senglea | 79.2 | 4 | 20.9 | 1 | – | – | PL | |
| Siġġiewi | 50.7 | 4 | 49.4 | 3 | – | – | PL | |
| Sliema | 25.3 | 3 | 70.7 | 10 | 4.0 | 0 | PN | |
| Swieqi | 23.1 | 2 | 76.9 | 7 | – | – | PN | |
| Tarxien | 73.8 | 5 | 25.0 | 2 | 1.2 | PL | ||
| Valletta | 53.0 | 4 | 45.9 | 3 | 1.1 | 0 | PL | |
| Victoria | 41.0 | 3 | 59.1 | 4 | – | – | PN | |
| Ta' Xbiex | 62.5 | 3 | 37.5 | 2 | – | – | PL | |
| Xagħra | 66.0 | 4 | 34.0 | 1 | – | – | PL | |
| Xewkija | 62.9 | 4 | 37.2 | 1 | – | – | PL | |
| Xgħajra | 82.0 | 4 | 15.5 | 1 | 2.5 | 0 | PL | |
| Żabbar | 75.3 | 9 | 24.8 | 2 | – | – | PL | |
| Żebbuġ (Città Rohan) | 58.9 | 5 | 27.6 | 3 | 13.5 | 1 | PL | |
| Żebbuġ | 40.7 | 2 | 43.1 | 2 | 16.2 | 1 | No overall control | |
| Żejtun | 80.1 | 7 | 20.0 | 2 | – | – | PL | |
| Żurrieq | 76.4 | 7 | 23.7 | 2 | – | – | PL | |
References
- "Next electoral commitment probably for 25 May 2019 - TVM News". TVM English. Retrieved 2018-07-08.
- Malta is getting ready for local elections
- "Counting of local council votes begins today - The Malta Independent". www.independent.com.mt. Retrieved 2019-09-02.
External links
This article is issued from Wikipedia. The text is licensed under Creative Commons - Attribution - Sharealike. Additional terms may apply for the media files.