Aakirkeby (nomination district)
Aakirkeby nominating district is one of the 92 nominating districts that exists for Danish elections following the 2007 municipal reform.[3][4][5] It is one of the 2 nominating districts in Bornholm Municipality, the other being Rønne.[6] It was created in 1849 as a constituency,[7] and has been a nomination district since 1920, though its boundaries were changed in 1970.
| Aakirkeby | |
|---|---|
| Aakirkeby | |
| Nomination district constituency for the Folketing | |
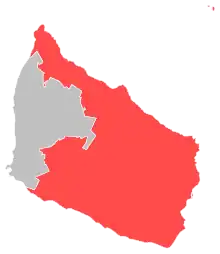 Location of Aakirkeby within Bornholm | |
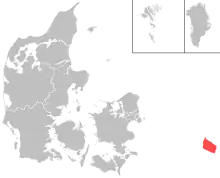 Location of Bornholm within Denmark | |
| Municipalities | Bornholm |
| Constituency | Bornholm |
| Electorate | 15,348 (2022)[1] |
| Current constituency | |
| Created | 1849 (as constituency)[2] 1920 (as nomination district) |
In general elections, the district tends to vote close to the national result when looking at the voter split between the two blocs.[9]
General elections results
General elections in the 2020s
| Parties | Vote | |||||
|---|---|---|---|---|---|---|
| Votes | % | + / - | ||||
| Social Democrats | 4,064 | 32.71 | +1.70 | |||
| Venstre | 2,447 | 19.70 | -6.97 | |||
| Denmark Democrats | 862 | 6.94 | New | |||
| Green Left | 789 | 6.35 | +2.02 | |||
| Moderates | 751 | 6.05 | New | |||
| Red–Green Alliance | 743 | 5.98 | -2.98 | |||
| Danish People's Party | 739 | 5.95 | -4.63 | |||
| Liberal Alliance | 457 | 3.68 | +2.56 | |||
| Conservatives | 447 | 3.60 | +1.94 | |||
| The Alternative | 377 | 3.03 | -0.60 | |||
| Christian Democrats | 281 | 2.26 | -2.02 | |||
| New Right | 274 | 2.21 | +0.56 | |||
| Social Liberals | 145 | 1.17 | -2.25 | |||
| Independent Greens | 25 | 0.20 | New | |||
| Charlotte Petersen | 22 | 0.18 | New | |||
| Total | 12,423 | |||||
| Source[10] | ||||||
General elections in the 2010s
| Parties | Vote | |||||
|---|---|---|---|---|---|---|
| Votes | % | + / - | ||||
| Social Democrats | 3,965 | 31.01 | +0.73 | |||
| Venstre | 3,410 | 26.67 | +4.89 | |||
| Danish People's Party | 1,353 | 10.58 | -9.02 | |||
| Red–Green Alliance | 1,146 | 8.96 | -0.08 | |||
| Green Left | 553 | 4.33 | +1.50 | |||
| Christian Democrats | 547 | 4.28 | +1.04 | |||
| The Alternative | 464 | 3.63 | -2.05 | |||
| Social Liberals | 437 | 3.42 | +1.74 | |||
| Stram Kurs | 215 | 1.68 | New | |||
| Conservatives | 212 | 1.66 | +0.17 | |||
| New Right | 211 | 1.65 | New | |||
| Liberal Alliance | 143 | 1.12 | -3.27 | |||
| Klaus Riskær Pedersen Party | 130 | 1.02 | New | |||
| Total | 12,786 | |||||
| Source[11] | ||||||
| Parties | Vote | |||||
|---|---|---|---|---|---|---|
| Votes | % | + / - | ||||
| Social Democrats | 4,007 | 30.28 | -2.19 | |||
| Venstre | 2,882 | 21.78 | -6.89 | |||
| Danish People's Party | 2,594 | 19.60 | +8.11 | |||
| Red–Green Alliance | 1,196 | 9.04 | +1.20 | |||
| The Alternative | 752 | 5.68 | New | |||
| Liberal Alliance | 581 | 4.39 | +2.51 | |||
| Christian Democrats | 429 | 3.24 | +0.39 | |||
| Green Left | 374 | 2.83 | -4.58 | |||
| Social Liberals | 223 | 1.68 | -3.79 | |||
| Conservatives | 197 | 1.49 | -0.42 | |||
| Total | 13,235 | |||||
| Source[12] | ||||||
| Parties | Vote | |||||
|---|---|---|---|---|---|---|
| Votes | % | + / - | ||||
| Social Democrats | 4,550 | 32.47 | +0.84 | |||
| Venstre | 4,018 | 28.67 | -0.25 | |||
| Danish People's Party | 1,611 | 11.49 | -0.65 | |||
| Red–Green Alliance | 1,099 | 7.84 | +5.70 | |||
| Green Left | 1,038 | 7.41 | -4.83 | |||
| Social Liberals | 767 | 5.47 | +3.35 | |||
| Christian Democrats | 400 | 2.85 | +0.75 | |||
| Conservatives | 268 | 1.91 | -4.02 | |||
| Liberal Alliance | 264 | 1.88 | -0.83 | |||
| Total | 14,015 | |||||
| Source[13] | ||||||
General elections in the 2000s
| Parties | Vote | |||||
|---|---|---|---|---|---|---|
| Votes | % | + / - | ||||
| Social Democrats | 4,617 | 31.63 | +2.01 | |||
| Venstre | 4,221 | 28.92 | -8.93 | |||
| Green Left | 1,787 | 12.24 | +8.30 | |||
| Danish People's Party | 1,772 | 12.14 | +2.41 | |||
| Conservatives | 866 | 5.93 | +3.24 | |||
| New Alliance | 396 | 2.71 | New | |||
| Red–Green Alliance | 312 | 2.14 | -2.53 | |||
| Social Liberals | 310 | 2.12 | -2.05 | |||
| Christian Democrats | 306 | 2.10 | -2.05 | |||
| Mogens Nebelong | 9 | 0.06 | New | |||
| Total | 14,596 | |||||
| Source[14] | ||||||
| Parties | Vote | |||||
|---|---|---|---|---|---|---|
| Votes | % | + / - | ||||
| Venstre | 5,452 | 37.85 | -0.38 | |||
| Social Democrats | 4,266 | 29.62 | -4.45 | |||
| Danish People's Party | 1,401 | 9.73 | +0.27 | |||
| Red–Green Alliance | 673 | 4.67 | +2.35 | |||
| Social Liberals | 600 | 4.17 | +2.07 | |||
| Christian Democrats | 598 | 4.15 | +0.13 | |||
| Green Left | 567 | 3.94 | -0.74 | |||
| Conservatives | 387 | 2.69 | -0.69 | |||
| Poul Erik Jessen | 268 | 1.86 | New | |||
| Centre Democrats | 92 | 0.64 | -0.33 | |||
| Tonny Rajnar Jarl Borrinjaland | 60 | 0.42 | New | |||
| Minority Party | 39 | 0.27 | New | |||
| Total | 14,403 | |||||
| Source[15] | ||||||
| Parties | Vote | |||||
|---|---|---|---|---|---|---|
| Votes | % | + / - | ||||
| Venstre | 5,748 | 38.23 | +1.98 | |||
| Social Democrats | 5,122 | 34.07 | -1.85 | |||
| Danish People's Party | 1,423 | 9.46 | +4.04 | |||
| Green Left | 704 | 4.68 | -0.61 | |||
| Christian People's Party | 605 | 4.02 | -1.46 | |||
| Conservatives | 508 | 3.38 | +0.96 | |||
| Red–Green Alliance | 349 | 2.32 | -0.37 | |||
| Social Liberals | 315 | 2.10 | -0.05 | |||
| Centre Democrats | 146 | 0.97 | -1.26 | |||
| Progress Party | 115 | 0.76 | -0.78 | |||
| Total | 15,035 | |||||
| Source[16] | ||||||
General elections in the 1990s
| Parties | Vote | |||||
|---|---|---|---|---|---|---|
| Votes | % | + / - | ||||
| Venstre | 5,353 | 36.25 | +6.26 | |||
| Social Democrats | 5,304 | 35.92 | +0.46 | |||
| Christian People's Party | 809 | 5.48 | +0.20 | |||
| Danish People's Party | 800 | 5.42 | New | |||
| Green Left | 781 | 5.29 | +0.14 | |||
| Red–Green Alliance | 397 | 2.69 | -0.30 | |||
| Conservatives | 358 | 2.42 | -4.46 | |||
| Centre Democrats | 329 | 2.23 | -0.21 | |||
| Social Liberals | 317 | 2.15 | -0.83 | |||
| Progress Party | 228 | 1.54 | -5.31 | |||
| Democratic Renewal | 91 | 0.62 | New | |||
| Total | 14,767 | |||||
| Source[17] | ||||||
| Parties | Vote | |||||
|---|---|---|---|---|---|---|
| Votes | % | + / - | ||||
| Social Democrats | 5,166 | 35.46 | -3.24 | |||
| Venstre | 4,369 | 29.99 | +3.82 | |||
| Conservatives | 1,003 | 6.88 | +0.31 | |||
| Progress Party | 998 | 6.85 | +0.89 | |||
| Christian People's Party | 769 | 5.28 | -0.81 | |||
| Green Left | 750 | 5.15 | +0.26 | |||
| Red–Green Alliance | 435 | 2.99 | +1.94 | |||
| Social Liberals | 434 | 2.98 | +1.23 | |||
| Centre Democrats | 355 | 2.44 | -0.14 | |||
| Sigvard Mossin Kofoed | 291 | 2.00 | New | |||
| Total | 14,570 | |||||
| Source[18] | ||||||
| Parties | Vote | |||||
|---|---|---|---|---|---|---|
| Votes | % | + / - | ||||
| Social Democrats | 5,736 | 38.70 | +8.45 | |||
| Venstre | 3,878 | 26.17 | +2.90 | |||
| Conservatives | 973 | 6.57 | -3.27 | |||
| Christian People's Party | 903 | 6.09 | +0.15 | |||
| Progress Party | 884 | 5.96 | -5.89 | |||
| Green Left | 725 | 4.89 | -4.03 | |||
| Centre Democrats | 382 | 2.58 | +0.16 | |||
| Erik Truelsen | 372 | 2.51 | New | |||
| Common Course | 319 | 2.15 | +0.42 | |||
| Social Liberals | 260 | 1.75 | -1.85 | |||
| Red–Green Alliance | 156 | 1.05 | New | |||
| The Greens | 152 | 1.03 | -0.46 | |||
| Justice Party of Denmark | 81 | 0.55 | New | |||
| Total | 14,821 | |||||
| Source[19] | ||||||
General elections in the 1980s
| Parties | Vote | |||||
|---|---|---|---|---|---|---|
| Votes | % | + / - | ||||
| Social Democrats | 4,656 | 30.25 | +0.01 | |||
| Venstre | 3,581 | 23.27 | +0.42 | |||
| Progress Party | 1,824 | 11.85 | +5.90 | |||
| Conservatives | 1,515 | 9.84 | -2.89 | |||
| Green Left | 1,373 | 8.92 | -0.62 | |||
| Christian People's Party | 914 | 5.94 | -0.17 | |||
| Social Liberals | 554 | 3.60 | -0.38 | |||
| Centre Democrats | 372 | 2.42 | -0.28 | |||
| Common Course | 267 | 1.73 | -0.66 | |||
| The Greens | 229 | 1.49 | -0.05 | |||
| Communist Party of Denmark | 68 | 0.44 | -0.09 | |||
| Left Socialists | 39 | 0.25 | -0.49 | |||
| Total | 15,392 | |||||
| Source[20] | ||||||
| Parties | Vote | |||||
|---|---|---|---|---|---|---|
| Votes | % | + / - | ||||
| Social Democrats | 4,759 | 30.24 | -0.33 | |||
| Venstre | 3,596 | 22.85 | -5.51 | |||
| Conservatives | 2,004 | 12.73 | -1.44 | |||
| Green Left | 1,501 | 9.54 | +3.29 | |||
| Christian People's Party | 961 | 6.11 | -0.08 | |||
| Progress Party | 937 | 5.95 | +0.60 | |||
| Social Liberals | 626 | 3.98 | +0.24 | |||
| Centre Democrats | 425 | 2.70 | +0.40 | |||
| Common Course | 376 | 2.39 | New | |||
| The Greens | 242 | 1.54 | New | |||
| Left Socialists | 117 | 0.74 | -0.68 | |||
| Communist Party of Denmark | 83 | 0.53 | +0.12 | |||
| Justice Party of Denmark | 69 | 0.44 | -0.70 | |||
| Humanist Party | 27 | 0.17 | New | |||
| Ulrik Solberg Rasmussen | 9 | 0.06 | New | |||
| Marxist–Leninists Party | 4 | 0.03 | 0.00 | |||
| Socialist Workers Party | 2 | 0.01 | -0.05 | |||
| Total | 15,738 | |||||
| Source[21] | ||||||
| Parties | Vote | |||||
|---|---|---|---|---|---|---|
| Votes | % | + / - | ||||
| Social Democrats | 4,944 | 30.57 | +0.60 | |||
| Venstre | 4,586 | 28.36 | +3.16 | |||
| Conservatives | 2,291 | 14.17 | +8.12 | |||
| Green Left | 1,011 | 6.25 | +0.18 | |||
| Christian People's Party | 1,001 | 6.19 | +0.07 | |||
| Progress Party | 865 | 5.35 | -9.64 | |||
| Social Liberals | 605 | 3.74 | +0.16 | |||
| Centre Democrats | 372 | 2.30 | -2.65 | |||
| Left Socialists | 230 | 1.42 | +0.18 | |||
| Justice Party of Denmark | 185 | 1.14 | +0.13 | |||
| Communist Party of Denmark | 67 | 0.41 | -0.11 | |||
| Socialist Workers Party | 10 | 0.06 | +0.03 | |||
| Marxist–Leninists Party | 5 | 0.03 | New | |||
| Total | 16,172 | |||||
| Source[22] | ||||||
| Parties | Vote | |||||
|---|---|---|---|---|---|---|
| Votes | % | + / - | ||||
| Social Democrats | 4,634 | 29.97 | -1.64 | |||
| Venstre | 3,896 | 25.20 | +1.24 | |||
| Progress Party | 2,317 | 14.99 | -1.54 | |||
| Christian People's Party | 946 | 6.12 | -0.70 | |||
| Green Left | 939 | 6.07 | +2.80 | |||
| Conservatives | 935 | 6.05 | -0.67 | |||
| Centre Democrats | 766 | 4.95 | +3.18 | |||
| Social Liberals | 553 | 3.58 | -0.21 | |||
| Left Socialists | 192 | 1.24 | -0.75 | |||
| Justice Party of Denmark | 156 | 1.01 | -0.92 | |||
| Communist Party of Denmark | 81 | 0.52 | -0.62 | |||
| Anders Højmark Andersen | 22 | 0.14 | New | |||
| Communist Workers Party | 18 | 0.12 | -0.34 | |||
| Socialist Workers Party | 5 | 0.03 | New | |||
| Total | 15,460 | |||||
| Source[23] | ||||||
General elections in the 1970s
| Parties | Vote | |||||
|---|---|---|---|---|---|---|
| Votes | % | + / - | ||||
| Social Democrats | 4,867 | 31.61 | +2.21 | |||
| Venstre | 3,689 | 23.96 | -4.11 | |||
| Progress Party | 2,545 | 16.53 | -1.88 | |||
| Christian People's Party | 1,050 | 6.82 | -0.19 | |||
| Conservatives | 1,035 | 6.72 | +2.98 | |||
| Social Liberals | 584 | 3.79 | +1.60 | |||
| Green Left | 503 | 3.27 | +1.30 | |||
| Left Socialists | 306 | 1.99 | +0.34 | |||
| Justice Party of Denmark | 297 | 1.93 | -0.32 | |||
| Centre Democrats | 272 | 1.77 | -1.18 | |||
| Communist Party of Denmark | 176 | 1.14 | -0.47 | |||
| Communist Workers Party | 71 | 0.46 | New | |||
| Total | 15,395 | |||||
| Source[24] | ||||||
| Parties | Vote | |||||
|---|---|---|---|---|---|---|
| Votes | % | + / - | ||||
| Social Democrats | 4,409 | 29.40 | +3.10 | |||
| Venstre | 4,210 | 28.07 | -2.75 | |||
| Progress Party | 2,761 | 18.41 | +0.13 | |||
| Christian People's Party | 1,051 | 7.01 | -2.78 | |||
| Conservatives | 561 | 3.74 | +0.91 | |||
| Centre Democrats | 442 | 2.95 | +1.81 | |||
| Justice Party of Denmark | 337 | 2.25 | +1.04 | |||
| Social Liberals | 329 | 2.19 | -2.00 | |||
| Green Left | 295 | 1.97 | -0.20 | |||
| Left Socialists | 247 | 1.65 | +0.40 | |||
| Communist Party of Denmark | 242 | 1.61 | -0.41 | |||
| Pensioners' Party | 113 | 0.75 | New | |||
| Total | 14,997 | |||||
| Source[25] | ||||||
| Parties | Vote | |||||
|---|---|---|---|---|---|---|
| Votes | % | + / - | ||||
| Venstre | 4,523 | 30.82 | +10.10 | |||
| Social Democrats | 3,860 | 26.30 | +3.22 | |||
| Progress Party | 2,682 | 18.28 | -3.20 | |||
| Christian People's Party | 1,436 | 9.79 | +0.28 | |||
| Social Liberals | 615 | 4.19 | -3.46 | |||
| Conservatives | 415 | 2.83 | -2.06 | |||
| Green Left | 318 | 2.17 | -0.69 | |||
| Communist Party of Denmark | 297 | 2.02 | +0.35 | |||
| Left Socialists | 184 | 1.25 | +0.40 | |||
| Justice Party of Denmark | 177 | 1.21 | -0.94 | |||
| Centre Democrats | 168 | 1.14 | -4.01 | |||
| Total | 14,675 | |||||
| Source[26] | ||||||
| Parties | Vote | |||||
|---|---|---|---|---|---|---|
| Votes | % | + / - | ||||
| Social Democrats | 3,351 | 23.08 | -13.76 | |||
| Progress Party | 3,119 | 21.48 | New | |||
| Venstre | 3,008 | 20.72 | -4.61 | |||
| Christian People's Party | 1,381 | 9.51 | +2.83 | |||
| Social Liberals | 1,111 | 7.65 | -3.86 | |||
| Centre Democrats | 748 | 5.15 | New | |||
| Conservatives | 710 | 4.89 | -6.41 | |||
| Green Left | 415 | 2.86 | -2.12 | |||
| Justice Party of Denmark | 312 | 2.15 | +0.32 | |||
| Communist Party of Denmark | 242 | 1.67 | +1.06 | |||
| Left Socialists | 123 | 0.85 | -0.08 | |||
| Total | 14,520 | |||||
| Source[27] | ||||||
| Parties | Vote | |||||
|---|---|---|---|---|---|---|
| Votes | % | + / - | ||||
| Social Democrats | 5,087 | 36.84 | +5.29 | |||
| Venstre | 3,498 | 25.33 | -8.70 | |||
| Social Liberals | 1,589 | 11.51 | -1.60 | |||
| Conservatives | 1,560 | 11.30 | -3.36 | |||
| Christian People's Party | 923 | 6.68 | New | |||
| Green Left | 687 | 4.98 | +2.14 | |||
| Justice Party of Denmark | 253 | 1.83 | +0.74 | |||
| Left Socialists | 128 | 0.93 | -0.06 | |||
| Communist Party of Denmark | 84 | 0.61 | +0.20 | |||
| Total | 13,809 | |||||
| Source[28] | ||||||
General elections in the 1960s
| Parties | Vote | |||||
|---|---|---|---|---|---|---|
| Votes | % | + / - | ||||
| Venstre | 3,631 | 34.03 | -0.30 | |||
| Social Democrats | 3,367 | 31.55 | -5.86 | |||
| Conservatives | 1,564 | 14.66 | +1.29 | |||
| Social Liberals | 1,399 | 13.11 | +6.23 | |||
| Green Left | 303 | 2.84 | -0.80 | |||
| Justice Party of Denmark | 116 | 1.09 | -0.29 | |||
| Left Socialists | 106 | 0.99 | New | |||
| Liberal Centre | 90 | 0.84 | -0.52 | |||
| Independent Party | 51 | 0.48 | -0.79 | |||
| Communist Party of Denmark | 44 | 0.41 | +0.05 | |||
| Total | 10,671 | |||||
| Source[29] | ||||||
| Parties | Vote | |||||
|---|---|---|---|---|---|---|
| Votes | % | + / - | ||||
| Social Democrats | 4,000 | 37.41 | -1.80 | |||
| Venstre | 3,670 | 34.33 | -3.67 | |||
| Conservatives | 1,429 | 13.37 | +0.80 | |||
| Social Liberals | 736 | 6.88 | +1.92 | |||
| Green Left | 389 | 3.64 | +2.10 | |||
| Justice Party of Denmark | 148 | 1.38 | -0.40 | |||
| Liberal Centre | 145 | 1.36 | New | |||
| Independent Party | 136 | 1.27 | +0.19 | |||
| Communist Party of Denmark | 38 | 0.36 | -0.14 | |||
| Total | 10,691 | |||||
| Source[30] | ||||||
| Parties | Vote | |||||
|---|---|---|---|---|---|---|
| Votes | % | + / - | ||||
| Social Democrats | 3,936 | 39.21 | +0.25 | |||
| Venstre | 3,814 | 38.00 | -1.72 | |||
| Conservatives | 1,262 | 12.57 | +2.63 | |||
| Social Liberals | 498 | 4.96 | -0.88 | |||
| Justice Party of Denmark | 179 | 1.78 | -1.08 | |||
| Green Left | 155 | 1.54 | +0.33 | |||
| Independent Party | 108 | 1.08 | +0.09 | |||
| Communist Party of Denmark | 50 | 0.50 | +0.02 | |||
| Danish Unity | 35 | 0.35 | New | |||
| Total | 10,037 | |||||
| Source[31] | ||||||
| Parties | Vote | |||||
|---|---|---|---|---|---|---|
| Votes | % | + / - | ||||
| Venstre | 3,839 | 39.72 | -1.13 | |||
| Social Democrats | 3,765 | 38.96 | +2.00 | |||
| Conservatives | 961 | 9.94 | +0.83 | |||
| Social Liberals | 564 | 5.84 | -0.16 | |||
| Justice Party of Denmark | 276 | 2.86 | -1.62 | |||
| Green Left | 117 | 1.21 | New | |||
| Independent Party | 96 | 0.99 | -0.91 | |||
| Communist Party of Denmark | 46 | 0.48 | -0.23 | |||
| Total | 9,664 | |||||
| Source[32] | ||||||
General elections in the 1950s
| Parties | Vote | |||||
|---|---|---|---|---|---|---|
| Votes | % | + / - | ||||
| Venstre | 4,105 | 40.85 | +0.51 | |||
| Social Democrats | 3,714 | 36.96 | -2.53 | |||
| Conservatives | 915 | 9.11 | +0.24 | |||
| Social Liberals | 603 | 6.00 | -0.28 | |||
| Justice Party of Denmark | 450 | 4.48 | +0.56 | |||
| Independent Party | 191 | 1.90 | New | |||
| Communist Party of Denmark | 71 | 0.71 | -0.38 | |||
| Total | 10,049 | |||||
| Source[33] | ||||||
September 1953 Danish Folketing election
| Parties | Vote | |||||
|---|---|---|---|---|---|---|
| Votes | % | + / - | ||||
| Venstre | 3,896 | 40.34 | +2.17 | |||
| Social Democrats | 3,814 | 39.49 | -0.37 | |||
| Conservatives | 857 | 8.87 | -0.82 | |||
| Social Liberals | 607 | 6.28 | +0.11 | |||
| Justice Party of Denmark | 379 | 3.92 | -1.21 | |||
| Communist Party of Denmark | 105 | 1.09 | +0.11 | |||
| Total | 9,658 | |||||
| Source[34] | ||||||
April 1953 Danish Folketing election
| Parties | Vote | |||||
|---|---|---|---|---|---|---|
| Votes | % | + / - | ||||
| Social Democrats | 3,628 | 39.86 | +2.36 | |||
| Venstre | 3,474 | 38.17 | +2.15 | |||
| Conservatives | 882 | 9.69 | -0.50 | |||
| Social Liberals | 562 | 6.17 | -0.98 | |||
| Justice Party of Denmark | 467 | 5.13 | -2.96 | |||
| Communist Party of Denmark | 89 | 0.98 | -0.07 | |||
| Total | 9,102 | |||||
| Source[35] | ||||||
1950 Danish Folketing election
| Parties | Vote | |||||
|---|---|---|---|---|---|---|
| Votes | % | + / - | ||||
| Social Democrats | 3,458 | 37.50 | +0.37 | |||
| Venstre | 3,322 | 36.02 | -6.95 | |||
| Conservatives | 940 | 10.19 | +3.07 | |||
| Justice Party of Denmark | 746 | 8.09 | +4.51 | |||
| Social Liberals | 659 | 7.15 | +1.02 | |||
| Communist Party of Denmark | 97 | 1.05 | -0.50 | |||
| Total | 9,222 | |||||
| Source[36] | ||||||
General elections in the 1940s
1947 Danish Folketing election
| Parties | Vote | |||||
|---|---|---|---|---|---|---|
| Votes | % | + / - | ||||
| Venstre | 4,208 | 42.97 | +0.69 | |||
| Social Democrats | 3,636 | 37.13 | +4.25 | |||
| Conservatives | 697 | 7.12 | -1.60 | |||
| Social Liberals | 600 | 6.13 | -1.25 | |||
| Justice Party of Denmark | 351 | 3.58 | +1.14 | |||
| Communist Party of Denmark | 152 | 1.55 | -0.91 | |||
| Danish Unity | 149 | 1.52 | -2.32 | |||
| Total | 9,793 | |||||
| Source[37] | ||||||
1945 Danish Folketing election
| Parties | Vote | |||||
|---|---|---|---|---|---|---|
| Votes | % | + / - | ||||
| Venstre | 4,035 | 42.28 | +4.67 | |||
| Social Democrats | 3,138 | 32.88 | -5.40 | |||
| Conservatives | 832 | 8.72 | -1.38 | |||
| Social Liberals | 704 | 7.38 | +0.79 | |||
| Danish Unity | 366 | 3.84 | +2.33 | |||
| Communist Party of Denmark | 235 | 2.46 | New | |||
| Justice Party of Denmark | 233 | 2.44 | -0.07 | |||
| Total | 9,543 | |||||
| Source[38] | ||||||
1943 Danish Folketing election
| Parties | Vote | |||||
|---|---|---|---|---|---|---|
| Votes | % | + / - | ||||
| Social Democrats | 3,801 | 38.28 | +4.90 | |||
| Venstre | 3,735 | 37.61 | -2.95 | |||
| Conservatives | 1,003 | 10.10 | +0.67 | |||
| Social Liberals | 654 | 6.59 | -0.69 | |||
| Farmers' Party | 267 | 2.69 | -1.45 | |||
| Justice Party of Denmark | 249 | 2.51 | -0.37 | |||
| Danish Unity | 150 | 1.51 | New | |||
| National Socialist Workers' Party of Denmark | 71 | 0.72 | -0.81 | |||
| Total | 9,930 | |||||
| Source[39] | ||||||
General elections in the 1930s
1939 Danish Folketing election
| Parties | Vote | |||||
|---|---|---|---|---|---|---|
| Votes | % | + / - | ||||
| Venstre | 3,508 | 40.56 | +4.92 | |||
| Social Democrats | 2,887 | 33.38 | -2.88 | |||
| Conservatives | 816 | 9.43 | -1.59 | |||
| Social Liberals | 630 | 7.28 | -0.44 | |||
| Farmers' Party | 358 | 4.14 | +0.67 | |||
| Justice Party of Denmark | 249 | 2.88 | -2.37 | |||
| National Socialist Workers' Party of Denmark | 132 | 1.53 | +0.88 | |||
| Communist Party of Denmark | 69 | 0.80 | New | |||
| Total | 8,649 | |||||
| Source[40] | ||||||
1935 Danish Folketing election
| Parties | Vote | |||||
|---|---|---|---|---|---|---|
| Votes | % | + / - | ||||
| Social Democrats | 3,076 | 36.26 | +4.46 | |||
| Venstre | 3,023 | 35.64 | -6.78 | |||
| Conservatives | 935 | 11.02 | -1.52 | |||
| Social Liberals | 655 | 7.72 | -0.38 | |||
| Justice Party of Denmark | 445 | 5.25 | +0.87 | |||
| Independent People's Party | 294 | 3.47 | New | |||
| National Socialist Workers' Party of Denmark | 55 | 0.65 | New | |||
| Total | 8,483 | |||||
| Source[41] | ||||||
1932 Danish Folketing election
| Parties | Vote | |||||
|---|---|---|---|---|---|---|
| Votes | % | + / - | ||||
| Venstre | 3,512 | 42.42 | -1.13 | |||
| Social Democrats | 2,633 | 31.80 | -2.11 | |||
| Conservatives | 1,038 | 12.54 | +2.48 | |||
| Social Liberals | 671 | 8.10 | -1.50 | |||
| Justice Party of Denmark | 363 | 4.38 | +1.50 | |||
| Communist Party of Denmark | 62 | 0.75 | New | |||
| Total | 8,279 | |||||
| Source[42] | ||||||
General elections in the 1920s
1929 Danish Folketing election
| Parties | Vote | |||||
|---|---|---|---|---|---|---|
| Votes | % | + / - | ||||
| Venstre | 3,446 | 43.55 | -3.44 | |||
| Social Democrats | 2,683 | 33.91 | +4.31 | |||
| Conservatives | 796 | 10.06 | -1.31 | |||
| Social Liberals | 760 | 9.60 | +1.05 | |||
| Justice Party of Denmark | 228 | 2.88 | -0.47 | |||
| Total | 7,913 | |||||
| Source[43] | ||||||
1926 Danish Folketing election
| Parties | Vote | |||||
|---|---|---|---|---|---|---|
| Votes | % | + / - | ||||
| Venstre | 3,418 | 46.99 | -2.43 | |||
| Social Democrats | 2,153 | 29.60 | +2.60 | |||
| Conservatives | 827 | 11.37 | +0.03 | |||
| Social Liberals | 622 | 8.55 | -3.63 | |||
| Justice Party of Denmark | 244 | 3.35 | New | |||
| Communist Party of Denmark | 10 | 0.14 | +0.08 | |||
| Total | 7,274 | |||||
| Source[44] | ||||||
1924 Danish Folketing election
| Parties | Vote | |||||
|---|---|---|---|---|---|---|
| Votes | % | + / - | ||||
| Venstre | 3,542 | 49.42 | -2.40 | |||
| Social Democrats | 1,935 | 27.00 | +4.01 | |||
| Social Liberals | 873 | 12.18 | -0.29 | |||
| Conservatives | 813 | 11.34 | -0.63 | |||
| Communist Party of Denmark | 4 | 0.06 | New | |||
| Total | 7,167 | |||||
| Source[45] | ||||||
September 1920 Danish Folketing election
| Parties | Vote | |||||
|---|---|---|---|---|---|---|
| Votes | % | + / - | ||||
| Venstre | 3,661 | 51.82 | -1.71 | |||
| Social Democrats | 1,624 | 22.99 | +3.75 | |||
| Social Liberals | 881 | 12.47 | +0.50 | |||
| Conservatives | 846 | 11.97 | -2.34 | |||
| Industry Party | 53 | 0.75 | -0.19 | |||
| Total | 7,065 | |||||
| Source[46] | ||||||
July 1920 Danish Folketing election
| Parties | Vote | |||||
|---|---|---|---|---|---|---|
| Votes | % | + / - | ||||
| Venstre | 3,060 | 53.53 | +0.26 | |||
| Social Democrats | 1,100 | 19.24 | +2.40 | |||
| Conservatives | 818 | 14.31 | +0.77 | |||
| Social Liberals | 684 | 11.97 | -2.98 | |||
| Industry Party | 54 | 0.94 | -0.45 | |||
| Total | 5,716 | |||||
| Source[47] | ||||||
April 1920 Danish Folketing election
| Parties | Vote | |||||
|---|---|---|---|---|---|---|
| Votes | % | |||||
| Venstre | 3,327 | 53.27 | ||||
| Social Democrats | 1,052 | 16.84 | ||||
| Social Liberals | 934 | 14.95 | ||||
| Conservatives | 846 | 13.54 | ||||
| Industry Party | 87 | 1.39 | ||||
| Total | 6,246 | |||||
| Source[48] | ||||||
European Parliament elections results
2019 European Parliament election in Denmark
| Parties | Vote | |||||
|---|---|---|---|---|---|---|
| Votes | % | + / - | ||||
| Social Democrats | 3,605 | 35.79 | +2.55 | |||
| Venstre | 2,030 | 20.15 | +4.27 | |||
| Danish People's Party | 1,421 | 14.11 | -9.79 | |||
| Green Left | 724 | 7.19 | +0.19 | |||
| Red–Green Alliance | 599 | 5.95 | New | |||
| Social Liberals | 453 | 4.50 | +1.88 | |||
| People's Movement against the EU | 436 | 4.33 | -6.25 | |||
| The Alternative | 358 | 3.55 | New | |||
| Conservatives | 319 | 3.17 | -2.37 | |||
| Liberal Alliance | 128 | 1.27 | +0.03 | |||
| Total | 10,073 | |||||
| Source[49] | ||||||
2014 European Parliament election in Denmark
| Parties | Vote | |||||
|---|---|---|---|---|---|---|
| Votes | % | + / - | ||||
| Social Democrats | 2,779 | 33.24 | +10.76 | |||
| Danish People's Party | 1,998 | 23.90 | +9.83 | |||
| Venstre | 1,328 | 15.88 | -7.99 | |||
| People's Movement against the EU | 885 | 10.58 | +1.90 | |||
| Green Left | 585 | 7.00 | -7.48 | |||
| Conservatives | 463 | 5.54 | -4.17 | |||
| Social Liberals | 219 | 2.62 | -0.21 | |||
| Liberal Alliance | 104 | 1.24 | +0.94 | |||
| Total | 8,361 | |||||
| Source[50] | ||||||
2009 European Parliament election in Denmark
| Parties | Vote | |||||
|---|---|---|---|---|---|---|
| Votes | % | + / - | ||||
| Venstre | 2,158 | 23.87 | -0.30 | |||
| Social Democrats | 2,032 | 22.48 | -12.74 | |||
| Green Left | 1,309 | 14.48 | +9.78 | |||
| Danish People's Party | 1,272 | 14.07 | +7.69 | |||
| Conservatives | 878 | 9.71 | +4.47 | |||
| People's Movement against the EU | 785 | 8.68 | +3.02 | |||
| June Movement | 323 | 3.57 | -6.11 | |||
| Social Liberals | 256 | 2.83 | -1.05 | |||
| Liberal Alliance | 27 | 0.30 | New | |||
| Total | 9,040 | |||||
| Source[51] | ||||||
2004 European Parliament election in Denmark
| Parties | Vote | |||||
|---|---|---|---|---|---|---|
| Votes | % | + / - | ||||
| Social Democrats | 2,992 | 35.22 | +14.28 | |||
| Venstre | 2,053 | 24.17 | -6.66 | |||
| June Movement | 822 | 9.68 | -6.49 | |||
| Danish People's Party | 542 | 6.38 | +1.62 | |||
| People's Movement against the EU | 481 | 5.66 | -0.53 | |||
| Conservatives | 445 | 5.24 | +0.94 | |||
| Christian Democrats | 431 | 5.07 | -0.26 | |||
| Green Left | 399 | 4.70 | -0.08 | |||
| Social Liberals | 330 | 3.88 | -0.63 | |||
| Total | 8,495 | |||||
| Source[52] | ||||||
1999 European Parliament election in Denmark
| Parties | Vote | |||||
|---|---|---|---|---|---|---|
| Votes | % | + / - | ||||
| Venstre | 2,637 | 30.83 | +0.31 | |||
| Social Democrats | 1,791 | 20.94 | +4.87 | |||
| June Movement | 1,383 | 16.17 | +0.64 | |||
| People's Movement against the EU | 529 | 6.19 | -2.96 | |||
| Christian Democrats | 456 | 5.33 | +0.60 | |||
| Green Left | 409 | 4.78 | +0.26 | |||
| Danish People's Party | 407 | 4.76 | New | |||
| Social Liberals | 386 | 4.51 | -1.07 | |||
| Conservatives | 368 | 4.30 | -5.38 | |||
| Centre Democrats | 186 | 2.17 | +1.57 | |||
| Progress Party | 53 | 0.62 | -2.99 | |||
| Total | 8,552 | |||||
| Source[53] | ||||||
1994 European Parliament election in Denmark
| Parties | Vote | |||||
|---|---|---|---|---|---|---|
| Votes | % | + / - | ||||
| Venstre | 2,909 | 30.52 | -9.01 | |||
| Social Democrats | 1,532 | 16.07 | -2.70 | |||
| June Movement | 1,480 | 15.53 | New | |||
| Conservatives | 923 | 9.68 | +4.60 | |||
| People's Movement against the EU | 872 | 9.15 | -8.68 | |||
| Social Liberals | 532 | 5.58 | +4.21 | |||
| Christian Democrats | 451 | 4.73 | -0.53 | |||
| Green Left | 431 | 4.52 | -0.26 | |||
| Progress Party | 344 | 3.61 | -1.29 | |||
| Centre Democrats | 57 | 0.60 | -1.87 | |||
| Total | 9,531 | |||||
| Source[54] | ||||||
1989 European Parliament election in Denmark
| Parties | Vote | |||||
|---|---|---|---|---|---|---|
| Votes | % | + / - | ||||
| Venstre | 3,828 | 39.53 | +17.53 | |||
| Social Democrats | 1,818 | 18.77 | +0.63 | |||
| People's Movement against the EU | 1,727 | 17.83 | -0.78 | |||
| Christian Democrats | 509 | 5.26 | -2.10 | |||
| Conservatives | 492 | 5.08 | -9.26 | |||
| Progress Party | 475 | 4.90 | -1.49 | |||
| Green Left | 463 | 4.78 | +0.33 | |||
| Centre Democrats | 239 | 2.47 | -3.07 | |||
| Social Liberals | 133 | 1.37 | -1.27 | |||
| Total | 9,684 | |||||
| Source[55] | ||||||
1984 European Parliament election in Denmark
| Parties | Vote | |||||
|---|---|---|---|---|---|---|
| Votes | % | |||||
| Venstre | 2,087 | 22.00 | ||||
| People's Movement against the EU | 1,766 | 18.61 | ||||
| Social Democrats | 1,721 | 18.14 | ||||
| Conservatives | 1,360 | 14.34 | ||||
| Christian Democrats | 698 | 7.36 | ||||
| Progress Party | 606 | 6.39 | ||||
| Centre Democrats | 526 | 5.54 | ||||
| Green Left | 422 | 4.45 | ||||
| Social Liberals | 250 | 2.64 | ||||
| Left Socialists | 51 | 0.54 | ||||
| Total | 9,487 | |||||
| Source[56] | ||||||
Referendums
2022 Danish European Union opt-out referendum[57]
| Option | Votes | % |
|---|---|---|
| ✓ YES | 6,437 | 62.56 |
| X NO | 3,853 | 37.44 |
2015 Danish European Union opt-out referendum[58]
| Option | Votes | % |
|---|---|---|
| X NO | 6,150 | 55.15 |
| ✓ YES | 5,002 | 44.85 |
2014 Danish Unified Patent Court membership referendum[59]
| Option | Votes | % |
|---|---|---|
| ✓ YES | 5,007 | 61.81 |
| X NO | 3,093 | 38.19 |
2009 Danish Act of Succession referendum[60]
| Option | Votes | % |
|---|---|---|
| ✓ YES | 7,033 | 82.93 |
| X NO | 1,448 | 17.07 |
2000 Danish euro referendum[61]
| Option | Votes | % |
|---|---|---|
| X NO | 8,848 | 60.01 |
| ✓ YES | 5,895 | 39.99 |
1998 Danish Amsterdam Treaty referendum[62]
| Option | Votes | % |
|---|---|---|
| ✓ YES | 6,707 | 52.65 |
| X NO | 6,032 | 47.35 |
1993 Danish Maastricht Treaty referendum[63]
| Option | Votes | % |
|---|---|---|
| ✓ YES | 7,590 | 51.88 |
| X NO | 7,040 | 48.12 |
1992 Danish Maastricht Treaty referendum[64]
| Option | Votes | % |
|---|---|---|
| X NO | 7,170 | 50.87 |
| ✓ YES | 6,925 | 49.13 |
1986 Danish Single European Act referendum[65]
| Option | Votes | % |
|---|---|---|
| ✓ YES | 8,145 | 61.95 |
| X NO | 5,003 | 38.05 |
1972 Danish European Communities membership referendum[66]
| Option | Votes | % |
|---|---|---|
| ✓ YES | 9,250 | 64.78 |
| X NO | 5,030 | 35.22 |
1953 Danish constitutional and electoral age referendum[67]
| Option | Votes | % |
|---|---|---|
| ✓ YES | 6,362 | 91.65 |
| X NO | 580 | 8.35 |
| 23 years | 4,173 | 58.92 |
| 21 years | 2,910 | 41.08 |
1939 Danish constitutional referendum[68]
| Option | Votes | % |
|---|---|---|
| ✓ YES | 3,347 | 92.36 |
| X NO | 277 | 7.64 |
References
- "Rønnekredsen". kmdvalg.dk (in Danish). Retrieved 2023-06-08.
- "Beretning om Forhandlingerne paa Rigsdagen". Rigsdagstidende. II: Spalte 3892 ff.
- "Nye valgkredse fordeler stemmerne anderledes". dr.dk (in Danish). Retrieved 2023-06-08.
- "Beretning om nye valgkredse som følge af kommunalreformen" (in Danish). Retrieved 2023-06-08.
- "Det danske valgsystem: Valg til Folketinget". valg.im (in Danish). Retrieved 2023-06-08.
- "28 Aakirkeby". dataforsyningen.dk (in Danish). Retrieved 2023-06-08.
- "Beretning om Forhandlingerne paa Rigsdagen". Rigsdagstidende. II: Spalte 3892 ff.
- "Forslagn til Lov om ændring af lov om valg til Folketinget" (PDF). Folketingstidende. 4 June 1970.
- "Valgresultater fra tidligere valg:". kmdvalg (in Danish). Retrieved 2023-06-08.
- "FOLKETINGSVALG TIRSDAG 1. NOVEMBER 2022". valg.im (in Danish). Retrieved 2023-06-27.
- "FOLKETINGSVALG ONSDAG 5. JUNI 2019". valg.im (in Danish). Retrieved 2023-06-27.
- "FOLKETINGSVALG TORSDAG 18. JUNI 2015". valg.im (in Danish). Retrieved 2023-06-27.
- "FOLKETINGSVALG TORSDAG 15. SEPTEMBER 2011". valg.im (in Danish). Retrieved 2023-06-27.
- "Folketingsvalget den 13. november 2007". valg.im (in Danish). Retrieved 2023-06-27.
- "valg2005.book" (PDF). valg.im (in Danish). Retrieved 2023-06-27.
- "BMTABEL" (PDF). valg.im (in Danish). Retrieved 2023-06-27.
- "VALG98" (PDF). valg.im (in Danish). Retrieved 2023-06-27.
- "VALG94" (PDF). valg.im (in Danish). Retrieved 2023-06-27.
- "VALG90" (PDF). valg.im (in Danish). Retrieved 2023-06-27.
- "Folketingsvalget den 10. maj 1988". valg.im (in Danish). Retrieved 2023-06-27.
- "Folketingsvalget den 8.september 1987". dst.dk (in Danish). Retrieved 2023-06-27.
- "Folketingsvalget den 10. januar 1984". dst.dk (in Danish). Retrieved 2023-06-27.
- "Folketingsvalget den 8. december 1981". dst.dk (in Danish). Retrieved 2023-06-27.
- "Folketingsvalget den 23. oktober 1979". dst.dk (in Danish). Retrieved 2023-06-27.
- "Folketingsvalget den 15. februar 1977". dst.dk (in Danish). Retrieved 2023-06-27.
- "Folketingsvalget den 9. januar 1975". dst.dk (in Danish). Retrieved 2023-06-27.
- "Folketingsvalget den 4. december 1973". dst.dk (in Danish). Retrieved 2023-06-27.
- "Folketingsvalget den 21. september 1971 samt folkeafstemningen". dst.dk (in Danish). Retrieved 2023-06-27.
- "Folketingsvalget den 23. januar 1968". dst.dk (in Danish). Retrieved 2023-06-27.
- "Folketingsvalget den 22. november 1966". dst.dk (in Danish). Retrieved 2023-06-27.
- "Folketingsvalget den 22. september 1964". dst.dk (in Danish). Retrieved 2023-06-27.
- "Folketingsvalget den 15. november 1960". dst.dk (in Danish). Retrieved 2023-06-27.
- "Folketingsvalget den 14. maj 1957". dst.dk (in Danish). Retrieved 2023-06-27.
- "Folketingsvalget den 22. september 1953". dst.dk (in Danish). Retrieved 2023-06-27.
- "Rigsdagsvalgene og folkeafstemningerne i april og maj 1953". dst.dk (in Danish). Retrieved 2023-06-27.
- "Folketingsvalget den 5. september 1950". dst.dk (in Danish). Retrieved 2023-06-27.
- "Folketingsvalget den 28. oktober 1947". dst.dk (in Danish). Retrieved 2023-06-27.
- "Rigsdagsvalgene i oktober og november 1945". dst.dk (in Danish). Retrieved 2023-06-27.
- "Rigsdagsvalgene i marts og april 1943". dst.dk (in Danish). Retrieved 2023-06-27.
- "Rigsdagsvalgene og Folkeafstemningen i april og maj 1939". dst.dk (in Danish). Retrieved 2023-06-27.
- "Folketingsvalget den 22. oktober 1935". dst.dk (in Danish). Retrieved 2023-06-27.
- "Folketingsvalget den 16. november 1932". dst.dk (in Danish). Retrieved 2023-06-27.
- "Folketingsvalget den 24. april 1929". dst.dk (in Danish). Retrieved 2023-06-27.
- "Folketingsvalget den 2. december 1926". dst.dk (in Danish). Retrieved 2023-06-27.
- "Folketingsvalget den 11. april 1924". dst.dk (in Danish). Retrieved 2023-06-27.
- "Rigsdagsvalgene september-oktober 1920". dst.dk (in Danish). Retrieved 2023-06-27.
- "Rigsdagsvalgene juli-august 1920". dst.dk (in Danish). Retrieved 2023-06-27.
- "Folketingsvalget den 26. april 1920". dst.dk (in Danish). Retrieved 2023-06-27.
- "EUROPA-PARLAMENTSVALG SØNDAG 26. MAJ 2019". dst.dk (in Danish). Retrieved 2023-07-01.
- "EUROPA-PARLAMENTSVALG SØNDAG 25. MAJ 2014". dst.dk (in Danish). Retrieved 2023-07-01.
- "EUROPA-PARLAMENTSVALG SØNDAG 7. JUNI 2009". dst.dk (in Danish). Retrieved 2023-07-01.
- "EUROPA-PARLAMENTSVALGET DEN 13. JUNI 2004" (PDF). im.dk (in Danish). Retrieved 2023-07-01.
- "VALGET TIL EUROPA-PARLAMENTET DEN 10. JUNI 1999" (PDF). im.dk (in Danish). Retrieved 2023-07-01.
- "VALGET TIL EUROPA-PARLAMENTET DEN 9. JUNI 1994" (PDF). im.dk (in Danish). Retrieved 2023-07-01.
- "Valget til Europa-parlamentet den 15. juni 1989". dst.dk (in Danish). Retrieved 2023-07-01.
- "Valget til Europa-Parlamentet den 14. juni 1984". dst.dk (in Danish). Retrieved 2023-07-01.
- "FOLKEAFSTEMNING ONSDAG 1. JUNI 2022". dst.dk (in Danish). Retrieved 2023-07-05.
- "FOLKEAFSTEMNING TORSDAG 3. DECEMBER 2015". dst.dk (in Danish). Retrieved 2023-07-05.
- "FOLKEAFSTEMNING SØNDAG 25. MAJ 2014". dst.dk (in Danish). Retrieved 2023-07-05.
- "FOLKEAFSTEMNING SØNDAG 7. JUNI 2009". dst.dk (in Danish). Retrieved 2023-07-05.
- "FOLKEAFSTEMNINGEN DEN 28. SEPTEMBER 2000 OM DANMARKS DELTAGELSE I DEN FÆLLES VALUTA" (PDF). valg.im (in Danish). Retrieved 2023-07-05.
- "FOLKEAFSTEMNINGEN DEN 28. MAJ 1998OM DANMARKS TILTRÆDELSE AF AMSTERDAMTRAKTATEN" (PDF). valg.im (in Danish). Retrieved 2023-07-05.
- "FOLKEAFSTEMNINGEN DEN 18. MAJ 1993 OM DANMARKS TILTRÆDELSE AF EDINBURGH-AFGØRELSEN OG MAASTRICHT-TRAKTATEN". dst.dk (in Danish). Retrieved 2023-07-05.
- "Folkeafstemningen den 1. juni 1992 om Danmarks tiltrædelse af traktaten om Den Europæiske Union". dst.dk (in Danish). Retrieved 2023-07-05.
- "Vejledende folkeafstemning torsdag den 27. februar 1986 om Danmarks tiltrædelse af EF- pakken". dst.dk (in Danish). Retrieved 2023-07-05.
- "Folkeafstemningen om Danmarks tiltrædelse af De europæiske Fælleskaber 2. oktober 1972". dst.dk (in Danish). Retrieved 2023-07-05.
- "Publikationsfortegnelse vedrørende Folkeafstemninger". dst.dk (in Danish). Retrieved 2023-07-05.
- "Publikationsfortegnelse vedrørende Folkeafstemninger". dst.dk (in Danish). Retrieved 2023-07-05.