Aalborg North (nomination district)
Aalborg North nominating district is one of the 92 nominating districts that was created for Danish elections following the 2007 municipal reform.[3][4][5] It is one of the nomination districts from Aalborg Municipality, the others being Aalborg East and Aalborg West.[6] It was created in 1849[7] as a constituency, and has been a nomination district since 1920, though its boundaries have been changed since then. Prior to 1970, it was known as Nørresundby.
| Aalborg North | |
|---|---|
| Aalborg Nord | |
| Nomination district constituency for the Folketing | |
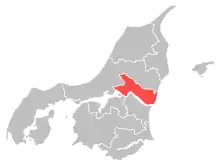 Location of Aalborg North within North Jutland | |
 Location of North Jutland within Denmark | |
| Municipalities | Aalborg |
| Constituency | North Jutland |
| Electorate | 52,978 (2022)[1] |
| Current constituency | |
| Created | 1849 (as constituency)[2] 1920 (as nomination district) |
In all general elections except 2015, the parties associated with the red bloc has won the most votes, while the Social Democrats has always been party to win the most votes.[8]
General elections results
General elections in the 2020s
| Parties | Vote | |||||
|---|---|---|---|---|---|---|
| Votes | % | + / - | ||||
| Social Democrats | 14,523 | 33.82 | -0.07 | |||
| Venstre | 5,732 | 13.35 | -10.35 | |||
| Denmark Democrats | 4,390 | 10.22 | New | |||
| Liberal Alliance | 3,928 | 9.15 | +6.33 | |||
| Moderates | 2,924 | 6.81 | New | |||
| Green Left | 2,776 | 6.46 | +0.24 | |||
| Red–Green Alliance | 1,935 | 4.51 | -1.40 | |||
| Conservatives | 1,628 | 3.79 | -0.35 | |||
| Social Liberals | 1,593 | 3.71 | -2.88 | |||
| New Right | 1,197 | 2.79 | +0.91 | |||
| The Alternative | 1,112 | 2.59 | -0.26 | |||
| Danish People's Party | 817 | 1.90 | -6.18 | |||
| Independent Greens | 203 | 0.47 | New | |||
| Christian Democrats | 136 | 0.32 | -0.85 | |||
| Jette Møller | 50 | 0.12 | New | |||
| Total | 42,944 | |||||
| Source[9] | ||||||
General elections in the 2010s
| Parties | Vote | |||||
|---|---|---|---|---|---|---|
| Votes | % | + / - | ||||
| Social Democrats | 14,226 | 33.89 | +2.87 | |||
| Venstre | 9,948 | 23.70 | +2.94 | |||
| Danish People's Party | 3,391 | 8.08 | -10.84 | |||
| Social Liberals | 2,766 | 6.59 | +2.59 | |||
| Green Left | 2,610 | 6.22 | +2.57 | |||
| Red–Green Alliance | 2,479 | 5.91 | -1.78 | |||
| Conservatives | 1,739 | 4.14 | +2.02 | |||
| The Alternative | 1,198 | 2.85 | -0.70 | |||
| Liberal Alliance | 1,185 | 2.82 | -4.61 | |||
| New Right | 790 | 1.88 | New | |||
| Stram Kurs | 770 | 1.83 | New | |||
| Christian Democrats | 492 | 1.17 | +0.33 | |||
| Klaus Riskær Pedersen Party | 384 | 0.91 | New | |||
| Total | 41,978 | |||||
| Source[10] | ||||||
| Parties | Vote | |||||
|---|---|---|---|---|---|---|
| Votes | % | + / - | ||||
| Social Democrats | 12,630 | 31.02 | -0.80 | |||
| Venstre | 8,454 | 20.76 | -2.74 | |||
| Danish People's Party | 7,705 | 18.92 | +7.71 | |||
| Red–Green Alliance | 3,131 | 7.69 | +1.78 | |||
| Liberal Alliance | 3,027 | 7.43 | +2.90 | |||
| Social Liberals | 1,628 | 4.00 | -4.15 | |||
| Green Left | 1,485 | 3.65 | -5.40 | |||
| The Alternative | 1,445 | 3.55 | New | |||
| Conservatives | 862 | 2.12 | -3.02 | |||
| Christian Democrats | 341 | 0.84 | +0.20 | |||
| Hans Schultz | 10 | 0.02 | -0.03 | |||
| Total | 40,718 | |||||
| Source[11] | ||||||
| Parties | Vote | |||||
|---|---|---|---|---|---|---|
| Votes | % | + / - | ||||
| Social Democrats | 12,955 | 31.82 | -1.19 | |||
| Venstre | 9,569 | 23.50 | +2.89 | |||
| Danish People's Party | 4,566 | 11.21 | -1.76 | |||
| Green Left | 3,684 | 9.05 | -2.65 | |||
| Social Liberals | 3,318 | 8.15 | +3.68 | |||
| Red–Green Alliance | 2,405 | 5.91 | +4.25 | |||
| Conservatives | 2,092 | 5.14 | -7.55 | |||
| Liberal Alliance | 1,846 | 4.53 | +2.50 | |||
| Christian Democrats | 261 | 0.64 | -0.19 | |||
| Hans Schultz | 22 | 0.05 | +0.04 | |||
| Total | 40,718 | |||||
| Source[12] | ||||||
General elections in the 2000s
| Parties | Vote | |||||
|---|---|---|---|---|---|---|
| Votes | % | + / - | ||||
| Social Democrats | 13,032 | 33.01 | -1.85 | |||
| Venstre | 8,135 | 20.61 | -5.16 | |||
| Danish People's Party | 5,118 | 12.97 | +0.46 | |||
| Conservatives | 5,011 | 12.69 | +2.56 | |||
| Green Left | 4,617 | 11.70 | +7.41 | |||
| Social Liberals | 1,763 | 4.47 | -2.63 | |||
| New Alliance | 800 | 2.03 | New | |||
| Red–Green Alliance | 655 | 1.66 | -0.66 | |||
| Christian Democrats | 328 | 0.83 | -1.13 | |||
| Anders Gravers Pedersen | 12 | 0.03 | New | |||
| Hans Schultz | 4 | 0.01 | New | |||
| Total | 39,475 | |||||
| Source[13] | ||||||
| Parties | Vote | |||||
|---|---|---|---|---|---|---|
| Votes | % | + / - | ||||
| Social Democrats | 13,384 | 34.86 | -0.58 | |||
| Venstre | 9,895 | 25.77 | -3.29 | |||
| Danish People's Party | 4,804 | 12.51 | +0.72 | |||
| Conservatives | 3,888 | 10.13 | +1.54 | |||
| Social Liberals | 2,727 | 7.10 | +3.41 | |||
| Green Left | 1,646 | 4.29 | -0.38 | |||
| Red–Green Alliance | 892 | 2.32 | +0.33 | |||
| Christian Democrats | 754 | 1.96 | -0.66 | |||
| Centre Democrats | 319 | 0.83 | -0.72 | |||
| Minority Party | 78 | 0.20 | New | |||
| Christian Jensen | 5 | 0.01 | New | |||
| Aase Heskjær | 3 | 0.01 | New | |||
| Ivan Johansen | 3 | 0.01 | New | |||
| Total | 38,398 | |||||
| Source[14] | ||||||
| Parties | Vote | |||||
|---|---|---|---|---|---|---|
| Votes | % | + / - | ||||
| Social Democrats | 13,910 | 35.44 | -7.88 | |||
| Venstre | 11,407 | 29.06 | +9.96 | |||
| Danish People's Party | 4,627 | 11.79 | +7.88 | |||
| Conservatives | 3,372 | 8.59 | +2.15 | |||
| Green Left | 1,832 | 4.67 | -0.68 | |||
| Social Liberals | 1,449 | 3.69 | +1.19 | |||
| Christian People's Party | 1,029 | 2.62 | +0.42 | |||
| Red–Green Alliance | 780 | 1.99 | +0.31 | |||
| Centre Democrats | 609 | 1.55 | -1.79 | |||
| Progress Party | 232 | 0.59 | -11.23 | |||
| Total | 39,247 | |||||
| Source[15] | ||||||
General elections in the 1990s
| Parties | Vote | |||||
|---|---|---|---|---|---|---|
| Votes | % | + / - | ||||
| Social Democrats | 16,945 | 43.32 | +1.01 | |||
| Venstre | 7,472 | 19.10 | -1.73 | |||
| Progress Party | 4,622 | 11.82 | +2.60 | |||
| Conservatives | 2,520 | 6.44 | -5.23 | |||
| Green Left | 2,091 | 5.35 | -0.37 | |||
| Danish People's Party | 1,530 | 3.91 | New | |||
| Centre Democrats | 1,308 | 3.34 | +0.72 | |||
| Social Liberals | 978 | 2.50 | -1.12 | |||
| Christian People's Party | 862 | 2.20 | +0.25 | |||
| Red–Green Alliance | 657 | 1.68 | -0.32 | |||
| Democratic Renewal | 123 | 0.31 | New | |||
| Henrik Westergaard | 6 | 0.02 | New | |||
| Total | 39,114 | |||||
| Source[16] | ||||||
| Parties | Vote | |||||
|---|---|---|---|---|---|---|
| Votes | % | + / - | ||||
| Social Democrats | 15,868 | 42.31 | -4.52 | |||
| Venstre | 7,812 | 20.83 | +7.14 | |||
| Conservatives | 4,378 | 11.67 | -0.40 | |||
| Progress Party | 3,460 | 9.22 | +1.12 | |||
| Green Left | 2,146 | 5.72 | -0.17 | |||
| Social Liberals | 1,357 | 3.62 | +1.05 | |||
| Centre Democrats | 983 | 2.62 | -2.15 | |||
| Red–Green Alliance | 751 | 2.00 | +1.22 | |||
| Christian People's Party | 732 | 1.95 | -0.37 | |||
| Steen W. Jakobsen | 7 | 0.02 | New | |||
| Svend Jensen | 7 | 0.02 | New | |||
| Henning Sørensen | 7 | 0.02 | New | |||
| Total | 37,508 | |||||
| Source[17] | ||||||
| Parties | Vote | |||||
|---|---|---|---|---|---|---|
| Votes | % | + / - | ||||
| Social Democrats | 17,323 | 46.83 | +7.87 | |||
| Venstre | 5,065 | 13.69 | +1.68 | |||
| Conservatives | 4,466 | 12.07 | -3.88 | |||
| Progress Party | 2,996 | 8.10 | -0.87 | |||
| Green Left | 2,177 | 5.89 | -3.97 | |||
| Centre Democrats | 1,764 | 4.77 | +0.20 | |||
| Social Liberals | 949 | 2.57 | -1.79 | |||
| Christian People's Party | 857 | 2.32 | -0.02 | |||
| Common Course | 592 | 1.60 | +0.51 | |||
| Red–Green Alliance | 289 | 0.78 | New | |||
| The Greens | 243 | 0.66 | -0.25 | |||
| Justice Party of Denmark | 131 | 0.35 | New | |||
| P. H. Bering | 131 | 0.35 | New | |||
| Humanist Party | 9 | 0.02 | New | |||
| Total | 36,992 | |||||
| Source[18] | ||||||
General elections in the 1980s
| Parties | Vote | |||||
|---|---|---|---|---|---|---|
| Votes | % | + / - | ||||
| Social Democrats | 14,668 | 38.96 | +0.23 | |||
| Conservatives | 6,003 | 15.95 | -1.35 | |||
| Venstre | 4,520 | 12.01 | +0.59 | |||
| Green Left | 3,712 | 9.86 | -1.36 | |||
| Progress Party | 3,377 | 8.97 | +3.76 | |||
| Centre Democrats | 1,721 | 4.57 | +0.34 | |||
| Social Liberals | 1,641 | 4.36 | -0.11 | |||
| Christian People's Party | 880 | 2.34 | -0.18 | |||
| Common Course | 409 | 1.09 | -1.09 | |||
| The Greens | 342 | 0.91 | +0.10 | |||
| Communist Party of Denmark | 253 | 0.67 | -0.01 | |||
| Left Socialists | 120 | 0.32 | -0.30 | |||
| Total | 37,646 | |||||
| Source[19] | ||||||
| Parties | Vote | |||||
|---|---|---|---|---|---|---|
| Votes | % | + / - | ||||
| Social Democrats | 14,838 | 38.73 | -0.87 | |||
| Conservatives | 6,630 | 17.30 | -3.16 | |||
| Venstre | 4,375 | 11.42 | -1.64 | |||
| Green Left | 4,299 | 11.22 | +1.98 | |||
| Progress Party | 1,998 | 5.21 | +0.82 | |||
| Social Liberals | 1,712 | 4.47 | +4.02 | |||
| Centre Democrats | 1,621 | 4.23 | -1.43 | |||
| Christian People's Party | 967 | 2.52 | -0.92 | |||
| Common Course | 835 | 2.18 | New | |||
| The Greens | 311 | 0.81 | New | |||
| Communist Party of Denmark | 261 | 0.68 | +0.09 | |||
| Left Socialists | 237 | 0.62 | -0.90 | |||
| Justice Party of Denmark | 166 | 0.43 | -1.05 | |||
| Humanist Party | 42 | 0.11 | New | |||
| Socialist Workers Party | 14 | 0.04 | -0.05 | |||
| Jytte Østerbye | 5 | 0.01 | New | |||
| Marxist–Leninists Party | 3 | 0.01 | -0.01 | |||
| Total | 38,314 | |||||
| Source[20] | ||||||
| Parties | Vote | |||||
|---|---|---|---|---|---|---|
| Votes | % | + / - | ||||
| Social Democrats | 14,711 | 39.60 | +1.53 | |||
| Conservatives | 7,600 | 20.46 | +10.04 | |||
| Venstre | 4,851 | 13.06 | +0.22 | |||
| Green Left | 3,433 | 9.24 | +0.53 | |||
| Centre Democrats | 2,104 | 5.66 | -4.19 | |||
| Progress Party | 1,632 | 4.39 | -5.53 | |||
| Christian People's Party | 1,279 | 3.44 | +0.49 | |||
| Left Socialists | 564 | 1.52 | +0.27 | |||
| Justice Party of Denmark | 548 | 1.48 | +0.25 | |||
| Communist Party of Denmark | 220 | 0.59 | -0.49 | |||
| Social Liberals | 167 | 0.45 | -3.09 | |||
| Socialist Workers Party | 35 | 0.09 | +0.03 | |||
| Marxist–Leninists Party | 8 | 0.02 | New | |||
| Total | 37,152 | |||||
| Source[21] | ||||||
| Parties | Vote | |||||
|---|---|---|---|---|---|---|
| Votes | % | + / - | ||||
| Social Democrats | 13,738 | 38.07 | -3.36 | |||
| Venstre | 4,633 | 12.84 | -1.47 | |||
| Conservatives | 3,760 | 10.42 | +1.01 | |||
| Progress Party | 3,580 | 9.92 | -2.95 | |||
| Centre Democrats | 3,556 | 9.85 | +6.04 | |||
| Green Left | 3,144 | 8.71 | +4.18 | |||
| Social Liberals | 1,278 | 3.54 | -0.32 | |||
| Christian People's Party | 1,066 | 2.95 | -0.37 | |||
| Left Socialists | 452 | 1.25 | -0.78 | |||
| Justice Party of Denmark | 443 | 1.23 | -1.07 | |||
| Communist Party of Denmark | 388 | 1.08 | -0.85 | |||
| Communist Workers Party | 30 | 0.08 | -0.11 | |||
| Socialist Workers Party | 21 | 0.06 | New | |||
| Total | 36,089 | |||||
| Source[22] | ||||||
General elections in the 1970s
| Parties | Vote | |||||
|---|---|---|---|---|---|---|
| Votes | % | + / - | ||||
| Social Democrats | 14,970 | 41.43 | +2.89 | |||
| Venstre | 5,172 | 14.31 | +1.47 | |||
| Progress Party | 4,651 | 12.87 | -2.98 | |||
| Conservatives | 3,399 | 9.41 | +2.44 | |||
| Green Left | 1,638 | 4.53 | +1.93 | |||
| Social Liberals | 1,396 | 3.86 | +0.88 | |||
| Centre Democrats | 1,378 | 3.81 | -3.08 | |||
| Christian People's Party | 1,201 | 3.32 | -1.04 | |||
| Justice Party of Denmark | 832 | 2.30 | -0.49 | |||
| Left Socialists | 733 | 2.03 | +0.70 | |||
| Communist Party of Denmark | 696 | 1.93 | -1.98 | |||
| Communist Workers Party | 68 | 0.19 | New | |||
| Total | 36,134 | |||||
| Source[23] | ||||||
| Parties | Vote | |||||
|---|---|---|---|---|---|---|
| Votes | % | + / - | ||||
| Social Democrats | 13,493 | 38.54 | +7.71 | |||
| Progress Party | 5,549 | 15.85 | +0.15 | |||
| Venstre | 4,494 | 12.84 | -11.07 | |||
| Conservatives | 2,439 | 6.97 | +2.61 | |||
| Centre Democrats | 2,413 | 6.89 | +4.44 | |||
| Christian People's Party | 1,525 | 4.36 | -1.72 | |||
| Communist Party of Denmark | 1,370 | 3.91 | -0.30 | |||
| Social Liberals | 1,045 | 2.98 | -3.19 | |||
| Justice Party of Denmark | 978 | 2.79 | +0.99 | |||
| Green Left | 909 | 2.60 | -0.68 | |||
| Left Socialists | 467 | 1.33 | +0.13 | |||
| Pensioners' Party | 329 | 0.94 | New | |||
| Total | 35,011 | |||||
| Source[24] | ||||||
| Parties | Vote | |||||
|---|---|---|---|---|---|---|
| Votes | % | + / - | ||||
| Social Democrats | 10,417 | 30.83 | +4.86 | |||
| Venstre | 8,080 | 23.91 | +11.29 | |||
| Progress Party | 5,306 | 15.70 | -2.17 | |||
| Social Liberals | 2,086 | 6.17 | -3.86 | |||
| Christian People's Party | 2,055 | 6.08 | +0.83 | |||
| Conservatives | 1,474 | 4.36 | -4.01 | |||
| Communist Party of Denmark | 1,421 | 4.21 | +0.58 | |||
| Green Left | 1,109 | 3.28 | -1.06 | |||
| Centre Democrats | 827 | 2.45 | -5.94 | |||
| Justice Party of Denmark | 608 | 1.80 | -0.86 | |||
| Left Socialists | 404 | 1.20 | +0.37 | |||
| Total | 33,787 | |||||
| Source[25] | ||||||
| Parties | Vote | |||||
|---|---|---|---|---|---|---|
| Votes | % | + / - | ||||
| Social Democrats | 8,746 | 25.97 | -13.35 | |||
| Progress Party | 6,019 | 17.87 | New | |||
| Venstre | 4,251 | 12.62 | -5.22 | |||
| Social Liberals | 3,376 | 10.03 | -2.63 | |||
| Centre Democrats | 2,826 | 8.39 | New | |||
| Conservatives | 2,819 | 8.37 | -6.97 | |||
| Christian People's Party | 1,767 | 5.25 | +2.60 | |||
| Green Left | 1,461 | 4.34 | -3.35 | |||
| Communist Party of Denmark | 1,222 | 3.63 | +1.77 | |||
| Justice Party of Denmark | 897 | 2.66 | +0.76 | |||
| Left Socialists | 281 | 0.83 | +0.07 | |||
| Alex Larsen | 10 | 0.03 | New | |||
| Total | 33,675 | |||||
| Source[26] | ||||||
| Parties | Vote | |||||
|---|---|---|---|---|---|---|
| Votes | % | + / - | ||||
| Social Democrats | 12,158 | 39.32 | +3.16 | |||
| Venstre | 5,515 | 17.84 | -5.11 | |||
| Conservatives | 4,742 | 15.34 | -2.13 | |||
| Social Liberals | 3,914 | 12.66 | -0.11 | |||
| Green Left | 2,377 | 7.69 | +1.39 | |||
| Christian People's Party | 818 | 2.65 | New | |||
| Justice Party of Denmark | 588 | 1.90 | +1.11 | |||
| Communist Party of Denmark | 576 | 1.86 | +0.50 | |||
| Left Socialists | 234 | 0.76 | -0.32 | |||
| Total | 30,922 | |||||
| Source[27] | ||||||
General elections in the 1960s
| Parties | Vote | |||||
|---|---|---|---|---|---|---|
| Votes | % | + / - | ||||
| Social Democrats | 10,527 | 36.16 | -4.64 | |||
| Venstre | 6,682 | 22.95 | +1.39 | |||
| Conservatives | 5,086 | 17.47 | +1.02 | |||
| Social Liberals | 3,718 | 12.77 | +7.17 | |||
| Green Left | 1,835 | 6.30 | -3.71 | |||
| Communist Party of Denmark | 397 | 1.36 | +0.40 | |||
| Left Socialists | 313 | 1.08 | New | |||
| Justice Party of Denmark | 230 | 0.79 | +0.06 | |||
| Liberal Centre | 164 | 0.56 | -1.22 | |||
| Independent Party | 164 | 0.56 | -1.53 | |||
| Total | 29,116 | |||||
| Source[28] | ||||||
| Parties | Vote | |||||
|---|---|---|---|---|---|---|
| Votes | % | + / - | ||||
| Social Democrats | 11,635 | 40.80 | -1.78 | |||
| Venstre | 6,149 | 21.56 | -1.04 | |||
| Conservatives | 4,690 | 16.45 | -2.39 | |||
| Green Left | 2,854 | 10.01 | +4.65 | |||
| Social Liberals | 1,598 | 5.60 | +2.45 | |||
| Independent Party | 597 | 2.09 | -1.09 | |||
| Liberal Centre | 507 | 1.78 | New | |||
| Communist Party of Denmark | 275 | 0.96 | -1.04 | |||
| Justice Party of Denmark | 209 | 0.73 | -0.88 | |||
| Total | 28,514 | |||||
| Source[29] | ||||||
| Parties | Vote | |||||
|---|---|---|---|---|---|---|
| Votes | % | + / - | ||||
| Social Democrats | 11,167 | 42.58 | +0.52 | |||
| Venstre | 5,927 | 22.60 | -1.73 | |||
| Conservatives | 4,942 | 18.84 | +3.82 | |||
| Green Left | 1,406 | 5.36 | -1.17 | |||
| Independent Party | 834 | 3.18 | -0.67 | |||
| Social Liberals | 827 | 3.15 | -0.40 | |||
| Communist Party of Denmark | 524 | 2.00 | +0.06 | |||
| Justice Party of Denmark | 421 | 1.61 | -1.12 | |||
| Peace Politics People's Party | 92 | 0.35 | New | |||
| Danish Unity | 85 | 0.32 | New | |||
| Total | 26,225 | |||||
| Source[30] | ||||||
| Parties | Vote | |||||
|---|---|---|---|---|---|---|
| Votes | % | + / - | ||||
| Social Democrats | 9,708 | 42.06 | +4.33 | |||
| Venstre | 5,615 | 24.33 | -3.92 | |||
| Conservatives | 3,467 | 15.02 | +1.48 | |||
| Green Left | 1,508 | 6.53 | New | |||
| Independent Party | 888 | 3.85 | +0.59 | |||
| Social Liberals | 819 | 3.55 | -0.55 | |||
| Justice Party of Denmark | 629 | 2.73 | -5.26 | |||
| Communist Party of Denmark | 448 | 1.94 | -3.19 | |||
| Total | 23,082 | |||||
| Source[31] | ||||||
General elections in the 1950s
| Parties | Vote | |||||
|---|---|---|---|---|---|---|
| Votes | % | + / - | ||||
| Social Democrats | 8,090 | 37.73 | -2.64 | |||
| Venstre | 6,057 | 28.25 | -0.06 | |||
| Conservatives | 2,902 | 13.54 | +1.64 | |||
| Justice Party of Denmark | 1,714 | 7.99 | +3.20 | |||
| Communist Party of Denmark | 1,099 | 5.13 | -0.88 | |||
| Social Liberals | 878 | 4.10 | +0.05 | |||
| Independent Party | 699 | 3.26 | -1.31 | |||
| 0,0 | 0.00 | |||||
| Total | 21,439 | |||||
| Source[32] | ||||||
September 1953 Danish Folketing election
| Parties | Vote | |||||
|---|---|---|---|---|---|---|
| Votes | % | + / - | ||||
| Social Democrats | 7,637 | 40.37 | +1.12 | |||
| Venstre | 5,355 | 28.31 | +0.06 | |||
| Conservatives | 2,251 | 11.90 | -0.18 | |||
| Communist Party of Denmark | 1,137 | 6.01 | -0.97 | |||
| Justice Party of Denmark | 906 | 4.79 | -3.17 | |||
| Independent Party | 865 | 4.57 | New | |||
| Social Liberals | 767 | 4.05 | -0.70 | |||
| Total | 18,918 | |||||
| Source[33] | ||||||
April 1953 Danish Folketing election
| Parties | Vote | |||||
|---|---|---|---|---|---|---|
| Votes | % | + / - | ||||
| Social Democrats | 7,011 | 39.25 | +1.29 | |||
| Venstre | 5,046 | 28.25 | -1.69 | |||
| Conservatives | 2,158 | 12.08 | -0.99 | |||
| Justice Party of Denmark | 1,422 | 7.96 | -1.60 | |||
| Communist Party of Denmark | 1,246 | 6.98 | +1.12 | |||
| Social Liberals | 848 | 4.75 | +1.13 | |||
| Danish Unity | 131 | 0.73 | New | |||
| Total | 17,862 | |||||
| Source[34] | ||||||
1950 Danish Folketing election
| Parties | Vote | |||||
|---|---|---|---|---|---|---|
| Votes | % | + / - | ||||
| Social Democrats | 6,856 | 37.96 | -0.98 | |||
| Venstre | 5,407 | 29.94 | -5.90 | |||
| Conservatives | 2,360 | 13.07 | +4.51 | |||
| Justice Party of Denmark | 1,726 | 9.56 | +4.77 | |||
| Communist Party of Denmark | 1,058 | 5.86 | -1.33 | |||
| Social Liberals | 654 | 3.62 | +0.26 | |||
| Total | 18,061 | |||||
| Source[35] | ||||||
General elections in the 1940s
1947 Danish Folketing election
| Parties | Vote | |||||
|---|---|---|---|---|---|---|
| Votes | % | + / - | ||||
| Social Democrats | 7,051 | 38.94 | +8.00 | |||
| Venstre | 6,490 | 35.84 | +0.57 | |||
| Conservatives | 1,550 | 8.56 | -2.01 | |||
| Communist Party of Denmark | 1,302 | 7.19 | -7.32 | |||
| Justice Party of Denmark | 867 | 4.79 | +3.45 | |||
| Social Liberals | 608 | 3.36 | -0.19 | |||
| Danish Unity | 238 | 1.31 | -2.51 | |||
| Total | 18,106 | |||||
| Source[36] | ||||||
1945 Danish Folketing election
| Parties | Vote | |||||
|---|---|---|---|---|---|---|
| Votes | % | + / - | ||||
| Venstre | 6,238 | 35.27 | +6.43 | |||
| Social Democrats | 5,473 | 30.94 | -15.03 | |||
| Communist Party of Denmark | 2,566 | 14.51 | New | |||
| Conservatives | 1,870 | 10.57 | -4.34 | |||
| Danish Unity | 675 | 3.82 | +2.07 | |||
| Social Liberals | 628 | 3.55 | -0.91 | |||
| Justice Party of Denmark | 237 | 1.34 | +0.19 | |||
| Total | 17,687 | |||||
| Source[37] | ||||||
1943 Danish Folketing election
| Parties | Vote | |||||
|---|---|---|---|---|---|---|
| Votes | % | + / - | ||||
| Social Democrats | 7,818 | 45.97 | +4.11 | |||
| Venstre | 4,905 | 28.84 | +3.34 | |||
| Conservatives | 2,535 | 14.91 | +3.94 | |||
| Social Liberals | 758 | 4.46 | -0.58 | |||
| National Socialist Workers' Party of Denmark | 496 | 2.92 | +1.09 | |||
| Danish Unity | 298 | 1.75 | +1.60 | |||
| Justice Party of Denmark | 195 | 1.15 | -0.49 | |||
| Farmers' Party | 0 | 0.00 | -9.03 | |||
| Total | 17,005 | |||||
| Source[38] | ||||||
General elections in the 1930s
1939 Danish Folketing election
| Parties | Vote | |||||
|---|---|---|---|---|---|---|
| Votes | % | + / - | ||||
| Social Democrats | 5,699 | 41.86 | -1.60 | |||
| Venstre | 3,471 | 25.50 | -8.23 | |||
| Conservatives | 1,493 | 10.97 | +1.14 | |||
| Farmers' Party | 1,229 | 9.03 | +6.03 | |||
| Social Liberals | 686 | 5.04 | -0.11 | |||
| Communist Party of Denmark | 467 | 3.43 | +1.45 | |||
| National Socialist Workers' Party of Denmark | 249 | 1.83 | +1.05 | |||
| Justice Party of Denmark | 223 | 1.64 | -0.42 | |||
| National Cooperation | 76 | 0.56 | New | |||
| Danish Unity | 21 | 0.15 | New | |||
| Total | 13,614 | |||||
| Source[39] | ||||||
1935 Danish Folketing election
| Parties | Vote | |||||
|---|---|---|---|---|---|---|
| Votes | % | + / - | ||||
| Social Democrats | 5,872 | 43.46 | +3.92 | |||
| Venstre | 4,558 | 33.73 | -8.45 | |||
| Conservatives | 1,328 | 9.83 | -0.06 | |||
| Social Liberals | 696 | 5.15 | -0.02 | |||
| Independent People's Party | 406 | 3.00 | New | |||
| Justice Party of Denmark | 279 | 2.06 | -0.21 | |||
| Communist Party of Denmark | 267 | 1.98 | +1.03 | |||
| National Socialist Workers' Party of Denmark | 106 | 0.78 | New | |||
| Total | 13,512 | |||||
| Source[40] | ||||||
1932 Danish Folketing election
| Parties | Vote | |||||
|---|---|---|---|---|---|---|
| Votes | % | + / - | ||||
| Venstre | 5,552 | 42.18 | -8.71 | |||
| Social Democrats | 5,204 | 39.54 | +1.19 | |||
| Conservatives | 1,302 | 9.89 | +5.79 | |||
| Social Liberals | 681 | 5.17 | -0.05 | |||
| Justice Party of Denmark | 299 | 2.27 | +1.20 | |||
| Communist Party of Denmark | 125 | 0.95 | +0.57 | |||
| 0,0 | 0.00 | |||||
| Total | 13,163 | |||||
| Source[41] | ||||||
General elections in the 1920s
1929 Danish Folketing election
| Parties | Vote | |||||
|---|---|---|---|---|---|---|
| Votes | % | + / - | ||||
| Venstre | 6,225 | 50.89 | +7.27 | |||
| Social Democrats | 4,691 | 38.35 | +3.33 | |||
| Social Liberals | 638 | 5.22 | -3.20 | |||
| Conservatives | 502 | 4.10 | -7.50 | |||
| Justice Party of Denmark | 131 | 1.07 | +0.07 | |||
| Communist Party of Denmark | 46 | 0.38 | +0.04 | |||
| Total | 12,233 | |||||
| Source[42] | ||||||
1926 Danish Folketing election
| Parties | Vote | |||||
|---|---|---|---|---|---|---|
| Votes | % | + / - | ||||
| Venstre | 27,210 | 43.62 | -8.48 | |||
| Social Democrats | 21,849 | 35.02 | +2.40 | |||
| Conservatives | 7,237 | 11.60 | +6.91 | |||
| Social Liberals | 5,255 | 8.42 | -1.01 | |||
| Justice Party of Denmark | 621 | 1.00 | +0.69 | |||
| Communist Party of Denmark | 214 | 0.34 | -0.51 | |||
| Total | 62,386 | |||||
| Source[43] | ||||||
1924 Danish Folketing election
| Parties | Vote | |||||
|---|---|---|---|---|---|---|
| Votes | % | + / - | ||||
| Venstre | 5,482 | 52.10 | New | |||
| Social Democrats | 3,432 | 32.62 | -31.76 | |||
| Social Liberals | 992 | 9.43 | -14.28 | |||
| Conservatives | 494 | 4.69 | -6.64 | |||
| Communist Party of Denmark | 89 | 0.85 | New | |||
| Justice Party of Denmark | 33 | 0.31 | New | |||
| Total | 10,522 | |||||
| Source[44] | ||||||
September 1920 Danish Folketing election
| Parties | Vote | |||||
|---|---|---|---|---|---|---|
| Votes | % | + / - | ||||
| Social Democrats | 2,558 | 64.38 | +42.14 | |||
| Social Liberals | 942 | 23.71 | +15.89 | |||
| Conservatives | 450 | 11.33 | +7.31 | |||
| Industry Party | 19 | 0.48 | +0.31 | |||
| Danish Left Socialist Party | 4 | 0.10 | New | |||
| Total | 3,973 | |||||
| Source[45] | ||||||
July 1920 Danish Folketing election
| Parties | Vote | |||||
|---|---|---|---|---|---|---|
| Votes | % | + / - | ||||
| Venstre | 4,966 | 61.28 | +1.80 | |||
| Social Democrats | 1,802 | 22.24 | +0.29 | |||
| Social Liberals | 634 | 7.82 | -1.86 | |||
| Laurits V. Birck | 362 | 4.47 | New | |||
| Conservatives | 326 | 4.02 | -0.53 | |||
| Industry Party | 14 | 0.17 | New | |||
| Total | 8,104 | |||||
| Source[46] | ||||||
April 1920 Danish Folketing election
| Parties | Vote | |||||
|---|---|---|---|---|---|---|
| Votes | % | |||||
| Venstre | 5,098 | 59.48 | ||||
| Social Democrats | 1,881 | 21.95 | ||||
| Social Liberals | 830 | 9.68 | ||||
| Conservatives | 390 | 4.55 | ||||
| Centrum | 372 | 4.34 | ||||
| Total | 8,571 | |||||
| Source[47] | ||||||
European Parliament elections results
2019 European Parliament election in Denmark
| Parties | Vote | |||||
|---|---|---|---|---|---|---|
| Votes | % | + / - | ||||
| Social Democrats | 8,114 | 26.70 | +3.57 | |||
| Venstre | 8,064 | 26.53 | +11.10 | |||
| Green Left | 3,381 | 11.13 | +1.85 | |||
| Danish People's Party | 2,753 | 9.06 | -17.28 | |||
| Social Liberals | 2,412 | 7.94 | +2.55 | |||
| Red–Green Alliance | 1,546 | 5.09 | New | |||
| People's Movement against the EU | 1,290 | 4.24 | -5.52 | |||
| Conservatives | 1,143 | 3.76 | -3.13 | |||
| The Alternative | 1,069 | 3.52 | New | |||
| Liberal Alliance | 619 | 2.04 | -1.74 | |||
| Total | 30,391 | |||||
| Source[48] | ||||||
2014 European Parliament election in Denmark
| Parties | Vote | |||||
|---|---|---|---|---|---|---|
| Votes | % | + / - | ||||
| Danish People's Party | 5,986 | 26.34 | +12.54 | |||
| Social Democrats | 5,256 | 23.13 | -1.94 | |||
| Venstre | 3,506 | 15.43 | -3.44 | |||
| People's Movement against the EU | 2,218 | 9.76 | +2.39 | |||
| Green Left | 2,110 | 9.28 | -6.47 | |||
| Conservatives | 1,566 | 6.89 | -4.65 | |||
| Social Liberals | 1,225 | 5.39 | +1.69 | |||
| Liberal Alliance | 859 | 3.78 | +3.15 | |||
| Total | 22,726 | |||||
| Source[49] | ||||||
2009 European Parliament election in Denmark
| Parties | Vote | |||||
|---|---|---|---|---|---|---|
| Votes | % | + / - | ||||
| Social Democrats | 6,095 | 25.07 | -10.17 | |||
| Venstre | 4,587 | 18.87 | -4.74 | |||
| Green Left | 3,828 | 15.75 | +10.48 | |||
| Danish People's Party | 3,355 | 13.80 | +6.79 | |||
| Conservatives | 2,806 | 11.54 | +3.67 | |||
| People's Movement against the EU | 1,791 | 7.37 | +2.90 | |||
| Social Liberals | 900 | 3.70 | -0.03 | |||
| June Movement | 796 | 3.27 | -8.22 | |||
| Liberal Alliance | 152 | 0.63 | New | |||
| Total | 24,310 | |||||
| Source[50] | ||||||
2004 European Parliament election in Denmark
| Parties | Vote | |||||
|---|---|---|---|---|---|---|
| Votes | % | + / - | ||||
| Social Democrats | 7,172 | 35.24 | +17.98 | |||
| Venstre | 4,804 | 23.61 | -1.82 | |||
| June Movement | 2,339 | 11.49 | -5.04 | |||
| Conservatives | 1,601 | 7.87 | +1.17 | |||
| Danish People's Party | 1,427 | 7.01 | +1.24 | |||
| Green Left | 1,072 | 5.27 | -1.15 | |||
| People's Movement against the EU | 909 | 4.47 | -3.46 | |||
| Social Liberals | 759 | 3.73 | -4.41 | |||
| Christian Democrats | 266 | 1.31 | -1.25 | |||
| Total | 20,349 | |||||
| Source[51] | ||||||
1999 European Parliament election in Denmark
| Parties | Vote | |||||
|---|---|---|---|---|---|---|
| Votes | % | + / - | ||||
| Venstre | 5,001 | 25.43 | +4.66 | |||
| Social Democrats | 3,394 | 17.26 | -1.44 | |||
| June Movement | 3,250 | 16.53 | +2.85 | |||
| Social Liberals | 1,600 | 8.14 | -0.49 | |||
| People's Movement against the EU | 1,559 | 7.93 | -4.05 | |||
| Conservatives | 1,317 | 6.70 | -7.34 | |||
| Green Left | 1,262 | 6.42 | -0.08 | |||
| Danish People's Party | 1,134 | 5.77 | New | |||
| Centre Democrats | 644 | 3.28 | +2.35 | |||
| Christian Democrats | 503 | 2.56 | +1.30 | |||
| Progress Party | 308 | 1.57 | -1.94 | |||
| Total | 19,664 | |||||
| Source[52] | ||||||
1994 European Parliament election in Denmark
| Parties | Vote | |||||
|---|---|---|---|---|---|---|
| Votes | % | + / - | ||||
| Venstre | 4,365 | 20.77 | +4.79 | |||
| Social Democrats | 3,931 | 18.70 | -10.85 | |||
| Conservatives | 2,951 | 14.04 | +3.49 | |||
| June Movement | 2,875 | 13.68 | New | |||
| People's Movement against the EU | 2,519 | 11.98 | -3.67 | |||
| Social Liberals | 1,814 | 8.63 | +6.28 | |||
| Green Left | 1,366 | 6.50 | -1.44 | |||
| Progress Party | 737 | 3.51 | -3.24 | |||
| Christian Democrats | 265 | 1.26 | -1.82 | |||
| Centre Democrats | 195 | 0.93 | -7.23 | |||
| Total | 21,018 | |||||
| Source[53] | ||||||
1989 European Parliament election in Denmark
| Parties | Vote | |||||
|---|---|---|---|---|---|---|
| Votes | % | + / - | ||||
| Social Democrats | 5,163 | 29.55 | +6.20 | |||
| Venstre | 2,793 | 15.98 | +2.41 | |||
| People's Movement against the EU | 2,735 | 15.65 | -2.49 | |||
| Conservatives | 1,843 | 10.55 | -7.10 | |||
| Centre Democrats | 1,425 | 8.16 | +1.05 | |||
| Green Left | 1,387 | 7.94 | -0.78 | |||
| Progress Party | 1,179 | 6.75 | +2.27 | |||
| Christian Democrats | 538 | 3.08 | -0.34 | |||
| Social Liberals | 410 | 2.35 | -0.31 | |||
| Total | 17,473 | |||||
| Source[54] | ||||||
1984 European Parliament election in Denmark
| Parties | Vote | |||||
|---|---|---|---|---|---|---|
| Votes | % | |||||
| Social Democrats | 4,746 | 23.35 | ||||
| People's Movement against the EU | 3,688 | 18.14 | ||||
| Conservatives | 3,587 | 17.65 | ||||
| Venstre | 2,758 | 13.57 | ||||
| Green Left | 1,772 | 8.72 | ||||
| Centre Democrats | 1,446 | 7.11 | ||||
| Progress Party | 911 | 4.48 | ||||
| Christian Democrats | 695 | 3.42 | ||||
| Social Liberals | 541 | 2.66 | ||||
| Left Socialists | 182 | 0.90 | ||||
| Total | 20,326 | |||||
| Source[55] | ||||||
Referendums
2022 Danish European Union opt-out referendum[56]
| Option | Votes | % |
|---|---|---|
| ✓ YES | 20,289 | 65.34 |
| X NO | 10,764 | 34.66 |
2015 Danish European Union opt-out referendum[57]
| Option | Votes | % |
|---|---|---|
| X NO | 18,968 | 58.15 |
| ✓ YES | 13,649 | 41.85 |
2014 Danish Unified Patent Court membership referendum[58]
| Option | Votes | % |
|---|---|---|
| ✓ YES | 13,065 | 58.91 |
| X NO | 9,112 | 41.09 |
2009 Danish Act of Succession referendum[59]
| Option | Votes | % |
|---|---|---|
| ✓ YES | 19,485 | 84.97 |
| X NO | 3,447 | 15.03 |
2000 Danish euro referendum[60]
| Option | Votes | % |
|---|---|---|
| X NO | 23,227 | 58.43 |
| ✓ YES | 16,525 | 41.57 |
1998 Danish Amsterdam Treaty referendum[61]
| Option | Votes | % |
|---|---|---|
| ✓ YES | 17,109 | 52.37 |
| X NO | 15,561 | 47.63 |
1993 Danish Maastricht Treaty referendum[62]
| Option | Votes | % |
|---|---|---|
| ✓ YES | 20,401 | 53.68 |
| X NO | 17,607 | 46.32 |
1992 Danish Maastricht Treaty referendum[63]
| Option | Votes | % |
|---|---|---|
| X NO | 19,327 | 54.34 |
| ✓ YES | 16,241 | 45.66 |
1986 Danish Single European Act referendum[64]
| Option | Votes | % |
|---|---|---|
| ✓ YES | 17,445 | 53.68 |
| X NO | 15,053 | 46.32 |
1972 Danish European Communities membership referendum[65]
| Option | Votes | % |
|---|---|---|
| ✓ YES | 20,937 | 63.26 |
| X NO | 12,162 | 36.74 |
1953 Danish constitutional and electoral age referendum[66]
| Option | Votes | % |
|---|---|---|
| ✓ YES | 7,885 | 71.06 |
| X NO | 3,212 | 28.94 |
| 23 years | 5,920 | 51.53 |
| 21 years | 5,569 | 48.47 |
1939 Danish constitutional referendum[67]
| Option | Votes | % |
|---|---|---|
| ✓ YES | 5,902 | 89.60 |
| X NO | 685 | 10.40 |
References
- "Aalborg Northkredsen". kmdvalg.dk (in Danish). Retrieved 2023-06-02.
- "Beretning om Forhandlingerne paa Rigsdagen". Rigsdagstidende. II: Spalte 3892 ff.
- "Nye valgkredse fordeler stemmerne anderledes". dr.dk (in Danish). Retrieved 2023-06-02.
- "Beretning om nye valgkredse som følge af kommunalreformen" (in Danish). Retrieved 2023-06-02.
- "Det danske valgsystem: Valg til Folketinget". valg.im (in Danish). Retrieved 2023-06-02.
- "92 Aalborg North". dataforsyningen.dk (in Danish). Retrieved 2023-06-02.
- "Beretning om Forhandlingerne paa Rigsdagen". Rigsdagstidende. II: Spalte 3892 ff.
- "Valgresultater fra tidligere valg:". kmdvalg (in Danish). Retrieved 2023-06-02.
- "FOLKETINGSVALG TIRSDAG 1. NOVEMBER 2022". valg.im (in Danish). Retrieved 2023-06-27.
- "FOLKETINGSVALG ONSDAG 5. JUNI 2019". valg.im (in Danish). Retrieved 2023-06-27.
- "FOLKETINGSVALG TORSDAG 18. JUNI 2015". valg.im (in Danish). Retrieved 2023-06-27.
- "FOLKETINGSVALG TORSDAG 15. SEPTEMBER 2011". valg.im (in Danish). Retrieved 2023-06-27.
- "Folketingsvalget den 13. november 2007". valg.im (in Danish). Retrieved 2023-06-27.
- "valg2005.book" (PDF). valg.im (in Danish). Retrieved 2023-06-27.
- "BMTABEL" (PDF). valg.im (in Danish). Retrieved 2023-06-27.
- "VALG98" (PDF). valg.im (in Danish). Retrieved 2023-06-27.
- "VALG94" (PDF). valg.im (in Danish). Retrieved 2023-06-27.
- "VALG90" (PDF). valg.im (in Danish). Retrieved 2023-06-27.
- "Folketingsvalget den 10. maj 1988". valg.im (in Danish). Retrieved 2023-06-27.
- "Folketingsvalget den 8.september 1987". dst.dk (in Danish). Retrieved 2023-06-27.
- "Folketingsvalget den 10. januar 1984". dst.dk (in Danish). Retrieved 2023-06-27.
- "Folketingsvalget den 8. december 1981". dst.dk (in Danish). Retrieved 2023-06-27.
- "Folketingsvalget den 23. oktober 1979". dst.dk (in Danish). Retrieved 2023-06-27.
- "Folketingsvalget den 15. februar 1977". dst.dk (in Danish). Retrieved 2023-06-27.
- "Folketingsvalget den 9. januar 1975". dst.dk (in Danish). Retrieved 2023-06-27.
- "Folketingsvalget den 4. december 1973". dst.dk (in Danish). Retrieved 2023-06-27.
- "Folketingsvalget den 21. september 1971 samt folkeafstemningen". dst.dk (in Danish). Retrieved 2023-06-27.
- "Folketingsvalget den 23. januar 1968". dst.dk (in Danish). Retrieved 2023-06-27.
- "Folketingsvalget den 22. november 1966". dst.dk (in Danish). Retrieved 2023-06-27.
- "Folketingsvalget den 22. september 1964". dst.dk (in Danish). Retrieved 2023-06-27.
- "Folketingsvalget den 15. november 1960". dst.dk (in Danish). Retrieved 2023-06-27.
- "Folketingsvalget den 14. maj 1957". dst.dk (in Danish). Retrieved 2023-06-27.
- "Folketingsvalget den 22. september 1953". dst.dk (in Danish). Retrieved 2023-06-27.
- "Rigsdagsvalgene og folkeafstemningerne i april og maj 1953". dst.dk (in Danish). Retrieved 2023-06-27.
- "Folketingsvalget den 5. september 1950". dst.dk (in Danish). Retrieved 2023-06-27.
- "Folketingsvalget den 28. oktober 1947". dst.dk (in Danish). Retrieved 2023-06-27.
- "Rigsdagsvalgene i oktober og november 1945". dst.dk (in Danish). Retrieved 2023-06-27.
- "Rigsdagsvalgene i marts og april 1943". dst.dk (in Danish). Retrieved 2023-06-27.
- "Rigsdagsvalgene og Folkeafstemningen i april og maj 1939". dst.dk (in Danish). Retrieved 2023-06-27.
- "Folketingsvalget den 22. oktober 1935". dst.dk (in Danish). Retrieved 2023-06-27.
- "Folketingsvalget den 16. november 1932". dst.dk (in Danish). Retrieved 2023-06-27.
- "Folketingsvalget den 24. april 1929". dst.dk (in Danish). Retrieved 2023-06-27.
- "Folketingsvalget den 2. december 1926". dst.dk (in Danish). Retrieved 2023-06-27.
- "Folketingsvalget den 11. april 1924". dst.dk (in Danish). Retrieved 2023-06-27.
- "Rigsdagsvalgene september-oktober 1920". dst.dk (in Danish). Retrieved 2023-06-27.
- "Rigsdagsvalgene juli-august 1920". dst.dk (in Danish). Retrieved 2023-06-27.
- "Folketingsvalget den 26. april 1920". dst.dk (in Danish). Retrieved 2023-06-27.
- "EUROPA-PARLAMENTSVALG SØNDAG 26. MAJ 2019". dst.dk (in Danish). Retrieved 2023-07-01.
- "EUROPA-PARLAMENTSVALG SØNDAG 25. MAJ 2014". dst.dk (in Danish). Retrieved 2023-07-01.
- "EUROPA-PARLAMENTSVALG SØNDAG 7. JUNI 2009". dst.dk (in Danish). Retrieved 2023-07-01.
- "EUROPA-PARLAMENTSVALGET DEN 13. JUNI 2004" (PDF). im.dk (in Danish). Retrieved 2023-07-01.
- "VALGET TIL EUROPA-PARLAMENTET DEN 10. JUNI 1999" (PDF). im.dk (in Danish). Retrieved 2023-07-01.
- "VALGET TIL EUROPA-PARLAMENTET DEN 9. JUNI 1994" (PDF). im.dk (in Danish). Retrieved 2023-07-01.
- "Valget til Europa-parlamentet den 15. juni 1989". dst.dk (in Danish). Retrieved 2023-07-01.
- "Valget til Europa-Parlamentet den 14. juni 1984". dst.dk (in Danish). Retrieved 2023-07-01.
- "FOLKEAFSTEMNING ONSDAG 1. JUNI 2022". dst.dk (in Danish). Retrieved 2023-07-05.
- "FOLKEAFSTEMNING TORSDAG 3. DECEMBER 2015". dst.dk (in Danish). Retrieved 2023-07-05.
- "FOLKEAFSTEMNING SØNDAG 25. MAJ 2014". dst.dk (in Danish). Retrieved 2023-07-05.
- "FOLKEAFSTEMNING SØNDAG 7. JUNI 2009". dst.dk (in Danish). Retrieved 2023-07-05.
- "FOLKEAFSTEMNINGEN DEN 28. SEPTEMBER 2000 OM DANMARKS DELTAGELSE I DEN FÆLLES VALUTA" (PDF). valg.im (in Danish). Retrieved 2023-07-05.
- "FOLKEAFSTEMNINGEN DEN 28. MAJ 1998OM DANMARKS TILTRÆDELSE AF AMSTERDAMTRAKTATEN" (PDF). valg.im (in Danish). Retrieved 2023-07-05.
- "FOLKEAFSTEMNINGEN DEN 18. MAJ 1993 OM DANMARKS TILTRÆDELSE AF EDINBURGH-AFGØRELSEN OG MAASTRICHT-TRAKTATEN". dst.dk (in Danish). Retrieved 2023-07-05.
- "Folkeafstemningen den 1. juni 1992 om Danmarks tiltrædelse af traktaten om Den Europæiske Union". dst.dk (in Danish). Retrieved 2023-07-05.
- "Vejledende folkeafstemning torsdag den 27. februar 1986 om Danmarks tiltrædelse af EF- pakken". dst.dk (in Danish). Retrieved 2023-07-05.
- "Folkeafstemningen om Danmarks tiltrædelse af De europæiske Fælleskaber 2. oktober 1972". dst.dk (in Danish). Retrieved 2023-07-05.
- "Publikationsfortegnelse vedrørende Folkeafstemninger". dst.dk (in Danish). Retrieved 2023-07-05.
- "Publikationsfortegnelse vedrørende Folkeafstemninger". dst.dk (in Danish). Retrieved 2023-07-05.