Economy of the Arab League
The economy of the Arab League is the economy of the member states of the Arab League. The economy is primarily dependent on exports of oil and natural gas; in recent years however, tourism has grown rapidly, becoming the fastest growing sector in the region.
| Part of a series on the |
| Politics of the Arab world |
|---|
 |
The Greater Arab Free Trade Area, founded in 1997, is a pan-Arab free trade area that effectively rendered 95% of all Arab World products free of customs tax.
The economic development in the Arab League exhibits a great diversity. There is a significant difference imbalance in the wealth between the rich oil states of the United Arab Emirates, Qatar, Kuwait and Saudi Arabia, and the developing nations within the League, such as Comoros, Mauritania and Djibouti.
Free trade agreements
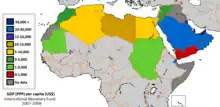
GDP and GDP per capita of member states


Based on latest figures and estimates, the Arab League has a total GDP of approximately $7.1 trillion at purchasing power parity, or US$2.4 trillion at nominal values. The member state with the highest total GDP is Saudi Arabia at $2.002 trillion (PPP), or 1,040 billion in current US dollars (nominal), followed by Egypt at $1.562 trillion (PPP). Comoros has the lowest GDP at $3.2 billion (PPP), or US$1.3 billion at nominal, followed by Djibouti at $6.7 billion (PPP).[1]
The country with the highest GDP per capita is Qatar, at $114,789 (PPP), IMF PPP per capita or US$84,514 (nominal). Somalia has the lowest, with a nominal GDP per capita of US$5499.96 or $1,299.96 (PPP). Therefore, Qatar's nominal GDP per capita is around 156 times as high as that of Somalia.
List
| Country/Territory | GDP (nominal) (US$billion) [2] | GDP (PPP) (US$billion) [2] | GDP / capita [2] | GDP / capita (PPP) [2] |
|---|---|---|---|---|
| 187.155 | 600.668 | 4,151.437 | 13,323.931 | |
| 43.544 | 87.905 | 28,691.769 | 57,921.465 | |
| 1.242 | 3.214 | 1,299.682 | 3,364.331 | |
| 3.725 | 6.619 | 3,665.827 | 6,513.859 | |
| 469.094 | 1,661.955 | 4,504.369 | 15,958.549 | |
| 282.876 | 524.210 | 6,695.851 | 12,408.385 | |
| 48.066 | 123.351 | 4,666.199 | 11,974.857 | |
| 183.568 | 248.113 | 38,123.224 | 51,527.916 | |
| 24.494 (2020) | 77.651 (2020) | 3,588.705 (2020) | 11,376.759 (2020) | |
| 40.836 | 128.389 | 6,025.680 | 18,944.704 | |
| 10.091 | 30.013 | 2,328.251 | 6,924.845 | |
| 142.874 | 359.671 | 3,896.214 | 9,808.319 | |
| 108.969 | 190.475 | 23,541.507 | 41,150.002 | |
| 18.818 | 33.996 | 3,517.363 | 6,354.205 | |
| 221.369 | 303.596 | 82,886.789 | 113,674.648 | |
| 1,010.588 | 2,018.260 | 27,941.493 | 55,802.338 | |
| 8.416 | 20.642 | 539.001 | 1,322.027 | |
| 42.762 | 207.713 | 916.033 | 4,449.591 | |
| 60.043 (2010) | 136.359 (2010) | 11,304.64 (2010) | 6,374.064 (2010) | |
| 46.282 | 151.495 | 3,815.820 | 12,490.201 | |
| 503.913 | 814.733 | 47,792.940 | 77,272.298 | |
| 27.594 | 67.454 | 873.903 | 2,136.280 | |
| 3,486.319[2][n 1] | 7,796.482[2][n 2] | 7,722.731[5] | 17,270.403[6] |
.[7]
Notes
- The sum of all GDP figures below.
- The sum of all GDP figures below.
References
- "World Economic Outlook, April 2022: War Sets Back The Global Recovery". IMF. Retrieved 2022-05-16.
- "Report for Selected Countries and Subjects". IMF.
- "Here Are the Richest Countries in the MENA Region 2021".
- "These are the 25 richest countries in the world". USA Today.
- "Population-The World Factbook". www.cia.gov.
- "Population-The World Factbook". www.cia.gov.
- "Quality of Nationality Index".
