Arta Mountains
The Arta Mountains, also known as the Great Mountains of Arta (Somali: Buuraha Carta) are a mountain range in Djibouti. They sit at an average elevation of 700 metres (2,300 ft) above sea level, is the tenth highest point in Djibouti. The mountains lie to the south of the Gulf of Tadjoura, in the Arta Region. They are situated approximately 35 kilometres (21 mi) west of the capital Djibouti City, and 69 kilometres (43 mi) by road from Ali Sabieh.
| Arta Mountains | |
|---|---|
 A view of the Gulf of Tadjoura from Arta. | |
| Highest point | |
| Peak | Arta |
| Elevation | 755 m (2,477 ft) |
| Coordinates | 11°31′08″N 42°49′58″E |
| Dimensions | |
| Length | 22 km (14 mi) |
| Width | 10 km (6.2 mi) |
| Area | 205 km2 (79 sq mi) |
| Naming | |
| Nickname | The Great Mountains of Arta |
| Native name | Buuraha Carta (Somali) |
| Geography | |
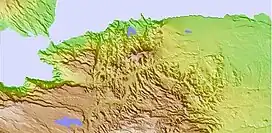 Map of The Mountains of Arta
| |
| Country | |
| Region | Arta Region |
Geology
The Arta Mountains were formed by the collision of the Arabian and Somali tectonic plates.
Flora
Much of the land is covered with Buxus, Acacia, Vachellia flava and other drought tolerant plants. Doum Palms are found in the northern part of mountian near the Gulf of Tadjoura.
Climate
Arta Mountains has a hot semi-arid climate (Köppen BSh) surrounded by a hot desert climate (BWh). So it has a mild fresh weather, The climate is greatly affected by its varying geographic features. Due to its location at 755 metres (2,477 ft) above sea level, Arta Mountains climate is very warm summers and cool winters.
| Climate data for Arta, Djibouti (1956-1974) | |||||||||||||
|---|---|---|---|---|---|---|---|---|---|---|---|---|---|
| Month | Jan | Feb | Mar | Apr | May | Jun | Jul | Aug | Sep | Oct | Nov | Dec | Year |
| Record high °C (°F) | 30.1 (86.2) |
28.4 (83.1) |
30.8 (87.4) |
34.5 (94.1) |
41.2 (106.2) |
40.5 (104.9) |
41.0 (105.8) |
39.8 (103.6) |
41.0 (105.8) |
36.8 (98.2) |
32.0 (89.6) |
30.0 (86.0) |
41.2 (106.2) |
| Average high °C (°F) | 22.7 (72.9) |
23.0 (73.4) |
24.9 (76.8) |
28.0 (82.4) |
32.5 (90.5) |
37.3 (99.1) |
36.9 (98.4) |
36.2 (97.2) |
34.6 (94.3) |
29.1 (84.4) |
25.7 (78.3) |
24.1 (75.4) |
29.6 (85.3) |
| Daily mean °C (°F) | 19.9 (67.8) |
20.1 (68.2) |
21.8 (71.2) |
24.4 (75.9) |
28.2 (82.8) |
32.4 (90.3) |
32.0 (89.6) |
31.0 (87.8) |
29.8 (85.6) |
25.1 (77.2) |
22.1 (71.8) |
20.7 (69.3) |
25.6 (78.1) |
| Average low °C (°F) | 17.1 (62.8) |
17.3 (63.1) |
18.7 (65.7) |
20.8 (69.4) |
23.9 (75.0) |
27.4 (81.3) |
27.0 (80.6) |
25.9 (78.6) |
25.0 (77.0) |
21.2 (70.2) |
18.5 (65.3) |
17.4 (63.3) |
21.7 (71.0) |
| Record low °C (°F) | 12.8 (55.0) |
13.2 (55.8) |
14.5 (58.1) |
14.2 (57.6) |
18.0 (64.4) |
21.0 (69.8) |
21.5 (70.7) |
19.1 (66.4) |
16.6 (61.9) |
17.1 (62.8) |
14.5 (58.1) |
13.2 (55.8) |
12.8 (55.0) |
| Average precipitation mm (inches) | 45.9 (1.81) |
41.9 (1.65) |
16.3 (0.64) |
20.0 (0.79) |
6.2 (0.24) |
0.5 (0.02) |
5.3 (0.21) |
22.7 (0.89) |
8.2 (0.32) |
11.6 (0.46) |
13.5 (0.53) |
13.1 (0.52) |
205.2 (8.08) |
| Average precipitation days | 6.5 | 5.8 | 3.6 | 2.5 | 0.6 | 0.2 | 1.6 | 2.3 | 0.9 | 0.8 | 2.1 | 3.3 | 30.2 |
| Mean monthly sunshine hours | 164.5 | 160.8 | 200.1 | 248.4 | 290.7 | 282.6 | 262.6 | 272.8 | 268.0 | 286.0 | 262.3 | 221.4 | 2,920.1 |
| Percent possible sunshine | 47 | 49 | 54 | 68 | 75 | 74 | 67 | 71 | 74 | 79 | 76 | 63 | 67 |
| Source: NOAA (precipitation 1952-1974)[1] | |||||||||||||
See also
References
- "Djibouti Climatological Data". National Oceanic and Atmospheric Administration. Retrieved January 20, 2023.
- United States Bureau of Mines, Geological Survey (2000). Minerals Yearbook, Volume 3. The Bureau. pp. 12–1.