1932 Belgian general election
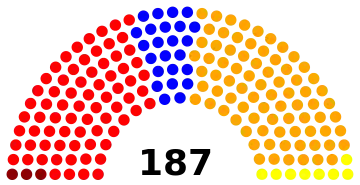
General elections were held in Belgium on 27 November 1932.[1] The Catholic Party won 79 of the 187 seats in the Chamber of Representatives and 42 of the 93 seats in the Senate.[2] Voter turnout was 94.3%.[3]
| |||||||||||||||||||||||||||||||||||||||||
All 187 seats in the Chamber of Representatives All 93 seats in the Senate | |||||||||||||||||||||||||||||||||||||||||
|---|---|---|---|---|---|---|---|---|---|---|---|---|---|---|---|---|---|---|---|---|---|---|---|---|---|---|---|---|---|---|---|---|---|---|---|---|---|---|---|---|---|
| |||||||||||||||||||||||||||||||||||||||||
| |||||||||||||||||||||||||||||||||||||||||
Background

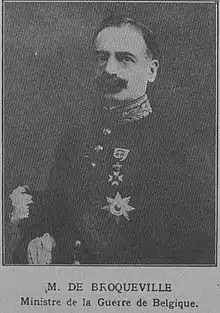
The elections occurred during an economic crisis, the Great Depression. The Catholic-Liberal government led by Jules Renkin faced rising unemployment, derailing public finances and strikes benefiting the Communist Party. Parliamentary elections were due in May 1933 at the latest. On 18 October 1932, Prime Minister Renkin resigned under pressure from King Albert I, allowing the more experienced Charles de Broqueville to take charge. He immediately dissolved parliament and scheduled parliamentary elections for 27 November 1932.
Municipal elections had also occurred on 9 October 1932, where the Catholic Party lost ground to socialists and liberals. To avoid losses during the parliamentary elections, de Broqueville used the issue of education in the election campaign, which was a major issue under his previous 1911–1918 government.
His strategy worked; the Catholics won, but also the socialists and communists gained ground, whereas the liberals lost seats. The socialists refused to enter government, and the Catholic-Liberal coalition continued their government and proceeded to take drastic measures for economic recovery.
Results
Chamber of Representatives
 | |||||
|---|---|---|---|---|---|
| Party | Votes | % | Seats | +/– | |
| Catholic Party | 856,027 | 38.42 | 79 | +8 | |
| Belgian Labour Party | 824,946 | 37.03 | 73 | +3 | |
| Liberal Party | 313,722 | 14.08 | 24 | –4 | |
| Frontpartij | 126,113 | 5.66 | 8 | –3 | |
| Communist Party of Belgium | 64,552 | 2.90 | 3 | +2 | |
| Belgian National Party | 12,977 | 0.58 | 0 | New | |
| Christian People's Party | 7,701 | 0.35 | 0 | 0 | |
| Catholic dissidents | 4,664 | 0.21 | 0 | New | |
| Frontpartij dissidents | 4,642 | 0.21 | 0 | New | |
| Farmers | 4,294 | 0.19 | 0 | New | |
| Taxpayers Bloc | 2,511 | 0.11 | 0 | New | |
| Socialist dissidents | 1,831 | 0.08 | 0 | New | |
| Independent socialists | 838 | 0.04 | 0 | New | |
| French Defence Party | 789 | 0.04 | 0 | New | |
| Radical Socialists | 590 | 0.03 | 0 | 0 | |
| Radical Party–Radical Socialists | 380 | 0.02 | 0 | New | |
| National Radical Party–Radical Party | 248 | 0.01 | 0 | New | |
| Independent Communists | 211 | 0.01 | 0 | New | |
| Isolated Unemployed | 206 | 0.01 | 0 | New | |
| Farmers and Business | 184 | 0.01 | 0 | New | |
| General Interests | 172 | 0.01 | 0 | New | |
| Public Salvation Committee | 148 | 0.01 | 0 | New | |
| Stroobants | 130 | 0.01 | 0 | New | |
| Total | 2,227,876 | 100.00 | 187 | 0 | |
| Valid votes | 2,227,876 | 98.30 | |||
| Invalid/blank votes | 38,600 | 1.70 | |||
| Total votes | 2,266,476 | 100.00 | |||
| Registered voters/turnout | 2,555,743 | 88.68 | |||
| Source: Belgian Elections | |||||
Senate
 | |||||
|---|---|---|---|---|---|
| Party | Votes | % | Seats | +/– | |
| Catholic Party | 893,290 | 39.05 | 42 | +4 | |
| Belgian Labour Party | 860,053 | 37.60 | 39 | +3 | |
| Liberal Party | 339,127 | 14.83 | 11 | -2 | |
| Frontpartij | 119,740 | 5.23 | 1 | –2 | |
| Communist Party of Belgium | 54,902 | 2.40 | 0 | 0 | |
| Christian People's Party | 5,961 | 0.26 | 0 | 0 | |
| Belgian National Party | 4,334 | 0.19 | 0 | New | |
| Farmers | 2,194 | 0.10 | 0 | New | |
| Frontpartij dissidents | 2,162 | 0.09 | 0 | New | |
| Socialist dissidents | 2,043 | 0.09 | 0 | New | |
| Taxpayers Bloc | 1,103 | 0.05 | 0 | New | |
| French Defence Party | 881 | 0.04 | 0 | New | |
| National Cartel | 875 | 0.04 | 0 | New | |
| Radical Socialists | 526 | 0.02 | 0 | 0 | |
| National Radical Party–Radical Socialists | 177 | 0.01 | 0 | New | |
| Total | 2,287,368 | 100.00 | 93 | 0 | |
| Valid votes | 2,287,368 | 95.61 | |||
| Invalid/blank votes | 105,105 | 4.39 | |||
| Total votes | 2,392,473 | 100.00 | |||
| Registered voters/turnout | 2,555,743 | 93.61 | |||
| Source: Belgian Elections | |||||
References
- Nohlen, Dieter; Stöver, Philip (31 May 2010). Elections in Europe: A data handbook. Nomos Verlagsgesellschaft. p. 289. ISBN 978-3-8329-5609-7.
- Nohlen & Stöver, p308
- Nohlen & Stöver, p290

