Brønshøj (nomination district)
Brønshøj nominating district is one of the 92 nominating districts that exists for Danish elections following the 2007 municipal reform.[3][4][5] It is one of the 9 nominating districts in Copenhagen Municipality.[6] It was created in 1950,[7] though its boundaries have been changed since then.
| Brønshøj | |
|---|---|
| Brønshøj | |
| Nomination district constituency for the Folketing | |
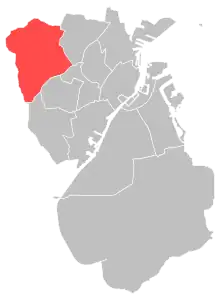 Location of Brønshøj within Copenhagen | |
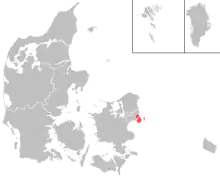 Location of Copenhagen within Denmark | |
| Municipalities | Copenhagen |
| Constituency | Copenhagen |
| Electorate | 54,678 (2022)[1] |
| Current constituency | |
| Created | 1950[2] |
In general elections, the district is a very strong area for parties commonly associated with the red bloc, having been the district where they received their third highest vote share in the 2022 election.[8]
General elections results
General elections in the 2020s
| Parties | Vote | |||||
|---|---|---|---|---|---|---|
| Votes | % | + / - | ||||
| Social Democrats | 10,176 | 23.05 | +2.25 | |||
| Green Left | 5,928 | 13.42 | +0.50 | |||
| Red–Green Alliance | 5,792 | 13.12 | -2.45 | |||
| Moderates | 3,630 | 8.22 | New | |||
| The Alternative | 3,355 | 7.60 | +2.00 | |||
| Venstre | 3,197 | 7.24 | -5.46 | |||
| Social Liberals | 2,961 | 6.71 | -8.47 | |||
| Liberal Alliance | 2,824 | 6.40 | +4.39 | |||
| Conservatives | 1,866 | 4.23 | -0.37 | |||
| Independent Greens | 1,658 | 3.75 | New | |||
| Denmark Democrats | 922 | 2.09 | New | |||
| Danish People's Party | 887 | 2.01 | -3.59 | |||
| New Right | 756 | 1.71 | +0.07 | |||
| Christian Democrats | 130 | 0.29 | -0.64 | |||
| Flemming Blicher | 53 | 0.12 | New | |||
| Tom Gillesberg | 22 | 0.05 | +0.02 | |||
| Total | 44,157 | |||||
| Source[9] | ||||||
General elections in the 2010s
| Parties | Vote | |||||
|---|---|---|---|---|---|---|
| Votes | % | + / - | ||||
| Social Democrats | 9,577 | 20.80 | -4.75 | |||
| Red–Green Alliance | 7,169 | 15.57 | -0.30 | |||
| Social Liberals | 6,989 | 15.18 | +7.72 | |||
| Green Left | 5,949 | 12.92 | +5.15 | |||
| Venstre | 5,848 | 12.70 | +2.90 | |||
| Danish People's Party | 2,579 | 5.60 | -8.84 | |||
| The Alternative | 2,577 | 5.60 | -3.08 | |||
| Conservatives | 2,117 | 4.60 | +1.85 | |||
| Liberal Alliance | 925 | 2.01 | -4.92 | |||
| New Right | 755 | 1.64 | New | |||
| Stram Kurs | 658 | 1.43 | New | |||
| Christian Democrats | 430 | 0.93 | +0.41 | |||
| Klaus Riskær Pedersen Party | 407 | 0.88 | New | |||
| Pierre Tavares | 32 | 0.07 | New | |||
| Tom Gillesberg | 13 | 0.03 | 0.00 | |||
| John Jørgensen | 8 | 0.02 | New | |||
| John Erik Wagner | 3 | 0.01 | -0.01 | |||
| Tommy Schou Christesen | 0 | 0.00 | New | |||
| Total | 46,036 | |||||
| Source[10] | ||||||
| Parties | Vote | |||||
|---|---|---|---|---|---|---|
| Votes | % | + / - | ||||
| Social Democrats | 11,540 | 25.55 | +2.86 | |||
| Red–Green Alliance | 7,170 | 15.87 | +0.92 | |||
| Danish People's Party | 6,523 | 14.44 | +3.30 | |||
| Venstre | 4,428 | 9.80 | -4.83 | |||
| The Alternative | 3,921 | 8.68 | New | |||
| Green Left | 3,509 | 7.77 | -5.69 | |||
| Social Liberals | 3,369 | 7.46 | -6.02 | |||
| Liberal Alliance | 3,130 | 6.93 | +2.41 | |||
| Conservatives | 1,240 | 2.75 | -1.91 | |||
| Christian Democrats | 235 | 0.52 | +0.13 | |||
| Kashif Ahmad | 81 | 0.18 | New | |||
| Tom Gillesberg | 15 | 0.03 | 0.00 | |||
| John Erik Wagner | 8 | 0.02 | +0.01 | |||
| Jan Elkjær | 0 | 0.00 | New | |||
| Total | 45,169 | |||||
| Source[11] | ||||||
| Parties | Vote | |||||
|---|---|---|---|---|---|---|
| Votes | % | + / - | ||||
| Social Democrats | 10,305 | 22.69 | -4.41 | |||
| Red–Green Alliance | 6,790 | 14.95 | +9.41 | |||
| Venstre | 6,647 | 14.63 | +1.23 | |||
| Social Liberals | 6,125 | 13.48 | +6.41 | |||
| Green Left | 6,112 | 13.46 | -6.94 | |||
| Danish People's Party | 5,060 | 11.14 | -2.53 | |||
| Conservatives | 2,119 | 4.66 | -3.92 | |||
| Liberal Alliance | 2,051 | 4.52 | +0.90 | |||
| Christian Democrats | 176 | 0.39 | -0.21 | |||
| Klaus Trier Tuxen | 19 | 0.04 | New | |||
| Tom Gillesberg | 12 | 0.03 | +0.02 | |||
| Mads Vestergaard | 4 | 0.01 | New | |||
| John Erik Wagner | 3 | 0.01 | +0.01 | |||
| Morten Versner | 1 | 0.00 | New | |||
| Per Zimmermann | 1 | 0.00 | New | |||
| Total | 45,425 | |||||
| Source[12] | ||||||
General elections in the 2000s
| Parties | Vote | |||||
|---|---|---|---|---|---|---|
| Votes | % | + / - | ||||
| Social Democrats | 12,213 | 27.10 | +3.26 | |||
| Green Left | 9,194 | 20.40 | +11.37 | |||
| Danish People's Party | 6,159 | 13.67 | +0.98 | |||
| Venstre | 6,040 | 13.40 | -4.31 | |||
| Conservatives | 3,865 | 8.58 | -0.78 | |||
| Social Liberals | 3,188 | 7.07 | -8.22 | |||
| Red–Green Alliance | 2,495 | 5.54 | -3.65 | |||
| New Alliance | 1,633 | 3.62 | New | |||
| Christian Democrats | 269 | 0.60 | -0.67 | |||
| Tom Gillesberg | 4 | 0.01 | New | |||
| Nicolai Krogh Mittet | 2 | 0.00 | New | |||
| Amir Becirovic | 1 | 0.00 | New | |||
| Vibeke Baden Laursen | 1 | 0.00 | New | |||
| John Erik Wagner | 1 | 0.00 | New | |||
| Total | 45,065 | |||||
| Source[13] | ||||||
| Parties | Vote | |||||
|---|---|---|---|---|---|---|
| Votes | % | + / - | ||||
| Social Democrats | 6,460 | 23.84 | -4.44 | |||
| Venstre | 4,798 | 17.71 | -3.72 | |||
| Social Liberals | 4,142 | 15.29 | +6.18 | |||
| Danish People's Party | 3,439 | 12.69 | +0.25 | |||
| Conservatives | 2,537 | 9.36 | +1.44 | |||
| Red–Green Alliance | 2,491 | 9.19 | +4.26 | |||
| Green Left | 2,446 | 9.03 | -2.44 | |||
| Christian Democrats | 345 | 1.27 | -0.51 | |||
| Centre Democrats | 335 | 1.24 | -0.89 | |||
| Minority Party | 101 | 0.37 | New | |||
| Feride Istogu Gillesberg | 4 | 0.01 | New | |||
| Total | 27,098 | |||||
| Source[14] | ||||||
| Parties | Vote | |||||
|---|---|---|---|---|---|---|
| Votes | % | + / - | ||||
| Social Democrats | 7,918 | 28.28 | -7.75 | |||
| Venstre | 6,000 | 21.43 | +6.43 | |||
| Danish People's Party | 3,483 | 12.44 | +3.31 | |||
| Green Left | 3,213 | 11.47 | -0.62 | |||
| Social Liberals | 2,552 | 9.11 | +3.88 | |||
| Conservatives | 2,218 | 7.92 | -0.43 | |||
| Red–Green Alliance | 1,380 | 4.93 | -1.25 | |||
| Centre Democrats | 597 | 2.13 | -2.23 | |||
| Christian People's Party | 498 | 1.78 | -0.10 | |||
| Progress Party | 97 | 0.35 | -1.06 | |||
| Lars Hutters | 46 | 0.16 | New | |||
| Total | 28,002 | |||||
| Source[15] | ||||||
General elections in the 1990s
| Parties | Vote | |||||
|---|---|---|---|---|---|---|
| Votes | % | + / - | ||||
| Social Democrats | 10,047 | 36.03 | +1.23 | |||
| Venstre | 4,182 | 15.00 | +0.86 | |||
| Green Left | 3,371 | 12.09 | +0.01 | |||
| Danish People's Party | 2,545 | 9.13 | New | |||
| Conservatives | 2,328 | 8.35 | -7.02 | |||
| Red–Green Alliance | 1,722 | 6.18 | -0.51 | |||
| Social Liberals | 1,459 | 5.23 | -0.47 | |||
| Centre Democrats | 1,216 | 4.36 | +1.20 | |||
| Christian People's Party | 524 | 1.88 | +0.47 | |||
| Progress Party | 392 | 1.41 | -4.75 | |||
| Democratic Renewal | 96 | 0.34 | New | |||
| Total | 27,882 | |||||
| Source[16] | ||||||
| Parties | Vote | |||||
|---|---|---|---|---|---|---|
| Votes | % | + / - | ||||
| Social Democrats | 9,532 | 34.80 | -4.02 | |||
| Conservatives | 4,211 | 15.37 | -0.71 | |||
| Venstre | 3,873 | 14.14 | +6.27 | |||
| Green Left | 3,309 | 12.08 | -1.59 | |||
| Red–Green Alliance | 1,833 | 6.69 | +2.78 | |||
| Progress Party | 1,688 | 6.16 | +2.47 | |||
| Social Liberals | 1,561 | 5.70 | +2.16 | |||
| Centre Democrats | 865 | 3.16 | -2.30 | |||
| Christian People's Party | 387 | 1.41 | -0.01 | |||
| Villo Sigurdsson | 70 | 0.26 | New | |||
| Jørgen Tved | 47 | 0.17 | New | |||
| Birgitte Bjerring Sonneby | 17 | 0.06 | New | |||
| Total | 27,393 | |||||
| Source[17] | ||||||
| Parties | Vote | |||||
|---|---|---|---|---|---|---|
| Votes | % | + / - | ||||
| Social Democrats | 10,542 | 38.82 | +9.81 | |||
| Conservatives | 4,367 | 16.08 | -3.65 | |||
| Green Left | 3,713 | 13.67 | -7.81 | |||
| Venstre | 2,138 | 7.87 | +3.83 | |||
| Centre Democrats | 1,482 | 5.46 | +0.97 | |||
| Red–Green Alliance | 1,063 | 3.91 | New | |||
| Progress Party | 1,001 | 3.69 | -3.16 | |||
| Social Liberals | 961 | 3.54 | -2.36 | |||
| Common Course | 955 | 3.52 | +1.26 | |||
| Christian People's Party | 386 | 1.42 | +0.14 | |||
| The Greens | 352 | 1.30 | -0.59 | |||
| Justice Party of Denmark | 169 | 0.62 | New | |||
| Humanist Party | 16 | 0.06 | New | |||
| Abdul Wahid Pedersen | 8 | 0.03 | New | |||
| Annette Dybdal | 4 | 0.01 | New | |||
| Total | 27,157 | |||||
| Source[18] | ||||||
General elections in the 1980s
| Parties | Vote | |||||
|---|---|---|---|---|---|---|
| Votes | % | + / - | ||||
| Social Democrats | 8,304 | 29.01 | +1.54 | |||
| Green Left | 6,147 | 21.48 | -1.74 | |||
| Conservatives | 5,648 | 19.73 | +0.12 | |||
| Progress Party | 1,961 | 6.85 | +2.91 | |||
| Social Liberals | 1,689 | 5.90 | -0.75 | |||
| Centre Democrats | 1,284 | 4.49 | -0.25 | |||
| Venstre | 1,155 | 4.04 | +1.54 | |||
| Common Course | 646 | 2.26 | -0.24 | |||
| The Greens | 542 | 1.89 | -0.10 | |||
| Communist Party of Denmark | 468 | 1.64 | 0.00 | |||
| Left Socialists | 413 | 1.44 | -2.01 | |||
| Christian People's Party | 365 | 1.28 | -0.24 | |||
| Total | 28,622 | |||||
| Source[19] | ||||||
| Parties | Vote | |||||
|---|---|---|---|---|---|---|
| Votes | % | + / - | ||||
| Social Democrats | 7,969 | 27.47 | -5.98 | |||
| Green Left | 6,738 | 23.22 | +4.72 | |||
| Conservatives | 5,690 | 19.61 | -3.23 | |||
| Social Liberals | 1,929 | 6.65 | +1.01 | |||
| Centre Democrats | 1,374 | 4.74 | +0.86 | |||
| Progress Party | 1,143 | 3.94 | +1.36 | |||
| Left Socialists | 1,000 | 3.45 | -1.27 | |||
| Venstre | 726 | 2.50 | -1.17 | |||
| Common Course | 725 | 2.50 | New | |||
| The Greens | 576 | 1.99 | New | |||
| Communist Party of Denmark | 476 | 1.64 | +0.37 | |||
| Christian People's Party | 441 | 1.52 | -0.16 | |||
| Justice Party of Denmark | 143 | 0.49 | -1.22 | |||
| Humanist Party | 67 | 0.23 | New | |||
| Socialist Workers Party | 11 | 0.04 | -0.01 | |||
| Marxist–Leninists Party | 5 | 0.02 | 0.00 | |||
| Total | 29,013 | |||||
| Source[20] | ||||||
| Parties | Vote | |||||
|---|---|---|---|---|---|---|
| Votes | % | + / - | ||||
| Social Democrats | 10,305 | 33.45 | -0.52 | |||
| Conservatives | 7,036 | 22.84 | +7.44 | |||
| Green Left | 5,699 | 18.50 | +0.62 | |||
| Social Liberals | 1,736 | 5.64 | +0.60 | |||
| Left Socialists | 1,454 | 4.72 | -0.21 | |||
| Centre Democrats | 1,195 | 3.88 | -3.79 | |||
| Venstre | 1,131 | 3.67 | +0.96 | |||
| Progress Party | 794 | 2.58 | -4.48 | |||
| Justice Party of Denmark | 526 | 1.71 | +0.04 | |||
| Christian People's Party | 518 | 1.68 | +0.33 | |||
| Communist Party of Denmark | 390 | 1.27 | -0.77 | |||
| Socialist Workers Party | 16 | 0.05 | -0.02 | |||
| Marxist–Leninists Party | 7 | 0.02 | New | |||
| Total | 30,807 | |||||
| Source[21] | ||||||
| Parties | Vote | |||||
|---|---|---|---|---|---|---|
| Votes | % | + / - | ||||
| Social Democrats | 9,980 | 33.97 | -8.08 | |||
| Green Left | 5,252 | 17.88 | +9.00 | |||
| Conservatives | 4,525 | 15.40 | +1.52 | |||
| Centre Democrats | 2,254 | 7.67 | +4.93 | |||
| Progress Party | 2,074 | 7.06 | -0.83 | |||
| Social Liberals | 1,480 | 5.04 | -0.82 | |||
| Left Socialists | 1,447 | 4.93 | -0.92 | |||
| Venstre | 797 | 2.71 | -1.58 | |||
| Communist Party of Denmark | 599 | 2.04 | -1.09 | |||
| Justice Party of Denmark | 490 | 1.67 | -1.56 | |||
| Christian People's Party | 397 | 1.35 | -0.16 | |||
| Communist Workers Party | 62 | 0.21 | -0.45 | |||
| Socialist Workers Party | 22 | 0.07 | New | |||
| Total | 29,379 | |||||
| Source[22] | ||||||
General elections in the 1970s
| Parties | Vote | |||||
|---|---|---|---|---|---|---|
| Votes | % | + / - | ||||
| Social Democrats | 12,781 | 42.05 | -0.39 | |||
| Conservatives | 4,218 | 13.88 | +4.35 | |||
| Green Left | 2,700 | 8.88 | +2.93 | |||
| Progress Party | 2,399 | 7.89 | -3.03 | |||
| Social Liberals | 1,781 | 5.86 | +2.30 | |||
| Left Socialists | 1,777 | 5.85 | +1.93 | |||
| Venstre | 1,304 | 4.29 | +0.66 | |||
| Justice Party of Denmark | 983 | 3.23 | -0.84 | |||
| Communist Party of Denmark | 950 | 3.13 | -2.51 | |||
| Centre Democrats | 834 | 2.74 | -4.17 | |||
| Christian People's Party | 458 | 1.51 | -0.44 | |||
| Communist Workers Party | 201 | 0.66 | New | |||
| Leni Thomsen | 10 | 0.03 | New | |||
| Total | 30,396 | |||||
| Source[23] | ||||||
| Parties | Vote | |||||
|---|---|---|---|---|---|---|
| Votes | % | + / - | ||||
| Social Democrats | 13,407 | 42.44 | +9.24 | |||
| Progress Party | 3,449 | 10.92 | -1.02 | |||
| Conservatives | 3,010 | 9.53 | +2.89 | |||
| Centre Democrats | 2,183 | 6.91 | +5.01 | |||
| Green Left | 1,879 | 5.95 | -1.95 | |||
| Communist Party of Denmark | 1,781 | 5.64 | -0.87 | |||
| Justice Party of Denmark | 1,286 | 4.07 | +2.17 | |||
| Left Socialists | 1,239 | 3.92 | +0.55 | |||
| Venstre | 1,148 | 3.63 | -12.12 | |||
| Social Liberals | 1,123 | 3.56 | -3.35 | |||
| Christian People's Party | 617 | 1.95 | -1.98 | |||
| Pensioners' Party | 463 | 1.47 | New | |||
| Karen T. Christensen | 4 | 0.01 | New | |||
| Total | 31,589 | |||||
| Source[24] | ||||||
| Parties | Vote | |||||
|---|---|---|---|---|---|---|
| Votes | % | + / - | ||||
| Social Democrats | 10,838 | 33.20 | +5.02 | |||
| Venstre | 5,141 | 15.75 | +11.34 | |||
| Progress Party | 3,899 | 11.94 | -0.40 | |||
| Green Left | 2,579 | 7.90 | -2.22 | |||
| Social Liberals | 2,257 | 6.91 | -2.65 | |||
| Conservatives | 2,168 | 6.64 | -6.40 | |||
| Communist Party of Denmark | 2,124 | 6.51 | +0.30 | |||
| Christian People's Party | 1,282 | 3.93 | +1.37 | |||
| Left Socialists | 1,101 | 3.37 | +0.96 | |||
| Justice Party of Denmark | 621 | 1.90 | -1.45 | |||
| Centre Democrats | 619 | 1.90 | -5.89 | |||
| Birgit Busk | 13 | 0.04 | New | |||
| Total | 32,642 | |||||
| Source[25] | ||||||
| Parties | Vote | |||||
|---|---|---|---|---|---|---|
| Votes | % | + / - | ||||
| Social Democrats | 9,520 | 28.18 | -7.34 | |||
| Conservatives | 4,404 | 13.04 | -10.13 | |||
| Progress Party | 4,170 | 12.34 | New | |||
| Green Left | 3,419 | 10.12 | -5.52 | |||
| Social Liberals | 3,229 | 9.56 | -3.60 | |||
| Centre Democrats | 2,631 | 7.79 | New | |||
| Communist Party of Denmark | 2,098 | 6.21 | +4.18 | |||
| Venstre | 1,491 | 4.41 | -0.54 | |||
| Justice Party of Denmark | 1,131 | 3.35 | +1.79 | |||
| Christian People's Party | 864 | 2.56 | +1.47 | |||
| Left Socialists | 815 | 2.41 | -0.47 | |||
| Gunnar Skou | 11 | 0.03 | New | |||
| Total | 33,783 | |||||
| Source[26] | ||||||
| Parties | Vote | |||||
|---|---|---|---|---|---|---|
| Votes | % | + / - | ||||
| Social Democrats | 12,044 | 35.52 | -4.22 | |||
| Conservatives | 7,856 | 23.17 | -1.47 | |||
| Green Left | 5,304 | 15.64 | +6.23 | |||
| Social Liberals | 4,464 | 13.16 | -1.75 | |||
| Venstre | 1,680 | 4.95 | +1.12 | |||
| Left Socialists | 975 | 2.88 | -0.46 | |||
| Communist Party of Denmark | 688 | 2.03 | +0.22 | |||
| Justice Party of Denmark | 529 | 1.56 | +1.16 | |||
| Christian People's Party | 368 | 1.09 | New | |||
| Kaare Heistein Sørensen | 2 | 0.01 | New | |||
| Total | 33,910 | |||||
| Source[27] | ||||||
General elections in the 1960s
| Parties | Vote | |||||
|---|---|---|---|---|---|---|
| Votes | % | + / - | ||||
| Social Democrats | 19,935 | 39.74 | +2.29 | |||
| Conservatives | 12,361 | 24.64 | +0.77 | |||
| Social Liberals | 7,479 | 14.91 | +7.82 | |||
| Green Left | 4,720 | 9.41 | -10.05 | |||
| Venstre | 1,919 | 3.83 | -1.53 | |||
| Left Socialists | 1,677 | 3.34 | New | |||
| Communist Party of Denmark | 906 | 1.81 | +0.28 | |||
| Liberal Centre | 833 | 1.66 | -2.17 | |||
| Justice Party of Denmark | 200 | 0.40 | -0.03 | |||
| Independent Party | 118 | 0.24 | -0.75 | |||
| Kristine Heide | 12 | 0.02 | New | |||
| Total | 50,160 | |||||
| Source[28] | ||||||
| Parties | Vote | |||||
|---|---|---|---|---|---|---|
| Votes | % | + / - | ||||
| Social Democrats | 17,464 | 37.45 | -7.28 | |||
| Conservatives | 11,132 | 23.87 | -2.48 | |||
| Green Left | 9,077 | 19.46 | +8.98 | |||
| Social Liberals | 3,306 | 7.09 | +2.47 | |||
| Venstre | 2,498 | 5.36 | -2.81 | |||
| Liberal Centre | 1,784 | 3.83 | New | |||
| Communist Party of Denmark | 713 | 1.53 | -0.69 | |||
| Independent Party | 462 | 0.99 | -0.83 | |||
| Justice Party of Denmark | 199 | 0.43 | -0.35 | |||
| Total | 46,635 | |||||
| Source[29] | ||||||
| Parties | Vote | |||||
|---|---|---|---|---|---|---|
| Votes | % | + / - | ||||
| Social Democrats | 20,474 | 44.73 | -1.30 | |||
| Conservatives | 12,061 | 26.35 | +0.77 | |||
| Green Left | 4,797 | 10.48 | -1.07 | |||
| Venstre | 3,739 | 8.17 | +1.75 | |||
| Social Liberals | 2,115 | 4.62 | -0.35 | |||
| Communist Party of Denmark | 1,016 | 2.22 | +0.35 | |||
| Independent Party | 831 | 1.82 | -0.37 | |||
| Justice Party of Denmark | 358 | 0.78 | -0.62 | |||
| Peace Politics People's Party | 213 | 0.47 | New | |||
| Danish Unity | 170 | 0.37 | New | |||
| Total | 45,774 | |||||
| Source[30] | ||||||
| Parties | Vote | |||||
|---|---|---|---|---|---|---|
| Votes | % | + / - | ||||
| Social Democrats | 20,818 | 46.03 | +1.89 | |||
| Conservatives | 11,568 | 25.58 | +0.21 | |||
| Green Left | 5,225 | 11.55 | New | |||
| Venstre | 2,903 | 6.42 | -2.97 | |||
| Social Liberals | 2,247 | 4.97 | -3.25 | |||
| Independent Party | 990 | 2.19 | +0.77 | |||
| Communist Party of Denmark | 847 | 1.87 | -4.17 | |||
| Justice Party of Denmark | 632 | 1.40 | -4.01 | |||
| Total | 45,230 | |||||
| Source[31] | ||||||
General elections in the 1950s
| Parties | Vote | |||||
|---|---|---|---|---|---|---|
| Votes | % | + / - | ||||
| Social Democrats | 18,824 | 44.14 | -2.27 | |||
| Conservatives | 10,819 | 25.37 | -0.21 | |||
| Venstre | 4,006 | 9.39 | +2.94 | |||
| Social Liberals | 3,506 | 8.22 | +0.36 | |||
| Communist Party of Denmark | 2,577 | 6.04 | -2.56 | |||
| Justice Party of Denmark | 2,308 | 5.41 | +2.00 | |||
| Independent Party | 606 | 1.42 | -0.26 | |||
| Total | 42,646 | |||||
| Source[32] | ||||||
September 1953 Danish Folketing election
| Parties | Vote | |||||
|---|---|---|---|---|---|---|
| Votes | % | + / - | ||||
| Social Democrats | 18,051 | 46.41 | +0.90 | |||
| Conservatives | 9,950 | 25.58 | +1.12 | |||
| Communist Party of Denmark | 3,346 | 8.60 | -0.39 | |||
| Social Liberals | 3,059 | 7.86 | -1.16 | |||
| Venstre | 2,510 | 6.45 | +1.71 | |||
| Justice Party of Denmark | 1,326 | 3.41 | -2.83 | |||
| Independent Party | 652 | 1.68 | New | |||
| Total | 38,894 | |||||
| Source[33] | ||||||
April 1953 Danish Folketing election
| Parties | Vote | |||||
|---|---|---|---|---|---|---|
| Votes | % | + / - | ||||
| Social Democrats | 17,266 | 45.51 | +0.13 | |||
| Conservatives | 9,280 | 24.46 | -0.13 | |||
| Social Liberals | 3,422 | 9.02 | +1.16 | |||
| Communist Party of Denmark | 3,410 | 8.99 | +0.02 | |||
| Justice Party of Denmark | 2,368 | 6.24 | -4.26 | |||
| Venstre | 1,798 | 4.74 | +2.04 | |||
| Danish Unity | 393 | 1.04 | New | |||
| Total | 37,937 | |||||
| Source[34] | ||||||
1950 Danish Folketing election
| Parties | Vote | |||||
|---|---|---|---|---|---|---|
| Votes | % | + / - | ||||
| Social Democrats | 17,030 | 45.38 | ||||
| Conservatives | 9,229 | 24.59 | ||||
| Justice Party of Denmark | 3,942 | 10.50 | ||||
| Communist Party of Denmark | 3,368 | 8.97 | ||||
| Social Liberals | 2,948 | 7.86 | ||||
| Venstre | 1,013 | 2.70 | ||||
| Total | 37,530 | |||||
| Source[35] | ||||||
European Parliament elections results
2019 European Parliament election in Denmark
| Parties | Vote | |||||
|---|---|---|---|---|---|---|
| Votes | % | + / - | ||||
| Green Left | 8,530 | 22.95 | +3.28 | |||
| Social Democrats | 6,704 | 18.03 | -2.70 | |||
| Social Liberals | 5,464 | 14.70 | +4.65 | |||
| Red–Green Alliance | 4,026 | 10.83 | New | |||
| Venstre | 3,826 | 10.29 | +2.00 | |||
| Danish People's Party | 2,494 | 6.71 | -12.69 | |||
| The Alternative | 2,036 | 5.48 | New | |||
| Conservatives | 1,926 | 5.18 | -0.67 | |||
| People's Movement against the EU | 1,605 | 4.32 | -8.99 | |||
| Liberal Alliance | 562 | 1.51 | -1.19 | |||
| Total | 37,173 | |||||
| Source[36] | ||||||
2014 European Parliament election in Denmark
| Parties | Vote | |||||
|---|---|---|---|---|---|---|
| Votes | % | + / - | ||||
| Social Democrats | 6,282 | 20.73 | -0.35 | |||
| Green Left | 5,960 | 19.67 | -3.57 | |||
| Danish People's Party | 5,877 | 19.40 | +5.60 | |||
| People's Movement against the EU | 4,033 | 13.31 | +0.27 | |||
| Social Liberals | 3,046 | 10.05 | +3.32 | |||
| Venstre | 2,512 | 8.29 | -1.90 | |||
| Conservatives | 1,771 | 5.85 | -1.72 | |||
| Liberal Alliance | 817 | 2.70 | +2.00 | |||
| Total | 30,298 | |||||
| Source[37] | ||||||
2009 European Parliament election in Denmark
| Parties | Vote | |||||
|---|---|---|---|---|---|---|
| Votes | % | + / - | ||||
| Green Left | 7,201 | 23.24 | +9.52 | |||
| Social Democrats | 6,533 | 21.08 | -9.88 | |||
| Danish People's Party | 4,276 | 13.80 | +7.46 | |||
| People's Movement against the EU | 4,042 | 13.04 | +3.97 | |||
| Venstre | 3,157 | 10.19 | +0.91 | |||
| Conservatives | 2,345 | 7.57 | -1.40 | |||
| Social Liberals | 2,086 | 6.73 | -3.09 | |||
| June Movement | 1,134 | 3.66 | -7.36 | |||
| Liberal Alliance | 217 | 0.70 | New | |||
| Total | 30,991 | |||||
| Source[38] | ||||||
2004 European Parliament election in Denmark
| Parties | Vote | |||||
|---|---|---|---|---|---|---|
| Votes | % | + / - | ||||
| Social Democrats | 5,177 | 30.96 | +16.27 | |||
| Green Left | 2,294 | 13.72 | +2.25 | |||
| June Movement | 1,842 | 11.02 | -9.10 | |||
| Social Liberals | 1,642 | 9.82 | -0.94 | |||
| Venstre | 1,551 | 9.28 | -3.68 | |||
| People's Movement against the EU | 1,516 | 9.07 | -1.79 | |||
| Conservatives | 1,500 | 8.97 | +2.06 | |||
| Danish People's Party | 1,060 | 6.34 | -1.07 | |||
| Christian Democrats | 137 | 0.82 | -0.42 | |||
| Total | 16,719 | |||||
| Source[39] | ||||||
1999 European Parliament election in Denmark
| Parties | Vote | |||||
|---|---|---|---|---|---|---|
| Votes | % | + / - | ||||
| June Movement | 3,513 | 20.12 | -0.90 | |||
| Social Democrats | 2,565 | 14.69 | +0.47 | |||
| Venstre | 2,262 | 12.96 | +3.39 | |||
| Green Left | 2,003 | 11.47 | -0.56 | |||
| People's Movement against the EU | 1,895 | 10.86 | -4.11 | |||
| Social Liberals | 1,879 | 10.76 | +1.93 | |||
| Danish People's Party | 1,293 | 7.41 | New | |||
| Conservatives | 1,206 | 6.91 | -8.05 | |||
| Centre Democrats | 624 | 3.57 | +2.50 | |||
| Christian Democrats | 217 | 1.24 | +0.51 | |||
| Progress Party | 88 | 0.50 | -2.10 | |||
| Total | 17,457 | |||||
| Source[40] | ||||||
1994 European Parliament election in Denmark
| Parties | Vote | |||||
|---|---|---|---|---|---|---|
| Votes | % | + / - | ||||
| June Movement | 3,861 | 21.02 | New | |||
| People's Movement against the EU | 2,751 | 14.97 | -14.97 | |||
| Conservatives | 2,748 | 14.96 | +3.45 | |||
| Social Democrats | 2,612 | 14.22 | -7.34 | |||
| Green Left | 2,211 | 12.03 | -2.44 | |||
| Venstre | 1,759 | 9.57 | +2.70 | |||
| Social Liberals | 1,622 | 8.83 | +5.98 | |||
| Progress Party | 478 | 2.60 | -1.50 | |||
| Centre Democrats | 196 | 1.07 | -6.01 | |||
| Christian Democrats | 134 | 0.73 | -0.90 | |||
| Total | 18,372 | |||||
| Source[41] | ||||||
1989 European Parliament election in Denmark
| Parties | Vote | |||||
|---|---|---|---|---|---|---|
| Votes | % | + / - | ||||
| People's Movement against the EU | 5,187 | 29.94 | +0.41 | |||
| Social Democrats | 3,735 | 21.56 | +1.66 | |||
| Green Left | 2,506 | 14.47 | +0.43 | |||
| Conservatives | 1,994 | 11.51 | -6.94 | |||
| Centre Democrats | 1,226 | 7.08 | +1.63 | |||
| Venstre | 1,190 | 6.87 | +4.17 | |||
| Progress Party | 711 | 4.10 | +0.64 | |||
| Social Liberals | 493 | 2.85 | +0.56 | |||
| Christian Democrats | 282 | 1.63 | -0.14 | |||
| Total | 17,324 | |||||
| Source[42] | ||||||
1984 European Parliament election in Denmark
| Parties | Vote | |||||
|---|---|---|---|---|---|---|
| Votes | % | |||||
| People's Movement against the EU | 5,797 | 29.53 | ||||
| Social Democrats | 3,907 | 19.90 | ||||
| Conservatives | 3,622 | 18.45 | ||||
| Green Left | 2,756 | 14.04 | ||||
| Centre Democrats | 1,071 | 5.45 | ||||
| Progress Party | 680 | 3.46 | ||||
| Venstre | 531 | 2.70 | ||||
| Left Socialists | 474 | 2.41 | ||||
| Social Liberals | 449 | 2.29 | ||||
| Christian Democrats | 347 | 1.77 | ||||
| Total | 19,634 | |||||
| Source[43] | ||||||
Referendums
2022 Danish European Union opt-out referendum[44]
| Option | Votes | % |
|---|---|---|
| ✓ YES | 22,649 | 67.20 |
| X NO | 11,053 | 32.80 |
2015 Danish European Union opt-out referendum[45]
| Option | Votes | % |
|---|---|---|
| X NO | 19,085 | 52.54 |
| ✓ YES | 17,239 | 47.46 |
2014 Danish Unified Patent Court membership referendum[46]
| Option | Votes | % |
|---|---|---|
| ✓ YES | 16,820 | 57.08 |
| X NO | 12,646 | 42.92 |
2009 Danish Act of Succession referendum[47]
| Option | Votes | % |
|---|---|---|
| ✓ YES | 21,980 | 83.93 |
| X NO | 4,208 | 16.07 |
2000 Danish euro referendum[48]
| Option | Votes | % |
|---|---|---|
| X NO | 15,911 | 56.77 |
| ✓ YES | 12,114 | 43.23 |
1998 Danish Amsterdam Treaty referendum[49]
| Option | Votes | % |
|---|---|---|
| X NO | 12,854 | 51.91 |
| ✓ YES | 11,909 | 48.09 |
1993 Danish Maastricht Treaty referendum[50]
| Option | Votes | % |
|---|---|---|
| X NO | 14,957 | 52.77 |
| ✓ YES | 13,389 | 47.23 |
1992 Danish Maastricht Treaty referendum[51]
| Option | Votes | % |
|---|---|---|
| X NO | 16,467 | 59.75 |
| ✓ YES | 11,094 | 40.25 |
1986 Danish Single European Act referendum[52]
| Option | Votes | % |
|---|---|---|
| X NO | 15,270 | 58.69 |
| ✓ YES | 10,747 | 41.31 |
1972 Danish European Communities membership referendum[53]
| Option | Votes | % |
|---|---|---|
| ✓ YES | 19,711 | 55.71 |
| X NO | 15,672 | 44.29 |
1953 Danish constitutional and electoral age referendum[54]
| Option | Votes | % |
|---|---|---|
| ✓ YES | 20,104 | 73.53 |
| X NO | 7,237 | 26.47 |
| 21 years | 14,083 | 50.29 |
| 23 years | 13,922 | 49.71 |
References
- "Brønshøjkredsen". kmdvalg.dk (in Danish). Retrieved 2023-06-08.
- "Forslag til Lov om Valg til Rigsdagen". Rigsdagstidende. 1947–48: Tillæg C, spalte 1777 ff.
- "Nye valgkredse fordeler stemmerne anderledes". dr.dk (in Danish). Retrieved 2023-06-08.
- "Beretning om nye valgkredse som følge af kommunalreformen" (in Danish). Retrieved 2023-06-08.
- "Det danske valgsystem: Valg til Folketinget". valg.im (in Danish). Retrieved 2023-06-08.
- "7 Brønshøj". dataforsyningen.dk (in Danish). Retrieved 2023-06-08.
- "Forslag til Lov om Valg til Rigsdagen". Rigsdagstidende. 1947–48: Tillæg C, spalte 1777 ff.
- "Valgresultater fra tidligere valg:". kmdvalg (in Danish). Retrieved 2023-06-08.
- "FOLKETINGSVALG TIRSDAG 1. NOVEMBER 2022". valg.im (in Danish). Retrieved 2023-06-27.
- "FOLKETINGSVALG ONSDAG 5. JUNI 2019". valg.im (in Danish). Retrieved 2023-06-27.
- "FOLKETINGSVALG TORSDAG 18. JUNI 2015". valg.im (in Danish). Retrieved 2023-06-27.
- "FOLKETINGSVALG TORSDAG 15. SEPTEMBER 2011". valg.im (in Danish). Retrieved 2023-06-27.
- "Folketingsvalget den 13. november 2007". valg.im (in Danish). Retrieved 2023-06-27.
- "valg2005.book" (PDF). valg.im (in Danish). Retrieved 2023-06-27.
- "BMTABEL" (PDF). valg.im (in Danish). Retrieved 2023-06-27.
- "VALG98" (PDF). valg.im (in Danish). Retrieved 2023-06-27.
- "VALG94" (PDF). valg.im (in Danish). Retrieved 2023-06-27.
- "VALG90" (PDF). valg.im (in Danish). Retrieved 2023-06-27.
- "Folketingsvalget den 10. maj 1988". valg.im (in Danish). Retrieved 2023-06-27.
- "Folketingsvalget den 8.september 1987". dst.dk (in Danish). Retrieved 2023-06-27.
- "Folketingsvalget den 10. januar 1984". dst.dk (in Danish). Retrieved 2023-06-27.
- "Folketingsvalget den 8. december 1981". dst.dk (in Danish). Retrieved 2023-06-27.
- "Folketingsvalget den 23. oktober 1979". dst.dk (in Danish). Retrieved 2023-06-27.
- "Folketingsvalget den 15. februar 1977". dst.dk (in Danish). Retrieved 2023-06-27.
- "Folketingsvalget den 9. januar 1975". dst.dk (in Danish). Retrieved 2023-06-27.
- "Folketingsvalget den 4. december 1973". dst.dk (in Danish). Retrieved 2023-06-27.
- "Folketingsvalget den 21. september 1971 samt folkeafstemningen". dst.dk (in Danish). Retrieved 2023-06-27.
- "Folketingsvalget den 23. januar 1968". dst.dk (in Danish). Retrieved 2023-06-27.
- "Folketingsvalget den 22. november 1966". dst.dk (in Danish). Retrieved 2023-06-27.
- "Folketingsvalget den 22. september 1964". dst.dk (in Danish). Retrieved 2023-06-27.
- "Folketingsvalget den 15. november 1960". dst.dk (in Danish). Retrieved 2023-06-27.
- "Folketingsvalget den 14. maj 1957". dst.dk (in Danish). Retrieved 2023-06-27.
- "Folketingsvalget den 22. september 1953". dst.dk (in Danish). Retrieved 2023-06-27.
- "Rigsdagsvalgene og folkeafstemningerne i april og maj 1953". dst.dk (in Danish). Retrieved 2023-06-27.
- "Folketingsvalget den 5. september 1950". dst.dk (in Danish). Retrieved 2023-06-27.
- "EUROPA-PARLAMENTSVALG SØNDAG 26. MAJ 2019". dst.dk (in Danish). Retrieved 2023-07-01.
- "EUROPA-PARLAMENTSVALG SØNDAG 25. MAJ 2014". dst.dk (in Danish). Retrieved 2023-07-01.
- "EUROPA-PARLAMENTSVALG SØNDAG 7. JUNI 2009". dst.dk (in Danish). Retrieved 2023-07-01.
- "EUROPA-PARLAMENTSVALGET DEN 13. JUNI 2004" (PDF). im.dk (in Danish). Retrieved 2023-07-01.
- "VALGET TIL EUROPA-PARLAMENTET DEN 10. JUNI 1999" (PDF). im.dk (in Danish). Retrieved 2023-07-01.
- "VALGET TIL EUROPA-PARLAMENTET DEN 9. JUNI 1994" (PDF). im.dk (in Danish). Retrieved 2023-07-01.
- "Valget til Europa-parlamentet den 15. juni 1989". dst.dk (in Danish). Retrieved 2023-07-01.
- "Valget til Europa-Parlamentet den 14. juni 1984". dst.dk (in Danish). Retrieved 2023-07-01.
- "FOLKEAFSTEMNING ONSDAG 1. JUNI 2022". dst.dk (in Danish). Retrieved 2023-07-05.
- "FOLKEAFSTEMNING TORSDAG 3. DECEMBER 2015". dst.dk (in Danish). Retrieved 2023-07-05.
- "FOLKEAFSTEMNING SØNDAG 25. MAJ 2014". dst.dk (in Danish). Retrieved 2023-07-05.
- "FOLKEAFSTEMNING SØNDAG 7. JUNI 2009". dst.dk (in Danish). Retrieved 2023-07-05.
- "FOLKEAFSTEMNINGEN DEN 28. SEPTEMBER 2000 OM DANMARKS DELTAGELSE I DEN FÆLLES VALUTA" (PDF). valg.im (in Danish). Retrieved 2023-07-05.
- "FOLKEAFSTEMNINGEN DEN 28. MAJ 1998OM DANMARKS TILTRÆDELSE AF AMSTERDAMTRAKTATEN" (PDF). valg.im (in Danish). Retrieved 2023-07-05.
- "FOLKEAFSTEMNINGEN DEN 18. MAJ 1993 OM DANMARKS TILTRÆDELSE AF EDINBURGH-AFGØRELSEN OG MAASTRICHT-TRAKTATEN". dst.dk (in Danish). Retrieved 2023-07-05.
- "Folkeafstemningen den 1. juni 1992 om Danmarks tiltrædelse af traktaten om Den Europæiske Union". dst.dk (in Danish). Retrieved 2023-07-05.
- "Vejledende folkeafstemning torsdag den 27. februar 1986 om Danmarks tiltrædelse af EF- pakken". dst.dk (in Danish). Retrieved 2023-07-05.
- "Folkeafstemningen om Danmarks tiltrædelse af De europæiske Fælleskaber 2. oktober 1972". dst.dk (in Danish). Retrieved 2023-07-05.
- "Publikationsfortegnelse vedrørende Folkeafstemninger". dst.dk (in Danish). Retrieved 2023-07-05.