Buckinghamshire County Council elections
Buckinghamshire County Council in England was elected every four years from 1973 until 2020.[1]
Political control
From 1973 until its merger into Buckinghamshire Council in 2020, political control of the council was consistently held by the Conservative party:[2]
| Party in control | Years | |
|---|---|---|
| Conservative | 1973–2020 | |
In the 1993 elections, it was the only county council to have elected a majority of Conservative councillors, while the party lost majorities on strongholds such as Essex, Kent and Lincolnshire.
Leadership
The leaders of the council from 2001 until its abolition in 2020 were:[3]
| Councillor | Party | From | To | |
|---|---|---|---|---|
| David Shakespeare | Conservative | 28 Jun 2001 | 26 May 2011 | |
| Martin Tett | Conservative | 26 May 2011 | 31 Mar 2020 | |
Martin Tett subsequently became first leader of the replacement Buckinghamshire Council in 2020.
Council elections
- 1973 Buckinghamshire County Council election
- 1977 Buckinghamshire County Council election
- 1981 Buckinghamshire County Council election
- 1985 Buckinghamshire County Council election
- 1989 Buckinghamshire County Council election
- 1993 Buckinghamshire County Council election
- 1997 Buckinghamshire County Council election
- 2001 Buckinghamshire County Council election
- 2005 Buckinghamshire County Council election (boundary changes increased the number of seats by 2)[4]
- 2009 Buckinghamshire County Council election
- 2013 Buckinghamshire County Council election
- 2017 Buckinghamshire County Council election
County result maps
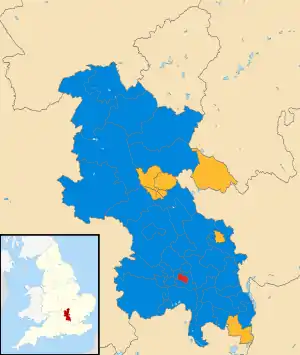
 2005 results map
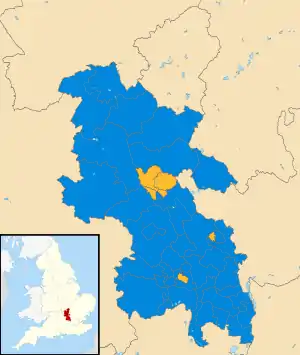
 2009 results map
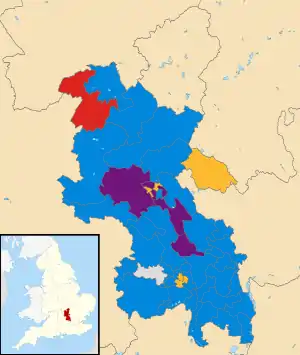
 2013 results map
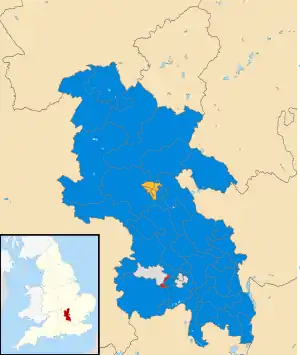
 2017 results map
By-election results
1997-2001
| Party | Candidate | Votes | % | ±% | |
|---|---|---|---|---|---|
| Conservative | David Graves | 1,232 | 57.4 | +8.8 | |
| Liberal Democrats | Eileen Young | 505 | 23.5 | +23.5 | |
| Labour | Ian Chapman | 410 | 19.1 | -10.2 | |
| Majority | 727 | 33.9 | |||
| Turnout | 2,147 | 33.4 | |||
| Conservative hold | Swing | ||||
| Party | Candidate | Votes | % | ±% | |
|---|---|---|---|---|---|
| Conservative | Marion Clayton | 1,211 | 55.8 | +4.0 | |
| Liberal Democrats | Robert Hammond | 958 | 44.2 | +10.3 | |
| Majority | 253 | 11.6 | |||
| Turnout | 2,169 | 39.0 | |||
| Conservative hold | Swing | ||||
| Party | Candidate | Votes | % | ±% | |
|---|---|---|---|---|---|
| Labour | Caroline Martnes | 579 | 61.3 | +15.9 | |
| Conservative | Frank Downes | 266 | 28.2 | -1.2 | |
| Liberal Democrats | Matthew Brown | 99 | 10.5 | -14.7 | |
| Majority | 313 | 33.1 | |||
| Turnout | 944 | 17.6 | |||
| Labour hold | Swing | ||||
2001-2005
| Party | Candidate | Votes | % | ±% | |
|---|---|---|---|---|---|
| Conservative | Peter Hardy | 933 | 77.1 | +13.9 | |
| Liberal Democrats | Peter Chapman | 277 | 22.9 | -2.7 | |
| Majority | 656 | 54.2 | |||
| Turnout | 1,210 | 22.2 | |||
| Conservative hold | Swing | ||||
| Party | Candidate | Votes | % | ±% | |
|---|---|---|---|---|---|
| Conservative | Hedley Cadd | 1,098 | 51.1 | +7.6 | |
| Labour | Robin Stuchbury | 559 | 26.0 | -2.6 | |
| Liberal Democrats | Ian Metherell | 491 | 22.8 | -5.1 | |
| Majority | 539 | 25.1 | |||
| Turnout | 2,148 | 19.4 | |||
| Conservative hold | Swing | ||||
2005-2009
| Party | Candidate | Votes | % | ±% | |
|---|---|---|---|---|---|
| Conservative | Peter Cartwright | 1,277 | 61.0 | +13.6 | |
| Liberal Democrats | Trevor Snaith | 596 | 28.5 | -2.1 | |
| Labour | Clare Martens | 221 | 10.5 | -11.5 | |
| Majority | 681 | 32.5 | |||
| Turnout | 2,094 | 20.5 | |||
| Conservative hold | Swing | ||||
| Party | Candidate | Votes | % | ±% | |
|---|---|---|---|---|---|
| Conservative | Trevor Egleton | 875 | 57.3 | -4.8 | |
| Independent | William Foulds | 283 | 18.5 | +18.5 | |
| Liberal Democrats | Ingrid Greenhow | 280 | 18.3 | -1.8 | |
| Labour | Lindsey Gillan | 89 | 5.8 | -11.9 | |
| Majority | 592 | 38.8 | |||
| Turnout | 1,527 | 23.8 | |||
| Conservative hold | Swing | ||||
2009-2013
| Party | Candidate | Votes | % | ±% | |
|---|---|---|---|---|---|
| Conservative | Steven Adams | 1,840 | 46.6 | -3.7 | |
| Liberal Democrats | Davida Allen | 1,768 | 44.8 | +0.0 | |
| UKIP | Christopher Cooke | 140 | 3.5 | +3.5 | |
| Labour | Lynda Greenhill | 106 | 2.7 | -2.2 | |
| Green | Phil Folly | 95 | 2.4 | +2.4 | |
| Majority | 72 | 1.8 | |||
| Turnout | 3,949 | 30.6 | |||
| Conservative hold | Swing | ||||
References
- "Today is the day 5 councils become one - everything you need to know". Bucks Free Press. 1 April 2020. Retrieved 7 April 2020.
- "Buckinghamshire". BBC News Online. 19 April 2009. Retrieved 10 September 2009.
- "Council minutes". Buckinghamshire Council. Retrieved 6 June 2022.
- "Local election results: Buckinghamshire". BBC News Online. Retrieved 6 September 2009.
- "Declaration of result of poll" (PDF). South Bucks District Council. Archived from the original (PDF) on 27 September 2011. Retrieved 6 September 2009.
- "Tories take seats". Buckingham & Winslow Advertiser. 25 November 2004.
- "Election results for Ryemead, Tylers Green & Loudwater". Buckinghamshire County Council. Archived from the original on 4 June 2011. Retrieved 6 September 2009.
- "Election results for Stoke Poges & Farnham Common". Buckinghamshire County Council. Archived from the original on 4 June 2011. Retrieved 6 September 2009.
- "Election results for Amersham". Buckinghamshire County Council. Archived from the original on 4 June 2011. Retrieved 25 September 2009.
- By-election results Archived 29 March 2010 at the Wayback Machine
External links
This article is issued from Wikipedia. The text is licensed under Creative Commons - Attribution - Sharealike. Additional terms may apply for the media files.