Bungotakada, Ōita
Bungotakada (豊後高田市, Bungotakada-shi) is a city located in Ōita Prefecture, Kyushu, Japan. As of March 31, 2017, the city has an estimated population of 23,059, with 10,595 households and a population density of 110 persons per km².[1] The total area is 206.65 km².
Bungotakada
豊後高田市 | |
|---|---|
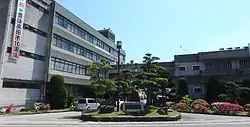 Bungotakada city hall | |
 Flag  Emblem | |
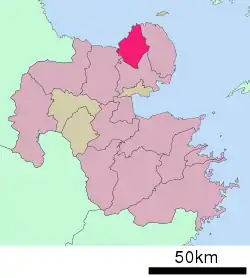 Location of Bungotakada in Ōita Prefecture | |
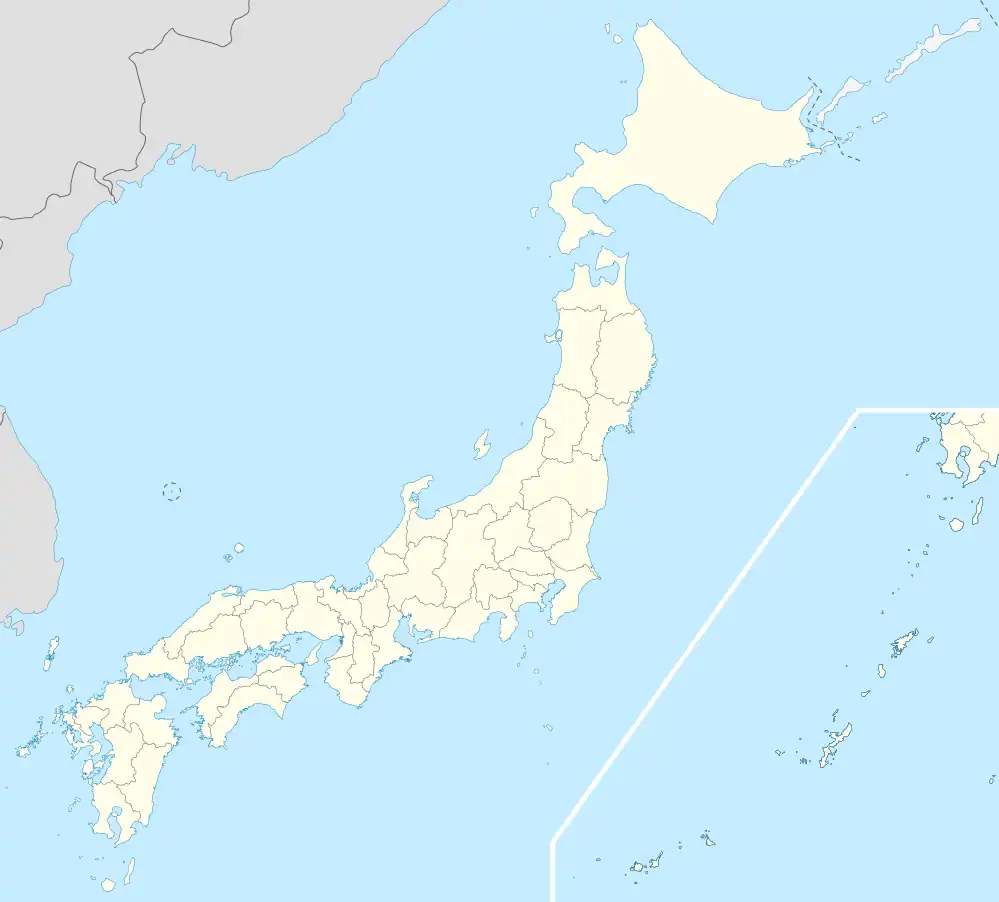 Bungotakada Location in Japan | |
| Coordinates: 33°33′N 131°27′E | |
| Country | Japan |
| Region | Kyushu |
| Prefecture | Ōita Prefecture |
| Government | |
| • Mayor | Katsuji Shutō (since April 2009) |
| Area | |
| • Total | 206.65 km2 (79.79 sq mi) |
| Population (March 31, 2017) | |
| • Total | 23,059 |
| • Density | 110/km2 (290/sq mi) |
| Time zone | UTC+09:00 (JST) |
| City hall address | 1650 Ōji-Aiai, Bungotakada-shi, Ōita-ken 878-8555 |
| Climate | Cfa |
| Website | www |
| Symbols | |
| Flower | Cosmos |
| Tree | Diospyros kaki |
On March 31, 2005, the towns of Kakaji and Matama (both from Nishikunisaki District) were merged into Bungotakada.
Geography
Climate
Bungotakada has a humid subtropical climate (Köppen climate classification Cfa) with hot summers and cool winters. Precipitation is significant throughout the year, but is somewhat lower in winter. The average annual temperature in Bungotakada is 15.9 °C (60.6 °F). The average annual rainfall is 1,992.2 mm (78.43 in) with June as the wettest month. The temperatures are highest on average in August, at around 24.5 °C (76.1 °F), and lowest in January, at around 2.3 °C (36.1 °F).[2] The highest temperature ever recorded in Bungotakada was 37.4 °C (99.3 °F) on 17 July 1994; the coldest temperature ever recorded was −6.9 °C (19.6 °F) on 3 February 2012.[3]
| Climate data for Bungotakada (1991−2020 normals, extremes 1977−present) | |||||||||||||
|---|---|---|---|---|---|---|---|---|---|---|---|---|---|
| Month | Jan | Feb | Mar | Apr | May | Jun | Jul | Aug | Sep | Oct | Nov | Dec | Year |
| Record high °C (°F) | 18.9 (66.0) |
24.5 (76.1) |
27.2 (81.0) |
29.7 (85.5) |
32.2 (90.0) |
34.5 (94.1) |
37.4 (99.3) |
36.9 (98.4) |
35.2 (95.4) |
32.4 (90.3) |
27.9 (82.2) |
26.3 (79.3) |
37.4 (99.3) |
| Average high °C (°F) | 9.3 (48.7) |
10.3 (50.5) |
13.8 (56.8) |
19.1 (66.4) |
23.8 (74.8) |
26.8 (80.2) |
30.8 (87.4) |
32.0 (89.6) |
28.0 (82.4) |
22.9 (73.2) |
17.4 (63.3) |
11.8 (53.2) |
20.5 (68.9) |
| Daily mean °C (°F) | 5.3 (41.5) |
6.0 (42.8) |
9.1 (48.4) |
13.9 (57.0) |
18.6 (65.5) |
22.3 (72.1) |
26.3 (79.3) |
27.3 (81.1) |
23.6 (74.5) |
18.2 (64.8) |
12.8 (55.0) |
7.6 (45.7) |
15.9 (60.6) |
| Average low °C (°F) | 1.1 (34.0) |
1.6 (34.9) |
4.2 (39.6) |
8.7 (47.7) |
13.7 (56.7) |
18.7 (65.7) |
22.9 (73.2) |
23.6 (74.5) |
19.9 (67.8) |
13.8 (56.8) |
8.2 (46.8) |
3.2 (37.8) |
11.6 (53.0) |
| Record low °C (°F) | −5.5 (22.1) |
−6.9 (19.6) |
−4.6 (23.7) |
−0.5 (31.1) |
4.4 (39.9) |
10.0 (50.0) |
15.2 (59.4) |
17.1 (62.8) |
8.2 (46.8) |
3.1 (37.6) |
−0.7 (30.7) |
−4.2 (24.4) |
−6.9 (19.6) |
| Average precipitation mm (inches) | 47.8 (1.88) |
61.9 (2.44) |
93.3 (3.67) |
103.8 (4.09) |
119.2 (4.69) |
260.8 (10.27) |
251.4 (9.90) |
132.7 (5.22) |
169.3 (6.67) |
94.6 (3.72) |
63.8 (2.51) |
49.3 (1.94) |
1,457.4 (57.38) |
| Average precipitation days (≥ 1.0 mm) | 6.6 | 8.0 | 9.9 | 9.8 | 8.9 | 13.0 | 11.2 | 8.9 | 9.8 | 6.4 | 7.7 | 6.8 | 107 |
| Mean monthly sunshine hours | 138.7 | 143.8 | 177.9 | 201.2 | 212.9 | 149.4 | 194.9 | 225.0 | 166.9 | 175.0 | 147.1 | 132.8 | 2,059.6 |
| Source: Japan Meteorological Agency[3][2] | |||||||||||||
Demographics
Per Japanese census data, the population of Bungotakada in 2020 is 22,112 people.[4] Bungotakada has been conducting censuses since 1950.
| Year | Pop. | ±% |
|---|---|---|
| 1950 | 49,214 | — |
| 1955 | 47,324 | −3.8% |
| 1960 | 43,381 | −8.3% |
| 1965 | 37,811 | −12.8% |
| 1970 | 33,561 | −11.2% |
| 1975 | 31,527 | −6.1% |
| 1980 | 30,705 | −2.6% |
| 1985 | 29,812 | −2.9% |
| 1990 | 28,798 | −3.4% |
| 1995 | 27,337 | −5.1% |
| 2000 | 26,206 | −4.1% |
| 2005 | 25,114 | −4.2% |
| 2010 | 23,918 | −4.8% |
| 2015 | 22,853 | −4.5% |
| 2020 | 22,112 | −3.2% |
| Bungotakada population statistics[4] | ||
Agriculture
Bungotakada is known for negi (Welsh onions).
Points of interest
Historic sites include Fuki-ji, Maki Ōdō, and Kumano magaibutsu.Shōwa Town (Shōwa no Machi in Japanese) is also a sightseeing spot.
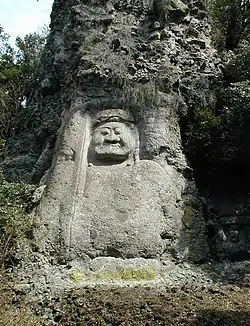 Fudō-Myoō Stature in Kumano Magaibutsu
 Shōwa Style Town Visitor Attraction (Shōwa no Machi in Japanese) in Bungotakada.
References
- "Official website of Bungotakada city" (in Japanese). Japan: Bungotakada City. Retrieved 21 April 2017.
- 気象庁 / 平年値(年・月ごとの値). JMA. Retrieved April 28, 2022.
- 観測史上1~10位の値(年間を通じての値). JMA. Retrieved April 28, 2022.
- Bungotakada population statistics
External links
- Bungotakada City official website (in Japanese)