Central Fife (UK Parliament constituency)
Central Fife was a parliamentary constituency represented in the House of Commons of the Parliament of the United Kingdom from February 1974 until 2005, when it was largely replaced by the new Glenrothes constituency, with a small portion joining the expanded North East Fife.
| Central Fife | |
|---|---|
| Former County constituency for the House of Commons | |
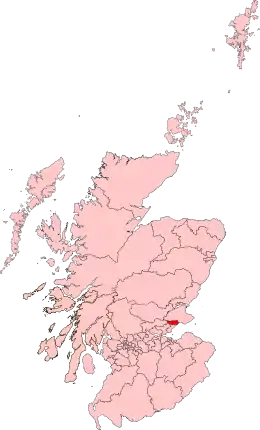
 Boundary of Central Fife in Scotland for the 2001 general election | |
| Subdivisions of Scotland | Fife |
| 1974–2005 | |
| Created from | West Fife |
| Replaced by | Glenrothes North East Fife |
It elected one Member of Parliament (MP), using the first-past-the-post voting system.
Boundaries
1974–1983
The burghs of Cowdenbeath, Leslie, Lochgelly, and Markinch, the districts of Glenrothes and Lochgelly, and the electoral divisions of Markinch North and Markinch South in the district of Kirkcaldy.[1]
1983–1997
The Kirkcaldy District electoral divisions of:
- Denbeath/Aberhill
- Mountfleurie/Methilhill/Methil North
- Leven
- Kennoway/Windygates
- Leslie/Markinch Star
- Auchmuty/Woodside
- Pitteuchar/Stenton/Balgonie
- South Parks/Rimbleton
- Southwood/Caskieberran
1997–2005
The Kirkcaldy District electoral divisions of:
- Methil, Denbeath and Muiredge
- Methilhill and Mountfleurie
- Leven
- Kennoway and Windygates
- Markinch, Pitcoudie and Star
- Auchmuty, Woodside and Coaltown of Balgonie
- Pitleuchar and Stenton
- Rimbleton and South Parks
- Glenwood and Newcastle
- Leslie and Collydean
Members of Parliament
| Election | Member [2] | Party | |
|---|---|---|---|
| Feb 1974 | Willie Hamilton | Labour | |
| 1987 | Henry McLeish | Labour | |
| 2001 | John MacDougall | Labour | |
| 2005 | constituency abolished | ||
Elections

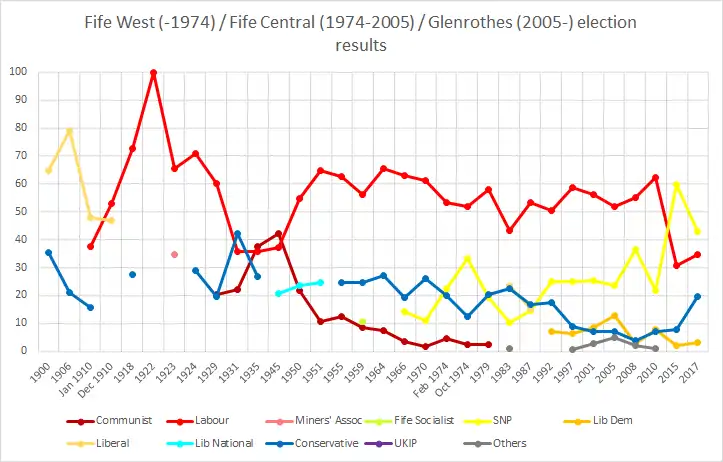
Fife West election results
Elections of the 1970s
| Party | Candidate | Votes | % | ±% | |
|---|---|---|---|---|---|
| Labour | Willie Hamilton | 24,418 | 53.3 | ||
| SNP | David Veitch Livingstone | 10,324 | 22.5 | ||
| Conservative | Stephen Ronald Eyres | 9,098 | 19.8 | ||
| Communist | Alexander Maxwell | 2,019 | 4.4 | ||
| Majority | 14,094 | 30.8 | |||
| Turnout | 45,859 | 79.2 | |||
| Labour win (new seat) | |||||
| Party | Candidate | Votes | % | ±% | |
|---|---|---|---|---|---|
| Labour | Willie Hamilton | 22,400 | 51.9 | −1.4 | |
| SNP | David Veitch Livingstone | 14,414 | 33.4 | +10.9 | |
| Conservative | Peter Derek Clarke | 5,308 | 12.3 | −7.5 | |
| Communist | Alexander Maxwell | 1,040 | 2.4 | −2.0 | |
| Majority | 7,986 | 18.5 | -12.3 | ||
| Turnout | 43,162 | 73.9 | -5.3 | ||
| Labour hold | Swing | ||||
| Party | Candidate | Votes | % | ±% | |
|---|---|---|---|---|---|
| Labour | Willie Hamilton | 27,619 | 58.0 | +6.1 | |
| Conservative | Iain Allistair McCrone | 9,597 | 20.2 | +7.9 | |
| SNP | James Lynch | 9,208 | 19.4 | −14.0 | |
| Communist | Alexander Maxwell | 1,172 | 2.5 | +0.1 | |
| Majority | 18,022 | 37.8 | +19.3 | ||
| Turnout | 47,596 | 77.4 | +3.5 | ||
| Labour hold | Swing | ||||
Elections of the 1980s
| Party | Candidate | Votes | % | ±% | |
|---|---|---|---|---|---|
| Labour | Willie Hamilton | 17,008 | 43.1 | -11.2 | |
| Liberal | Teresa Little | 9,214 | 23.4 | New | |
| Conservative | Douglas Mason | 8,863 | 22.5 | 0.0 | |
| SNP | James Taggart | 4,039 | 10.2 | -12.3 | |
| Ecology | David Allison | 297 | 0.8 | New | |
| Majority | 7,794 | 19.7 | |||
| Turnout | 39,421 | 72.5 | |||
| Labour hold | Swing | ||||
| Party | Candidate | Votes | % | ±% | |
|---|---|---|---|---|---|
| Labour | Henry McLeish | 22,827 | 53.4 | +10.3 | |
| Conservative | Richard Aird | 7,118 | 16.7 | −5.8 | |
| Liberal | Teresa Little | 6,487 | 15.2 | −8.2 | |
| SNP | Dan Hood | 6,296 | 14.7 | +4.5 | |
| Majority | 15,709 | 36.7 | +17.0 | ||
| Turnout | 42,728 | 72.6 | +0.1 | ||
| Labour hold | Swing | +8.0 | |||
Elections of the 1990s
| Party | Candidate | Votes | % | ±% | |
|---|---|---|---|---|---|
| Labour | Henry McLeish | 21,036 | 50.4 | −3.0 | |
| SNP | Tricia Marwick | 10,458 | 25.1 | +10.4 | |
| Conservative | Carol Cender | 7,353 | 17.6 | +0.9 | |
| Liberal Democrats | Craig Harrow | 2,892 | 6.9 | −8.3 | |
| Majority | 10,578 | 25.3 | −11.4 | ||
| Turnout | 41,739 | 74.3 | +1.7 | ||
| Labour hold | Swing | N/A | |||
| Party | Candidate | Votes | % | ±% | |
|---|---|---|---|---|---|
| Labour | Henry McLeish | 23,912 | 58.7 | +7.9 | |
| SNP | Tricia Marwick | 10,199 | 25.0 | -0.1 | |
| Conservative | Jacob Rees-Mogg | 3,669 | 9.0 | −8.6 | |
| Liberal Democrats | Ross Laird | 2,610 | 6.4 | −0.5 | |
| Referendum | John Scrymgeour-Wedderburn | 375 | 0.9 | New | |
| Majority | 13,713 | 33.7 | +8.4 | ||
| Turnout | 40,765 | 69.8 | -4.5 | ||
| Labour hold | Swing | ||||
Elections of the 2000s
| Party | Candidate | Votes | % | ±% | |
|---|---|---|---|---|---|
| Labour | John MacDougall | 18,310 | 56.3 | −2.4 | |
| SNP | David Alexander | 8,235 | 25.3 | +0.3 | |
| Liberal Democrats | Elizabeth Riches | 2,775 | 8.5 | +2.1 | |
| Conservative | Jeremy Balfour | 2,351 | 7.2 | −1.8 | |
| Scottish Socialist | Morag Balfour | 841 | 2.6 | New | |
| Majority | 10,075 | 31.0 | -2.7 | ||
| Turnout | 32,512 | 54.6 | −15.2 | ||
| Labour hold | Swing | ||||
References
- "The Parliamentary Constituencies (Scotland) (Central Fife and Kirkcaldy) Order 1973", legislation.gov.uk, The National Archives, SI 1973/764, retrieved 26 February 2023
- Leigh Rayment's Historical List of MPs – Constituencies beginning with "F"
- http://www.psr.keele.ac.uk/area/uk/ge74a/i08.htm
- http://www.psr.keele.ac.uk/area/uk/ge74b/i08.htm
- http://www.psr.keele.ac.uk/area/uk/ge79/i08.htm
- "Election Data 1983". Electoral Calculus. Archived from the original on 15 October 2011. Retrieved 18 October 2015.
- "Election Data 1987". Electoral Calculus. Archived from the original on 15 October 2011. Retrieved 18 October 2015.
- "Election Data 1992". Electoral Calculus. Archived from the original on 15 October 2011. Retrieved 18 October 2015.
- "Election Data 1997". Electoral Calculus. Archived from the original on 15 October 2011. Retrieved 18 October 2015.
- "Election Data 2001". Electoral Calculus. Archived from the original on 15 October 2011. Retrieved 18 October 2015.
This article is issued from Wikipedia. The text is licensed under Creative Commons - Attribution - Sharealike. Additional terms may apply for the media files.