City of Esbjerg (nomination district)
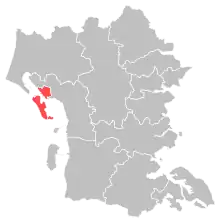
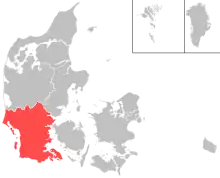
City of Esbjerg nominating district is one of the 92 nominating districts that was created for Danish elections following the 2007 municipal reform.[2][3][4] It is one of the two nomination districs in Esbjerg Municipality, the other being Greater Esbjerg, and also includes Fanø Municipality.[5]
| City of Esbjerg | |
|---|---|
| Esbjerg By | |
| Nomination district constituency for the Folketing | |
 Location of City of Esbjerg within South Jutland | |
 Location of South Jutland within Denmark | |
| Municipalities | Esbjerg Fanø |
| Constituency | South Jutland |
| Electorate | 47,777 (2022)[1] |
| Current constituency | |
| Created | 2007 |
In general elections, the results in the district has been fairly close to the national result, when looking at the split vote between the two blocs.[6]
General elections results
General elections in the 2020s
| Parties | Vote | |||||
|---|---|---|---|---|---|---|
| Votes | % | + / - | ||||
| Social Democrats | 12,465 | 33.52 | +2.64 | |||
| Venstre | 4,518 | 12.15 | -9.76 | |||
| Denmark Democrats | 3,155 | 8.48 | New | |||
| Moderates | 2,979 | 8.01 | New | |||
| Liberal Alliance | 2,946 | 7.92 | +5.84 | |||
| Green Left | 2,739 | 7.36 | +1.18 | |||
| Conservatives | 1,927 | 5.18 | +0.48 | |||
| New Right | 1,919 | 5.16 | +1.34 | |||
| Red–Green Alliance | 1,406 | 3.78 | -3.20 | |||
| Danish People's Party | 1,101 | 2.96 | -7.97 | |||
| Social Liberals | 939 | 2.52 | -3.46 | |||
| The Alternative | 619 | 1.66 | -0.38 | |||
| Independent Greens | 241 | 0.65 | New | |||
| Christian Democrats | 188 | 0.51 | -0.98 | |||
| Kent Nielsen | 46 | 0.12 | New | |||
| Kenneth Vestergaard | 4 | 0.01 | New | |||
| Total | 37,192 | |||||
| Source[7] | ||||||
General elections in the 2010s
| Parties | Vote | |||||
|---|---|---|---|---|---|---|
| Votes | % | + / - | ||||
| Social Democrats | 11,785 | 30.88 | +2.81 | |||
| Venstre | 8,360 | 21.91 | +3.64 | |||
| Danish People's Party | 4,173 | 10.93 | -15.23 | |||
| Red–Green Alliance | 2,663 | 6.98 | -2.11 | |||
| Green Left | 2,359 | 6.18 | +2.46 | |||
| Social Liberals | 2,283 | 5.98 | +3.15 | |||
| Conservatives | 1,792 | 4.70 | +2.91 | |||
| New Right | 1,457 | 3.82 | New | |||
| Stram Kurs | 826 | 2.16 | New | |||
| Liberal Alliance | 794 | 2.08 | -4.56 | |||
| The Alternative | 779 | 2.04 | -0.67 | |||
| Christian Democrats | 569 | 1.49 | +0.76 | |||
| Klaus Riskær Pedersen Party | 307 | 0.80 | New | |||
| Michael Thomsen | 17 | 0.04 | New | |||
| Total | 38,164 | |||||
| Source[8] | ||||||
| Parties | Vote | |||||
|---|---|---|---|---|---|---|
| Votes | % | + / - | ||||
| Social Democrats | 10,998 | 28.07 | -1.75 | |||
| Danish People's Party | 10,251 | 26.16 | +12.84 | |||
| Venstre | 7,158 | 18.27 | -8.57 | |||
| Red–Green Alliance | 3,560 | 9.09 | +2.58 | |||
| Liberal Alliance | 2,603 | 6.64 | +2.86 | |||
| Green Left | 1,457 | 3.72 | -6.32 | |||
| Social Liberals | 1,107 | 2.83 | -3.29 | |||
| The Alternative | 1,061 | 2.71 | New | |||
| Conservatives | 701 | 1.79 | -1.04 | |||
| Christian Democrats | 287 | 0.73 | +0.04 | |||
| Total | 39,183 | |||||
| Source[9] | ||||||
| Parties | Vote | |||||
|---|---|---|---|---|---|---|
| Votes | % | + / - | ||||
| Social Democrats | 11,994 | 29.82 | -1.01 | |||
| Venstre | 10,797 | 26.84 | +0.84 | |||
| Danish People's Party | 5,356 | 13.32 | -2.14 | |||
| Green Left | 4,038 | 10.04 | -4.52 | |||
| Red–Green Alliance | 2,619 | 6.51 | +5.24 | |||
| Social Liberals | 2,462 | 6.12 | +3.31 | |||
| Liberal Alliance | 1,519 | 3.78 | +2.04 | |||
| Conservatives | 1,139 | 2.83 | -3.81 | |||
| Christian Democrats | 277 | 0.69 | 0.00 | |||
| Niesl-Aage Bjerre | 13 | 0.03 | New | |||
| Jørn Bjorholm | 6 | 0.01 | New | |||
| Total | 40,220 | |||||
| Source[10] | ||||||
General elections in the 2000s
| Parties | Vote | |||||
|---|---|---|---|---|---|---|
| Votes | % | + / - | ||||
| Social Democrats | 12,241 | 30.83 | ||||
| Venstre | 10,322 | 26.00 | ||||
| Danish People's Party | 6,136 | 15.46 | ||||
| Green Left | 5,780 | 14.56 | ||||
| Conservatives | 2,637 | 6.64 | ||||
| Social Liberals | 1,114 | 2.81 | ||||
| New Alliance | 691 | 1.74 | ||||
| Red–Green Alliance | 505 | 1.27 | ||||
| Christian Democrats | 274 | 0.69 | ||||
| Total | 39,700 | |||||
| Source[11] | ||||||
European Parliament elections results
2019 European Parliament election in Denmark
| Parties | Vote | |||||
|---|---|---|---|---|---|---|
| Votes | % | + / - | ||||
| Social Democrats | 6,941 | 25.16 | +4.53 | |||
| Venstre | 5,858 | 21.24 | +4.64 | |||
| Danish People's Party | 3,964 | 14.37 | -16.75 | |||
| Green Left | 2,889 | 10.47 | +1.68 | |||
| Social Liberals | 1,978 | 7.17 | +3.41 | |||
| Red–Green Alliance | 1,696 | 6.15 | New | |||
| People's Movement against the EU | 1,480 | 5.37 | -5.08 | |||
| Conservatives | 1,306 | 4.73 | -1.11 | |||
| The Alternative | 749 | 2.72 | New | |||
| Liberal Alliance | 722 | 2.62 | -0.21 | |||
| Total | 27,583 | |||||
| Source[12] | ||||||
2014 European Parliament election in Denmark
| Parties | Vote | |||||
|---|---|---|---|---|---|---|
| Votes | % | + / - | ||||
| Danish People's Party | 7,354 | 31.12 | +14.69 | |||
| Social Democrats | 4,874 | 20.63 | -5.88 | |||
| Venstre | 3,922 | 16.60 | -2.42 | |||
| People's Movement against the EU | 2,469 | 10.45 | +1.17 | |||
| Green Left | 2,076 | 8.79 | -6.45 | |||
| Conservatives | 1,379 | 5.84 | -2.63 | |||
| Social Liberals | 888 | 3.76 | +0.88 | |||
| Liberal Alliance | 668 | 2.83 | +2.45 | |||
| Total | 23,630 | |||||
| Source[13] | ||||||
2009 European Parliament election in Denmark
| Parties | Vote | |||||
|---|---|---|---|---|---|---|
| Votes | % | + / - | ||||
| Social Democrats | 6,408 | 26.51 | ||||
| Venstre | 4,597 | 19.02 | ||||
| Danish People's Party | 3,970 | 16.43 | ||||
| Green Left | 3,684 | 15.24 | ||||
| People's Movement against the EU | 2,244 | 9.28 | ||||
| Conservatives | 2,046 | 8.47 | ||||
| Social Liberals | 696 | 2.88 | ||||
| June Movement | 432 | 1.79 | ||||
| Liberal Alliance | 93 | 0.38 | ||||
| Total | 24,170 | |||||
| Source[14] | ||||||
Referendums
2022 Danish European Union opt-out referendum[15]
| Option | Votes | % |
|---|---|---|
| ✓ YES | 16,859 | 59.06 |
| X NO | 11,686 | 40.94 |
2015 Danish European Union opt-out referendum[16]
| Option | Votes | % |
|---|---|---|
| X NO | 20,118 | 61.90 |
| ✓ YES | 12,376 | 38.10 |
2014 Danish Unified Patent Court membership referendum[17]
| Option | Votes | % |
|---|---|---|
| ✓ YES | 12,861 | 55.20 |
| X NO | 10,437 | 44.80 |
2009 Danish Act of Succession referendum[18]
| Option | Votes | % |
|---|---|---|
| ✓ YES | 18,607 | 82.92 |
| X NO | 3,832 | 17.08 |
References
- "Esbjergkredsen". kmdvalg.dk (in Danish). Retrieved 2023-06-04.
- "Nye valgkredse fordeler stemmerne anderledes". dr.dk (in Danish). Retrieved 2023-06-04.
- "Beretning om nye valgkredse som følge af kommunalreformen" (in Danish). Retrieved 2023-06-04.
- "Det danske valgsystem: Valg til Folketinget". valg.im (in Danish). Retrieved 2023-06-04.
- "52 Esbjerg By". dataforsyningen.dk (in Danish). Retrieved 2023-06-04.
- "Valgresultater fra tidligere valg:". kmdvalg (in Danish). Retrieved 2023-06-04.
- "FOLKETINGSVALG TIRSDAG 1. NOVEMBER 2022". valg.im (in Danish). Retrieved 2023-06-27.
- "FOLKETINGSVALG ONSDAG 5. JUNI 2019". valg.im (in Danish). Retrieved 2023-06-27.
- "FOLKETINGSVALG TORSDAG 18. JUNI 2015". valg.im (in Danish). Retrieved 2023-06-27.
- "FOLKETINGSVALG TORSDAG 15. SEPTEMBER 2011". valg.im (in Danish). Retrieved 2023-06-27.
- "Folketingsvalget den 13. november 2007". valg.im (in Danish). Retrieved 2023-06-27.
- "EUROPA-PARLAMENTSVALG SØNDAG 26. MAJ 2019". dst.dk (in Danish). Retrieved 2023-07-01.
- "EUROPA-PARLAMENTSVALG SØNDAG 25. MAJ 2014". dst.dk (in Danish). Retrieved 2023-07-01.
- "EUROPA-PARLAMENTSVALG SØNDAG 7. JUNI 2009". dst.dk (in Danish). Retrieved 2023-07-01.
- "FOLKEAFSTEMNING ONSDAG 1. JUNI 2022". dst.dk (in Danish). Retrieved 2023-07-05.
- "FOLKEAFSTEMNING TORSDAG 3. DECEMBER 2015". dst.dk (in Danish). Retrieved 2023-07-05.
- "FOLKEAFSTEMNING SØNDAG 25. MAJ 2014". dst.dk (in Danish). Retrieved 2023-07-05.
- "FOLKEAFSTEMNING SØNDAG 7. JUNI 2009". dst.dk (in Danish). Retrieved 2023-07-05.