Cleveland (UK Parliament constituency)
Cleveland was a county constituency in the Langbaurgh Wapentake (also known as Cleveland), North Riding of Yorkshire, England.
| Cleveland | |
|---|---|
| Former County constituency for the House of Commons | |
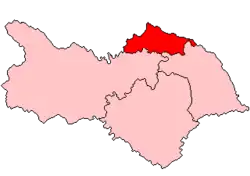 Cleveland 1918–1950 | |
| 1885–February 1974 | |
| Seats | 1 |
| Created from | North Riding of Yorkshire |
| Replaced by | Cleveland and Whitby and Redcar |
Electorate
It returned one Member of Parliament (MP) to the British House of Commons, using the first past the post voting system. All elections were conducted with a secret ballot, which had been introduced under the Ballot Act 1872.
The franchise was initially restricted, and extended on several occasions:
- The Representation of the People Act 1884 gave a vote to adult males who met a property qualification; women, and about 40% of men, had no vote
- The Representation of the People Act 1918 extended the vote to all adult males and to women over the age of 30 who met certain property qualifications
- The Representation of the People Act 1928 allowed women to vote from age 21, on the same terms as men
- The Representation of the People Act 1948 abolished the plural votes previously granted to electors who met a property qualification because of their business or shop premises
- The Representation of the People Act 1969 lowered the voting age to 18
History
The Cleveland constituency was created when the North Riding of Yorkshire constituency was divided by the Redistribution of Seats Act 1885, and Cleveland then covered the northern tip of the North Riding.
In 1918 it was redefined in terms of local government areas, and covered part of Guisborough Rural District and the Middlesbrough Rural District, along with the urban districts of Eston, Guisborough, Hinderwell, Loftus, Redcar, Saltburn by the Sea and Skelton and Brotton. In 1948 it was redefined again to cover Eston, Guisborough, Loftus, Redcar, Saltburn and Marske by the Sea and Skelton and Brotton; the new boundaries were first used for the 1950 general election. As such it was a socially mixed constituency throughout its existence, containing working class Middlesbrough suburbs and ironstone mining villages as well as middle class resorts and agricultural communities.
It returned its last Member of Parliament in 1970, by which time Cleveland district of Yorkshire's North Riding had been abolished in 1967, to the House of Commons of the Parliament of the United Kingdom until it was abolished leading up to the February 1974 general election.
It was replaced by the Redcar constituency and Cleveland & Whitby constituency.
Members of Parliament
| Election | Member | Party | |
|---|---|---|---|
| 1885 | constituency created | ||
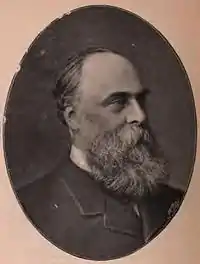
| 1885 | Henry Fell Pease | Liberal | |
| 1897 by-election | Alfred Pease | Liberal | |
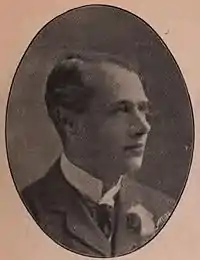
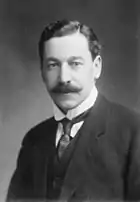
| 1902 by-election | Herbert Samuel | Liberal | |
| 1918 | Sir Park Goff | Coalition Conservative | |
| 1923 | Sir Charles Starmer | Liberal | |
| 1924 | Sir Park Goff | Unionist | |
| 1929 | William Mansfield | Labour | |
| 1931 | Robert Tatton Bower | Conservative | |
| 1945 | George Willey | Labour | |
| 1952 by-election | Arthur Palmer | Labour | |
| 1959 | Wilfred Proudfoot | Conservative | |
| 1964 | James Tinn | Labour | |
| Feb 1974 | constituency abolished: see Cleveland & Whitby | ||
Elections
Elections in the 1880s
| Party | Candidate | Votes | % | ±% | |
|---|---|---|---|---|---|
| Liberal | Henry Fell Pease | 6,948 | 70.9 | ||
| Conservative | Guy Dawnay | 2,845 | 29.1 | ||
| Majority | 4,103 | 41.8 | |||
| Turnout | 9,793 | 83.1 | |||
| Registered electors | 11,788 | ||||
| Liberal win (new seat) | |||||
| Party | Candidate | Votes | % | ±% | |
|---|---|---|---|---|---|
| Liberal | Henry Fell Pease | Unopposed | |||
| Liberal hold | |||||
Elections in the 1890s
| Party | Candidate | Votes | % | ±% | |
|---|---|---|---|---|---|
| Liberal | Henry Fell Pease | 4,397 | 52.1 | N/A | |
| Conservative | Arthur Dorman | 4,049 | 47.9 | New | |
| Majority | 348 | 4.2 | N/A | ||
| Turnout | 8,446 | 76.3 | N/A | ||
| Registered electors | 11,076 | ||||
| Liberal hold | Swing | N/A | |||
| Party | Candidate | Votes | % | ±% | |
|---|---|---|---|---|---|
| Liberal | Henry Fell Pease | 4,762 | 53.3 | +1.2 | |
| Conservative | Robert Ropner | 4,175 | 46.7 | -1.2 | |
| Majority | 587 | 6.6 | +2.4 | ||
| Turnout | 8,937 | 81.3 | +5.0 | ||
| Registered electors | 10,989 | ||||
| Liberal hold | Swing | +1.2 | |||
Pease's death causes a by-election.
| Party | Candidate | Votes | % | ±% | |
|---|---|---|---|---|---|
| Liberal | Alfred Pease | 5,508 | 57.4 | +4.1 | |
| Conservative | Robert Ropner | 4,080 | 42.6 | -4.1 | |
| Majority | 1,428 | 14.8 | +8.2 | ||
| Turnout | 9,588 | 83.7 | +2.4 | ||
| Registered electors | 11,454 | ||||
| Liberal hold | Swing | +4.1 | |||
Elections in the 1900s
| Party | Candidate | Votes | % | ±% | |
|---|---|---|---|---|---|
| Liberal | Alfred Pease | Unopposed | |||
| Liberal hold | |||||
| Party | Candidate | Votes | % | ±% | |
|---|---|---|---|---|---|
| Liberal | Herbert Samuel | 5,834 | 60.6 | N/A | |
| Conservative | Geoffrey Drage | 3,798 | 39.4 | New | |
| Majority | 2,036 | 21.2 | N/A | ||
| Turnout | 9,632 | 77.9 | N/A | ||
| Registered electors | 12,360 | ||||
| Liberal hold | Swing | N/A | |||
| Party | Candidate | Votes | % | ±% | |
|---|---|---|---|---|---|
| Liberal | Herbert Samuel | Unopposed | |||
| Liberal hold | |||||
| Party | Candidate | Votes | % | ±% | |
|---|---|---|---|---|---|
| Liberal | Herbert Samuel | 6,296 | 54.2 | N/A | |
| Conservative | James Windsor Lewis | 5,325 | 45.8 | New | |
| Majority | 971 | 8.4 | N/A | ||
| Turnout | 11,621 | 83.5 | N/A | ||
| Registered electors | 13,922 | ||||
| Liberal hold | Swing | N/A | |||
Elections in the 1910s
| Party | Candidate | Votes | % | ±% | |
|---|---|---|---|---|---|
| Liberal | Herbert Samuel | 7,484 | 57.7 | N/A | |
| Conservative | James Windsor Lewis | 5,491 | 42.3 | N/A | |
| Majority | 1,993 | 15.4 | N/A | ||
| Turnout | 12,975 | 87.6 | N/A | ||
| Registered electors | 14,811 | ||||
| Liberal hold | Swing | N/A | |||
| Party | Candidate | Votes | % | ±% | |
|---|---|---|---|---|---|
| Liberal | Herbert Samuel | 6,870 | 56.3 | -1.4 | |
| Conservative | James Windsor Lewis | 5,343 | 43.7 | +1.4 | |
| Majority | 1,527 | 12.6 | -2.8 | ||
| Turnout | 12,213 | 82.5 | -5.1 | ||
| Registered electors | 14,811 | ||||
| Liberal hold | Swing | -1.4 | |||
General Election 1914–15:
Another General Election was required to take place before the end of 1915. The political parties had been making preparations for an election to take place and by the July 1914, the following candidates had been selected;
- Liberal: Herbert Samuel
- Unionist: Park Goff
- Labour: Harry Dack
| Party | Candidate | Votes | % | ±% | |
|---|---|---|---|---|---|
| Liberal | Herbert Samuel | 7,312 | 83.4 | +27.1 | |
| John Bull League | R Knight | 1,453 | 16.6 | New | |
| Majority | 5,859 | 66.8 | +54.2 | ||
| Turnout | 8,765 | 53.4 | −29.1 | ||
| Registered electors | 16,424 | ||||
| Liberal hold | Swing | N/A | |||
| Party | Candidate | Votes | % | ±% | |
|---|---|---|---|---|---|
| C | Unionist | Park Goff | 8,701 | 35.6 | −8.1 |
| Labour | Harry Dack | 8,610 | 35.3 | New | |
| Liberal | Herbert Samuel | 7,089 | 29.1 | −27.2 | |
| Majority | 91 | 0.3 | N/A | ||
| Turnout | 24,400 | 66.2 | −16.3 | ||
| Registered electors | 36,843 | ||||
| Unionist gain from Liberal | Swing | +4.1 | |||
| C indicates candidate endorsed by the coalition government. | |||||
Elections in the 1920s
| Party | Candidate | Votes | % | ±% | |
|---|---|---|---|---|---|
| Unionist | Park Goff | 13,369 | 37.7 | +2.1 | |
| Liberal | Charles Starmer | 11,668 | 32.8 | +3.7 | |
| Labour | Harry Dack | 10,843 | 29.5 | −5.8 | |
| Majority | 1,701 | 4.9 | +4.6 | ||
| Turnout | 35,520 | 82.4 | +16.2 | ||
| Registered electors | 43,105 | ||||
| Unionist hold | Swing | −0.8 | |||
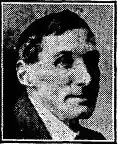
| Party | Candidate | Votes | % | ±% | |
|---|---|---|---|---|---|
| Liberal | Charles Starmer | 13,326 | 38.2 | +5.4 | |
| Unionist | Park Goff | 11,855 | 34.0 | −3.7 | |
| Labour | Robert Dennison | 9,683 | 27.8 | −1.7 | |
| Majority | 1,471 | 4.2 | N/A | ||
| Turnout | 34,864 | 80.4 | −2.0 | ||
| Registered electors | 43,339 | ||||
| Liberal gain from Unionist | Swing | +4.6 | |||
| Party | Candidate | Votes | % | ±% | |
|---|---|---|---|---|---|
| Unionist | Park Goff | 16,578 | 43.6 | +9.6 | |
| Labour | William Mansfield | 11,153 | 29.4 | +1.6 | |
| Liberal | Charles Starmer | 10,260 | 27.0 | −11.2 | |
| Majority | 5,425 | 14.2 | N/A | ||
| Turnout | 37,991 | 86.3 | +5.9 | ||
| Registered electors | 44,040 | ||||
| Unionist gain from Liberal | Swing | +10.4 | |||
| Party | Candidate | Votes | % | ±% | |
|---|---|---|---|---|---|
| Labour | William Mansfield | 16,938 | 36.3 | +6.9 | |
| Unionist | Park Goff | 15,255 | 32.6 | −11.0 | |
| Liberal | Charles Starmer | 14,535 | 31.1 | +4.1 | |
| Majority | 1,683 | 3.7 | N/A | ||
| Turnout | 47,131 | 84.4 | −2.0 | ||
| Registered electors | 55,463 | ||||
| Labour gain from Unionist | Swing | +9.0 | |||
Elections in the 1930s
| Party | Candidate | Votes | % | ±% | |
|---|---|---|---|---|---|
| Conservative | Robert Tatton Bower | 30,608 | 60.41 | ||
| Labour | William Mansfield | 20,060 | 39.59 | ||
| Majority | 10,548 | 20.82 | |||
| Turnout | 50,668 | 85.92 | |||
| Conservative gain from Labour | Swing | ||||
| Party | Candidate | Votes | % | ±% | |
|---|---|---|---|---|---|
| Conservative | Robert Tatton Bower | 26,508 | 52.72 | ||
| Labour | William Mansfield | 23,776 | 47.28 | ||
| Majority | 2,732 | 5.44 | |||
| Turnout | 50,284 | 81.15 | |||
| Conservative hold | Swing | ||||
Elections in the 1940s
General Election 1939–40:
Another General Election was required to take place before the end of 1940. The political parties had been making preparations for an election to take place from 1939 and by the end of this year, the following candidates had been selected;
- Conservative: Robert Tatton Bower
- Labour: William Mansfield
- Liberal: Matthew Robinson Shawcross
| Party | Candidate | Votes | % | ±% | |
|---|---|---|---|---|---|
| Labour | George Willey | 27,660 | 48.95 | ||
| Conservative | Robert Tatton Bower | 19,739 | 34.93 | ||
| Liberal | Matthew Robinson Shawcross | 9,108 | 16.12 | New | |
| Majority | 7,921 | 14.02 | N/A | ||
| Turnout | 56,507 | 76.05 | |||
| Labour gain from Conservative | Swing | ||||
Elections in the 1950s
| Party | Candidate | Votes | % | ±% | |
|---|---|---|---|---|---|
| Labour | George Willey | 28,940 | 51.43 | ||
| Conservative | Edward Charles Peake | 21,332 | 37.91 | ||
| Liberal | Arthur Laurence Braithwaite Childe | 5,996 | 10.66 | ||
| Majority | 7,608 | 13.52 | |||
| Turnout | 56,268 | 85.79 | |||
| Labour hold | Swing | ||||
| Party | Candidate | Votes | % | ±% | |
|---|---|---|---|---|---|
| Labour | George Willey | 31,237 | 54.81 | ||
| Conservative | Patrick Wall | 25,756 | 45.19 | ||
| Majority | 5,481 | 9.62 | |||
| Turnout | 56,993 | 85.11 | |||
| Labour hold | Swing | ||||
| Party | Candidate | Votes | % | ±% | |
|---|---|---|---|---|---|
| Labour Co-op | Arthur Palmer | 25,985 | 54.09 | -0.72 | |
| Conservative | Patrick Wall | 22,064 | 45.92 | +0.72 | |
| Majority | 3,921 | 8.16 | -1.46 | ||
| Turnout | 48.049 | ||||
| Labour Co-op hold | Swing | ||||
| Party | Candidate | Votes | % | ±% | |
|---|---|---|---|---|---|
| Labour Co-op | Arthur Palmer | 27,649 | 50.15 | ||
| Conservative | Wilf Proudfoot | 27,468 | 49.84 | ||
| Majority | 181 | 0.33 | |||
| Turnout | 55,117 | 80.81 | |||
| Labour Co-op hold | Swing | ||||
| Party | Candidate | Votes | % | ±% | |
|---|---|---|---|---|---|
| Conservative | Wilf Proudfoot | 30,445 | 51.40 | ||
| Labour Co-op | Arthur Palmer | 28,790 | 48.60 | ||
| Majority | 1,655 | 2.80 | N/A | ||
| Turnout | 59,235 | 83.10 | |||
| Conservative gain from Labour Co-op | Swing | ||||
Elections in the 1960s
| Party | Candidate | Votes | % | ±% | |
|---|---|---|---|---|---|
| Labour | James Tinn | 28,596 | 44.61 | ||
| Conservative | Wilf Proudfoot | 24,124 | 37.63 | ||
| Liberal | John William Stevens | 11,387 | 17.76 | New | |
| Majority | 4,472 | 6.98 | |||
| Turnout | 64,107 | 83.59 | |||
| Labour gain from Conservative | Swing | ||||
| Party | Candidate | Votes | % | ±% | |
|---|---|---|---|---|---|
| Labour | James Tinn | 34,303 | 53.64 | ||
| Conservative | Wilf Proudfoot | 22,423 | 35.06 | ||
| Liberal | Michael Ford Pitts | 7,229 | 11.30 | ||
| Majority | 11,880 | 18.58 | |||
| Turnout | 63,955 | 81.13 | |||
| Labour hold | Swing | ||||
Elections in the 1970s
| Party | Candidate | Votes | % | ±% | |
|---|---|---|---|---|---|
| Labour | James Tinn | 36,213 | 53.77 | ||
| Conservative | Peter Coles Price | 31,130 | 46.23 | ||
| Majority | 5,083 | 7.54 | |||
| Turnout | 67,343 | 72.94 | |||
| Labour hold | Swing | ||||
References
- British parliamentary election results, 1885–1918 (Craig)
- British parliamentary election results, 1885–1918 (Craig)
- British parliamentary election results, 1885–1918 (Craig)
- British parliamentary election results, 1885–1918 (Craig)
- British parliamentary election results 1885–1918 by Craig
- British parliamentary election results, 1885–1918 (Craig)
- The Times, 7 November 1902 p8
- British parliamentary election results, 1885–1918 (Craig)
- British parliamentary election results, 1885–1918 (Craig)
- British parliamentary election results, 1885–1918 (Craig)
- British parliamentary election results, 1885–1918 (Craig)
- British parliamentary election results, 1885–1918 (Craig)
- British parliamentary election results, 1885–1918 (Craig)
- British Parliamentary Election Results 1918–1949, FWS Craig
- The Times House of Commons, 1955
Craig, F. W. S. (1983). British parliamentary election results 1918–1949 (3 ed.). Chichester: Parliamentary Research Services. ISBN 0-900178-06-X.