Climograph
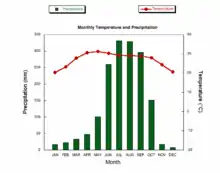
A climograph is a graphical representation of a location's basic climate. Climographs display data for two variables: (a) monthly average temperature and (b) monthly average precipitation.[1] These are useful tools to quickly describe a location's climate.

Representation
| Tucson, AZ | ||||||||||||||||||||||||||||||||||||||||||||||||||||||||||||
|---|---|---|---|---|---|---|---|---|---|---|---|---|---|---|---|---|---|---|---|---|---|---|---|---|---|---|---|---|---|---|---|---|---|---|---|---|---|---|---|---|---|---|---|---|---|---|---|---|---|---|---|---|---|---|---|---|---|---|---|---|
| Climate chart (explanation) | ||||||||||||||||||||||||||||||||||||||||||||||||||||||||||||
| ||||||||||||||||||||||||||||||||||||||||||||||||||||||||||||
While temperature is typically visualized using a line, some climographs opt to visualize the data using a bar. This method's advantage allows the climograph to display the average range in temperature (average minimum and average maximum temperatures) rather than a simple monthly average.
Use
The patterns in a climograph describe not just a location's climate but also provide evidence for that climate's relative geographical location. For example, a climograph with a narrow range in temperature over the year might represent a location close to the equator, or alternatively a location adjacent to a large body of water exerting a moderating effect on the temperature range. Meanwhile, a wide range in annual temperature might suggest the opposite. We could also derive information about a site's ecological conditions through a climograph. For example, if precipitation is consistently low year-round, we might suggest the location reflects a desert; if there is a noticeable seasonal pattern to the precipitation, we might suggest the location experiences a monsoon season. When combining the temperature and precipitation patterns together, we have even better clues as to the local conditions. Despite this, a number of local factors contribute to the patterns observed in a particular place; therefore, a climograph is not a foolproof tool that captures all the geographic variation that might exist.
References
- Banks, James A. (1997). United States: Adventures in time and place. Macmillan. p. 242. ISBN 978-0021466153.
External links
- "How to make a Climograph" (PDF). Archived from the original (PDF) on 2011-07-24.
- https://climatecharts.net/ - Webapplication for generating climographs for places worldwide dynamically.
- ClimateCharts.net an interactive climate analysis web platform https://doi.org/10.1080/17538947.2020.1829112 (Open Access)
- https://climate.mapresso.com/ - Web application for generating climate diagrams for any location on Earth using the free high-resolution CHELSA dataset.