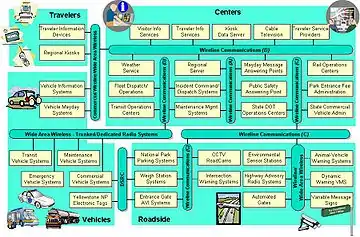
System context diagram
A system context diagram in engineering is a diagram that defines the boundary between the system, or part of a system, and its environment, showing the entities that interact with it.[2] This diagram is a high level view of a system. It is similar to a block diagram.
.svg.png.webp)
Overview
System context diagrams show a system, as a whole and its inputs and outputs from/to external factors. According to Kossiakoff and Sweet (2011):[3]
System Context Diagrams ... represent all external entities that may interact with a system ... Such a diagram pictures the system at the center, with no details of its interior structure, surrounded by all its interacting systems, environments and activities. The objective of the system context diagram is to focus attention on external factors and events that should be considered in developing a complete set of systems requirements and constraints.
System context diagrams are used early in a project to get agreement on the scope under investigation.[4] Context diagrams are typically included in a requirements document. These diagrams must be read by all project stakeholders and thus should be written in plain language, so the stakeholders can understand items within the document.
Building blocks
Context diagrams can be developed with the use of two types of building blocks:
- Entities (Actors): labeled boxes; one in the center representing the system, and around it multiple boxes for each external actor
- Relationships: labeled lines between the entities and system
For example, "customer places order." Context diagrams can also use many different drawing types to represent external entities. They can use ovals, stick figures, pictures, clip art or any other representation to convey meaning. Decision trees and data storage are represented in system flow diagrams.
A context diagram can also list the classifications of the external entities as one of a set of simple categories[5] (Examples:[6]), which add clarity to the level of involvement of the entity with regards to the system. These categories include:
- Active: Dynamic to achieve some goal or purpose (Examples: "Article readers" or "customers").
- Passive: Static external entities which infrequently interact with the system (Examples: "Article editors" or "database administrator").
- Cooperative: Predictable external entities which are used by the system to bring about some desired outcome (Examples: "Internet service providers" or "shipping companies").
- Autonomous (Independent): External entities which are separated from the system, but affect the system indirectly, by means of imposed constraints or similar influences (Examples: "regulatory committees" or "standards groups").
Alternatives
The best system context diagrams are used to display how a system interoperates at a very high level, or how systems operate and interact logically. The system context diagram is a necessary tool in developing a baseline interaction between systems and actors; actors and a system or systems and systems. Alternatives to the system context diagram are:

- Architecture Interconnect Diagram: The figure gives an example of an Architecture Interconnect Diagram: A representation of the Albuquerque regional ITS architecture interconnects for the Albuquerque Police Department that was generated using the Turbo Architecture tool is shown in the figure. Each block represents an ITS inventory element, including the name of the stakeholder in the top shaded portion. The interconnect lines between elements are solid or dashed, indicating existing or planned connections.[7]
- Business Model Canvas, a strategic management template for developing new or documenting existing business models. It is a visual chart with elements describing a firm's value proposition, infrastructure, customers, and finances.[1] It assists firms in aligning their activities by illustrating potential trade-offs.
- Enterprise data model: this type of data model according to Simsion (2005) can contain up to 50 to 200 entity classes, which results from specific "high level of generalization in data modeling".[8]
- IDEF0 Top Level Context Diagram: The IDEF0 process starts with the identification of the prime function to be decomposed. This function is identified on a "Top Level Context Diagram" that defines the scope of the particular IDEF0 analysis.
- Problem Diagrams (Problem Frames): In addition to the kinds of things shown on a context diagram, a problem diagram shows requirements and requirements references.
- Use case diagram: One of the Unified Modeling Language diagrams. They also represent the scope of the project at a similar level of abstraction. - Use Cases, however, tend to focus more on the goals of 'actors' who interact with the system, and do not specify any solution. Use Case diagrams represent a set of Use Cases, which are textual descriptions of how an actor achieves the goal of a use case. for Example Customer Places Order.
- ArchiMate: ArchiMate is an open and independent enterprise architecture modeling language to support the description, analysis and visualization of architecture within and across business domains in an unambiguous way.
Most of these diagrams work well as long as a limited number of interconnects will be shown. Where twenty or more interconnects must be displayed, the diagrams become quite complex and can be difficult to read.[7]
See also
References
- NDE Project Management Archived 7 November 2008 at the Wayback Machine (NPOESS) Data Exploitation web site. 2008.
- Manoj Kumar Choubey (2012) IT Infrastructure and Management (For the GBTU and MMTU). p. 53
- Alexander Kossiakoff, William N. Sweet (2011). Systems Engineering: Principles and Practices p. 266
- Richard Wiener (1998) Journal of Object-oriented Programming. Vol 11. p. 68
- Suzanne Robertson, James C. Robertson (2006) Mastering the Requirements Process. Pearson Education, 17 mrt. 2006
- System Goal Modelling using the i*: Approach in RESCUE Centre HCI Design, 27 February 2003
- US Department of Transportation, Office of Operations (2006)Regional ITS Architecture Guidance Document. July 2006
- Graeme C. Simsion, Graham C. Witt (2005). Data Modeling Essentials. p. 512.