Economic indicator
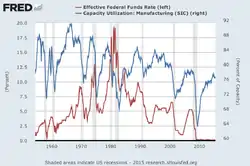
An economic indicator is a statistic about an economic activity. Economic indicators allow analysis of economic performance and predictions of future performance. One application of economic indicators is the study of business cycles. Economic indicators include various indices, earnings reports, and economic summaries: for example, the unemployment rate, quits rate (quit rate in American English), housing starts, consumer price index (a measure for inflation), Inverted yield curve,[1] consumer leverage ratio, industrial production, bankruptcies, gross domestic product, broadband internet penetration, retail sales, price index, and changes in credit conditions.
| Part of a series on |
| Economics |
|---|
The leading business cycle dating committee in the United States of America is the private National Bureau of Economic Research. The Bureau of Labor Statistics is the principal fact-finding agency for the U.S. government in the field of labor economics and statistics. Other producers of economic indicators includes the United States Census Bureau and United States Bureau of Economic Analysis.
Classification by timing
Economic indicators can be classified into three categories according to their usual timing in relation to the business cycle: leading indicators, lagging indicators, and coincident indicators.
Leading indicators
Leading indicators are indicators that usually, but not always, change before the economy as a whole changes.[3] They are therefore useful as short-term predictors of the economy. Leading indicators include the index of consumer expectations, building permits, and credit conditions. The Conference Board publishes a composite Leading Economic Index consisting of ten indicators designed to predict activity in the U. S. economy six to nine months in future.
Components of the Conference Board's Leading Economic Indicators Index:[4]
- Average weekly hours (manufacturing) — Adjustments to the working hours of existing employees are usually made in advance of new hires or layoffs, which is why the measure of average weekly hours is a leading indicator for changes in unemployment.
- Average weekly initial jobless claims for unemployment insurance — The CB reverses the value of this component from positive to negative because a positive reading indicates a loss in jobs. The initial jobless-claims data is more sensitive to business conditions than other measures of unemployment, and as such leads the monthly unemployment data released by the U.S. Department of Labor.
- Manufacturers' new orders for consumer goods/materials — This component is considered a leading indicator because increases in new orders for consumer goods and materials usually mean positive changes in actual production. The new orders decrease inventory and contribute to unfilled orders, a precursor to future revenue.
- Vendor performance (slower deliveries diffusion index) — This component measures the time it takes to deliver orders to industrial companies. Vendor performance leads the business cycle because an increase in delivery time can indicate rising demand for manufacturing supplies. Vendor performance is measured by a monthly survey from the National Association of Purchasing Managers (NAPM). This diffusion index measures one-half of the respondents reporting no change and all respondents reporting slower deliveries.
- Manufacturers' new orders for non-defense capital goods — As stated above, new orders lead the business cycle because increases in orders usually mean positive changes in actual production and perhaps rising demand. This measure is the producer's counterpart of new orders for consumer goods/materials component (#3).
- Building permits for new private housing units.
- Stock prices of 500 common stocks — Equity market returns are considered a leading indicator because changes in stock prices reflect investors' expectations for the future of the economy and interest rates.
 Corporate equities as leading indicator with respect to GDP
 - Leading Credit Index - a composite index developed by the Conference Board consisting of six financial indicators such as yield spreads, loan survey information and investor sentiment[5]
- Interest rate spread (10-year Treasury vs. Federal Funds target) — The interest rate spread is often referred to as the yield curve and implies the expected direction of short-, medium- and long-term interest rates. Changes in the yield curve have been the most accurate predictors of downturns in the economic cycle. This is particularly true when the curve becomes inverted, that is, when the longer-term returns are expected to be less than the short rates.
- Index of consumer expectations — This is the only component of the leading indicators that is based solely on expectations. This component leads the business cycle because consumer expectations can indicate future consumer spending or tightening. The data for this component comes from the University of Michigan's Survey Research Center, and is released once a month.
Economist D.W. Mackenzie suggests that the ratio of private to public employment may also be useful as a leading economic indicator.
Lagging indicators
Lagging indicators are indicators that usually change after the economy as a whole does. The lag time associated with lagging indicators can vary, contingent on specific contextual factors and the prevailing economic conditions of a given country.[6] In a performance measuring system, profit earned by a business is a lagging indicator as it reflects historical performance; similarly, improved customer satisfaction is the result of initiatives taken in the past.
The Index of Lagging Indicators is published monthly by The Conference Board, a non-governmental organization, which determines the value of the index from seven components.
The Index tends to follow changes in the overall economy.
The components on the Conference Board's index are:
- The average duration of unemployment (inverted)
- The value of outstanding commercial and industrial loans
- The change in the Consumer Price Index for services
- The change in labour cost per unit of output
- The ratio of manufacturing and trade inventories to sales
- The ratio of consumer credit outstanding to personal income
- The average prime rate charged by banks

Coincident indicators
Coincident indicators change at approximately the same time as the whole economy, thereby providing information about the current state of the economy. There are many coincident economic indicators, such as Gross Domestic Product, industrial production, personal income and retail sales. A coincident index may be used to identify, after the fact, the dates of peaks and troughs in the business cycle.[7]
There are four economic statistics comprising the Index of Coincident Economic Indicators:[8]
- Number of employees on non-agricultural payrolls
- Personal income less transfer payments
- Industrial production
- Manufacturing and trade sale
The Philadelphia Federal Reserve produces state-level coincident indexes based on 4 state-level variables:[9]
- Nonfarm payroll employment
- Average hours worked in manufacturing
- Unemployment rate
- Wage and salary disbursements deflated by the consumer price index (U.S. city average)
By direction
There are also three terms that describe an economic indicator's direction relative to the direction of the general economy:

- Procyclical indicators
- move in the same direction as the general economy: they increase when the economy is doing well; decrease when it is doing badly. Gross domestic product (GDP) is a procyclic indicator.
- Countercyclical indicators
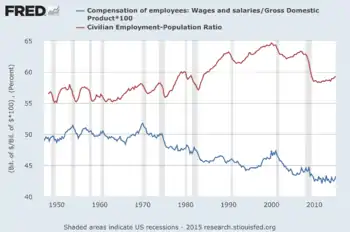
- move in the opposite direction to the general economy. The unemployment rate and the wage share are countercyclic: in the short run they rise when the economy is deteriorating.
- Acyclical indicators
- are those with little or no correlation to the business cycle: they may rise or fall when the general economy is doing well, and may rise or fall when it is not doing well.[10]
Local indicators
Local governments often need to project future tax revenues. The city of San Francisco, for example, uses the price of a one-bedroom apartment on Craigslist, weekend subway ridership numbers, parking garage usage, and monthly reports on passenger landings at the city's airport.[11]
See also
- Big Mac Index
- Bureau of Labor Statistics
- CAPRI model
- Consumer confidence index
- Consumer leverage ratio
- Consumer price index
- Core inflation
- Cost-weighted activity index
- Economic data
- Fundamental analysis
- Genuine Progress Index
- Gross domestic product
- Hemline index
- Inflation
- Lipstick effect
- List of economic reports by U.S. government agencies
- Macroeconomic indicators
- Misery index (economics)
- Purchasing Managers' Index
- The Conference Board
References
- "The impact of an inverted yield curve".
- "What Does the Producer Price Index Tell You?".
- O'Sullivan, Arthur; Sheffrin, Steven M. (2003). Economics: Principles in Action. Upper Saddle River, New Jersey: Pearson Prentice Hall. p. 314.
- "US LEADING INDICATORS". www.conference-board.org. July 20, 2023. Retrieved 17 August 2023.
- "Using a Leading Credit Index to Predict Turning Points in the U.S. Business Cycle". www.conference-board.org. December 2011. Retrieved 17 August 2023.
- Sanghro, Majid Ali (2022-08-10). "A Comprehensive Guide to Mastering Economic Indicators". maseconomics. Retrieved 2023-08-10.
- Smith, Charles Emrys, "Economic Indicators", in Wankel, C. (ed.) Encyclopedia of Business in Today's World (2009). California, US.
- Yamarone, Richard (2012). "Indexes of Leading, Lagging, and Coincident Indicators". The Trader's Guide to Key Economic Indicators. John Wiley & Sons, Inc. pp. 47–63. doi:10.1002/9781118532461.ch2. ISBN 9781118532461.
- "State Coincident Indexes". Federal Reserve Bank of Philadelphia. Retrieved 4 October 2010.
- About.com, A Beginner's Guide to Economic Indicators, retrieved November 2009. This was the source of "procyclic", "acyclic", etc., as well as confirmation of "leading", "lagging", etc., and the source of some of the examples.
- "A Fresh Approach To Measuring The Economy". NPR. 2010-04-11. Retrieved 2010-04-20.
External links
- OECD Economic Indicators
- Economic Indicators Mobile App
- U.S. Bureau of Labor Statistics
- The Conference Board - Economic Indicators
- FED101 - Economic Indicators
- International Conference on Indicators and Survey Methodology
- Economic Indicators Monthly analysis from American Institute for Economic Research (AIER)
- U.S. Economic Indicators
- United States Economic Indicators (current and historical, open data) (quandl.com)
- GPO Economic Indicators

