Ethnic and religious composition of Austria-Hungary
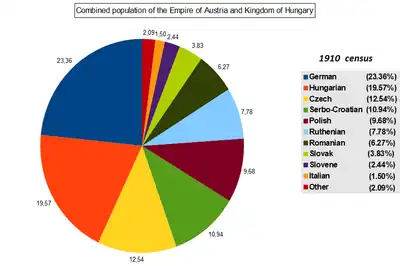
The ethno-linguistic composition of Austria-Hungary according to the census of 31 December 1910 was as follows:[1]
Population

| Area | Number | % |
|---|---|---|
| Cisleithania | 28,571,934 | 55.6 |
| Transleithania | 20,886,487 | 40.6 |
| Bosnia and Herzegovina (Austro-Hungarian condominium) | 1,931,802 | 3.8 |
| Total | 51,390,223 | 100.0 |
Languages


In the Austrian Empire (Cisleithania), the census of 1911 recorded Umgangssprache, everyday language. Jews and those using German in offices often stated German as their Umgangssprache, even when having a different Muttersprache. The Istro-Romanians were counted as Romanians.
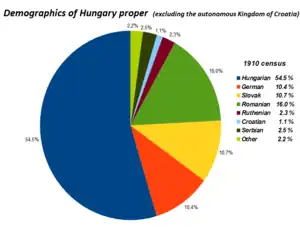
In the Kingdom of Hungary (Transleithania), the census was based primarily on mother tongue,[2][3] 48.1% of the total population spoke Hungarian as their native language. Not counting autonomous Croatia-Slavonia, more than 54.4% of the inhabitants of the Kingdom of Hungary were native speakers of Hungarian. This included also the Jews (around 5% of the population), as mostly they were Hungarian-speaking (the Yiddish speakers were recorded as German).[4][5]
| Language | Number | % |
|---|---|---|
| German | 12,006,521 | 23.36 |
| Hungarian | 10,056,315 | 19.57 |
| Czech | 6,442,133 | 12.54 |
| Serbo-Croatian | 5,621,797 | 10.94 |
| Polish | 4,976,804 | 9.68 |
| Ruthenian | 3,997,831 | 7.78 |
| Romanian | 3,224,147 | 6.27 |
| Slovak | 1,967,970 | 3.83 |
| Slovene | 1,255,620 | 2.44 |
| Italian | 768,422 | 1.50 |
| Other | 1,072,663 | 2.09 |
| Total | 51,390,223 | 100.00 |
Cisleithanian states
| Land | Main language | others (if more than 2%) |
|---|---|---|
| Bohemia | Czech (63.2%) | German (36.8%) |
| Dalmatia | Serbo-Croatian (94.6%) | Italian (2.8%) |
| Galicia | Polish (58.6%) | Ruthenian (40.2%) |
| Lower Austria | German (95.9%) | Czech (3.8%) |
| Upper Austria | German (99.7%) | |
| Bukovina | Ruthenian (38.4%) | Romanian (34.4%), German (21.2%), Polish (4.6%) |
| Carinthia | German (78.6%) | Slovenian (20.7%) |
| Carniola | Slovenian (94.4%) | German (4.9%) |
| Salzburg | German (99.7%) | |
| Austrian Silesia | German (43.9%) | Polish (31.7%), Czech (24.3%) |
| Styria | German (70.5%) | Slovenian (28.4%) |
| Moravia | Czech (71.8%) | German (27.6%) |
| County of Tyrol | German (57.3%) | Italian (42.1%) |
| Austrian Littoral | Italian (39.6%) | Slovenian (29.5%), Serbo-Croatian (18.8%), German (3.1%) |
| Vorarlberg | German (95.4%) | Italian (4.4%) |
Transleithanian lands


| Land | Mother Tongues | others (if more than 2%) |
|---|---|---|
| Kingdom of Hungary | Hungarian (54%) | Romanian (16.1%), Slovak (10.5%), German (10.4%), Ruthenian (2.5%), Serbian (2.5%) |
| Kingdom of Croatia-Slavonia | Croatian (62.5%) | Serbian (24.6%), German (5.0%), Hungarian (4.1%) |
| Land | Hungarian | Romanian | German | Slovak | Croatian | Serbian | Ruthenian | Other | Total |
|---|---|---|---|---|---|---|---|---|---|
| Danube Right Bank | 72% (2,221,295) | 0% (833) | 18% (555,694) | 0.6% (17,188) | 5.5% (168,436) | 0.5% (15,170) | 0% (232) | 3.4% (105,556) | 14.8% (3,084,404) |
| Danube Left Bank | 32.7% (711,654) | 0% (704) | 6.6% (144,395) | 58.8% (1,279,574) | 0.1% (2,294) | 0% (200) | 0% (393) | 1.7% (36,710) | 10.4% (2,175,924) |
| Danube-Tisza | 81.2% (3,061,066) | 0.1% (4,813) | 9.5% (357,822) | 2.1% (79,354) | 0.1% (4,866) | 4.1% (154,298) | 0.3% (11,121) | 4.1% (96,318) | 18% (3,769,658) |
| Tisza Right Bank | 53.5% (945,990) | 0.1% (1,910) | 5.6% (98,564) | 25% (441,776) | 0% (486) | 0% (247) | 14.3% (253,062) | 1.6% (27,646) | 8.5% (1,769,681) |
| Tisza Left Bank | 61.8% (1,603,924) | 24% (621,918) | 3.2% (83,229) | 3.1% (81,154) | 0% (327) | 0% (321) | 7.5% (194,504) | 0.3% (8,547) | 12.4% (2,594,924) |
| Tisza-Maros | 22.2% (474,988) | 39.5% (845,850) | 19.9% (427,253) | 2.1% (44,715) | 0.2% (4,950) | 13.6% (290,434) | 0.1% (3,188) | 2.4% (50,391) | 10.3% (2,141,769) |
| Transylvania | 34.3% (918,217) | 55% (1,472,021) | 8.7% (234,085) | 0.1% (2,404) | 0% (523) | 0% (421) | 0.1% (1,759) | 1.8% (48,937) | 12.8% (2,678,367) |
| Fiume | 13% (6,493) | 0.3% (137) | 4.6% (2,315) | 0.4% (192) | 26% (12,926) | 0.9% (425) | 0% (11) | 54.8 (27,307, mostly Italian) | 0.2% (49,806) |
| Croatia-Slavonia | 4% (105,948) | 0% (846) | 5.1% (134,078) | 0.8% (21,613) | 62.5% (1,638,354) | 24.6% (644,955) | 0.3% (8,317) | 2.6% (67,843) | 12.6% (2,621,954) |
| Total | 48.1% (10,050,575) | 14.1% (2,949,032) | 9.8% (2,037,435) | 9.4% (1,967,970) | 8.8% (1,833,162) | 5.3% (1,106,471) | 2.3% (472,587) | 2.2% (469,255) | 100% (20,886,487) |
Historical regions
| Region | Mother Tongues | Hungarian language | Other languages |
|---|---|---|---|
| Transylvania | Romanian – 2,819,467 (54%) | 1,658,045 (31.7%) | German – 550,964 (10.5%) |
| Upper Hungary | Slovak – 1,688,413 (57.9%) | 881,320 (30.2%) | German – 198,405 (6.8%) |
| Délvidék | Serbo-Croatian – 601,770 (39.8%) | 425,672 (28.1%) | German – 324,017 (21.4%) Romanian – 75,318 (5.0%) Slovak – 56,690 (3.7%) |
| Transcarpathia | Ruthenian – 330,010 (54.5%) | 185,433 (30.6%) | German – 64,257 (10.6%) |
| Fiume | Italian – 24,212 (48.6%) | 6,493 (13%) | Croatian and Serbian – 13,351 (26.8%) Slovene - 2,336 (4.7%) German - 2,315 (4.6%) |
| Őrvidék | German – 217,072 (74.4%) | 26,225 (9%) | Croatian – 43,633 (15%) |
| Muravidék | Slovene – 74,199 (80.4%) – in 1921 | 14,065 (15.2%) – in 1921 | German – 2,540 (2.8%) – in 1921 |
The Germans in Croatia were mainly living in the eastern parts of the country where they had been settled along the Drava and Danube rivers, and the former Military Frontier (Militärgrenze), after the Habsburg (re)conquest of the area from the Ottomans in 1687.
Religions

| Religions/Confessions | in all of Austria-Hungary | Austrian part | Hungarian part | Bosnia and Herzegovina |
|---|---|---|---|---|
| Catholics | 76.6% | 90.9% | 61.8% | 22.9% |
| Protestants | 8.9% | 2.1% | 19% | 0.3% |
| Orthodox | 8.7% | 2.3% | 14.3% | 43.5% |
| Jews | 4.4% | 4.7% | 4.9% | 0.6% |
| Muslims | 1.3% | 0% | 0% | 32.7% |
See also
References
- Volkszählung vom 31. Dezember 1910, veröffentlicht in: Geographischer Atlas zur Vaterlandskunde an der österreichischen Mittelschulen. K. u. k. Hof-Kartographische Anstalt G. Freytag & Berndt, Wien 1911.
- "Magyarország népessége".
- "1910. ÉVI NÉPSZÁMLÁLÁS 1. A népesség főbb adatai községek és népesebb puszták, telepek szerint (1912) | Könyvtár | Hungaricana".
- "N psz ml l sok Erd ly ter let n 1850 s 1910 k z tt". www.bibl.u-szeged.hu. Archived from the original on 2019-02-07.
- A. J. P. Taylor, The Habsburg Monarchy 1809–1918, 1948.
- Fajth, Gáspár; Dr Gyulay, Ferenc; Dr Klinger, András; Dr Harcsa, István; Kamarás, Ferenc; Dr Csahók, István; Dr Ehrlich, Éva (1992). Történeti statisztikai idősorok 1867–1992 I.: Népesség-népmozgalom (in Hungarian). ISBN 9789637070433. Archived from the original on 2 June 2019. Retrieved 3 June 2019.
- William R. Shepherd: "Distribution of Races in Austria-Hungary", Historical Atlas, 1911
Further reading
- Steidl, Annemarie et al. From a Multiethnic Empire to a Nation of Nations: Austro-Hungarian Migrants in the US, 1870–1940 (Innsbruck: Studien Verlag, 2017). 354 pp.