Exeter City Council elections
Exeter City Council is the local authority for Exeter in Devon, England. One third of the council is elected each year, followed by one year without election.
Council elections
- 1973 Exeter City Council election
- 1976 Exeter City Council election
- 1979 Exeter City Council election
- 1983 Exeter City Council election (New ward boundaries)[1]
- 1984 Exeter City Council election
- 1986 Exeter City Council election
- 1987 Exeter City Council election
- 1988 Exeter City Council election (City boundary changes took place but the number of seats remained the same)[2]
- 1990 Exeter City Council election
- 1991 Exeter City Council election
- 1992 Exeter City Council election
- 1994 Exeter City Council election
- 1995 Exeter City Council election
- 1996 Exeter City Council election
- 1998 Exeter City Council election
- 1999 Exeter City Council election
- 2000 Exeter City Council election (New ward boundaries)[3]
- 2002 Exeter City Council election
- 2003 Exeter City Council election
- 2004 Exeter City Council election
- 2006 Exeter City Council election
- 2007 Exeter City Council election
- 2008 Exeter City Council election
- 2010 Exeter City Council election (By-elections in 12 wards were held in September following a High Court ruling)[4]
- 2011 Exeter City Council election
- 2012 Exeter City Council election
- 2014 Exeter City Council election
- 2015 Exeter City Council election
- 2016 Exeter City Council election (New ward boundaries)[5]
- 2018 Exeter City Council election
- 2019 Exeter City Council election
- 2021 Exeter City Council election
- 2022 Exeter City Council election
- 2023 Exeter City Council election
Result maps
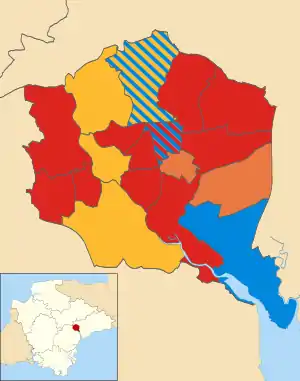 2000 results map
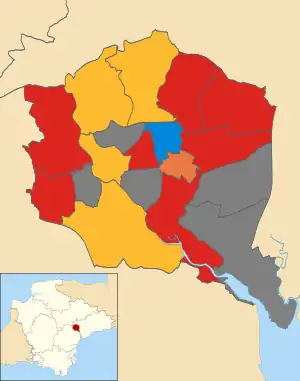 2002 results map
 2003 results map
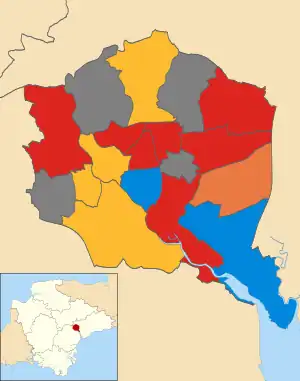 2004 results map
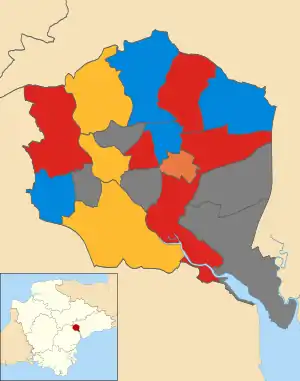 2006 results map
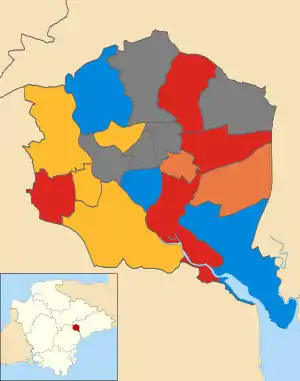 2007 results map
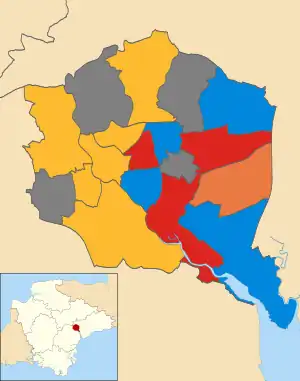 2008 results map
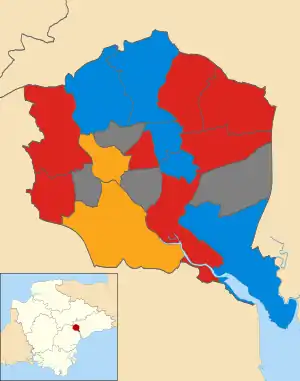 2010 results map
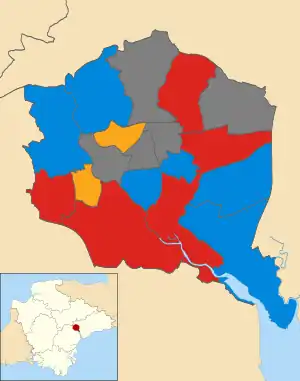 2011 results map
 2012 results map
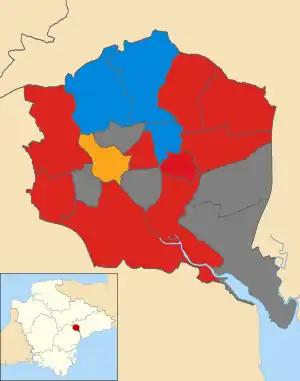 2014 results map
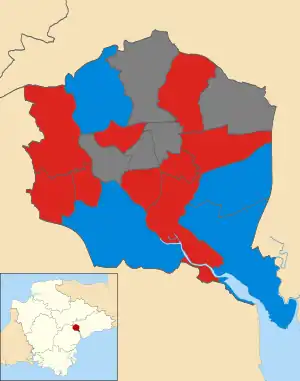 2015 results map
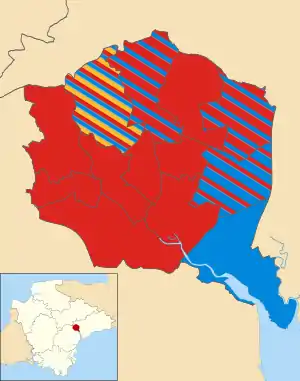 2016 results map
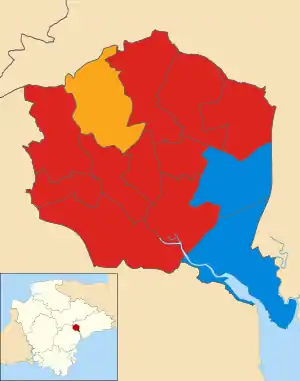 2018 results map
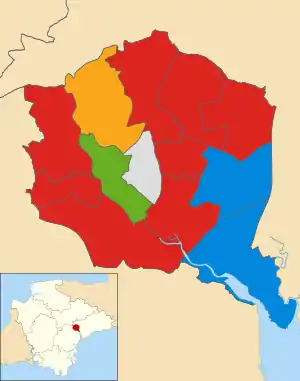 2019 results map
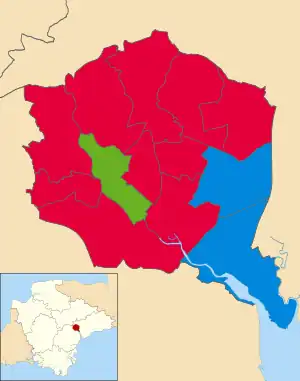 2021 results map
By-election results
| Party | Candidate | Votes | % | ±% | |
|---|---|---|---|---|---|
| Liberal Democrats | Sheila Hobden | 504 | 47.1 | -0.5 | |
| Conservative | Graham Stone | 392 | 36.7 | +4.0 | |
| Labour | Dominic O'Brien | 93 | 8.7 | -2.1 | |
| Green | Isaac Price-Sosner | 80 | 7.5 | -1.4 | |
| Majority | 112 | 10.4 | |||
| Turnout | 1,069 | 25.5 | |||
| Liberal Democrats hold | Swing | ||||
| Party | Candidate | Votes | % | ±% | |
|---|---|---|---|---|---|
| Liberal Democrats | Natalie Cole | 1,171 | 39.6 | +11.5 | |
| Labour | John Poat | 746 | 25.3 | -10.1 | |
| Conservative | Simon Smith | 648 | 21.9 | -0.8 | |
| Green | Isaac Price-Sosner | 389 | 13.2 | +0.9 | |
| Majority | 425 | 14.3 | |||
| Turnout | 2,954 | 60.9 | |||
| Liberal Democrats gain from Labour | Swing | ||||
| Party | Candidate | Votes | % | ±% | |
|---|---|---|---|---|---|
| Liberal Democrats | Alexandra Newcombe | 890 | 45.4 | -9.1 | |
| Conservative | Margaret Jordan | 703 | 35.8 | +8.0 | |
| Labour | Paul Bull | 227 | 11.6 | -6.0 | |
| Green | Andrew Bell | 142 | 7.2 | +7.2 | |
| Majority | 187 | 9.6 | |||
| Turnout | 1,962 | 30.4 | |||
| Liberal Democrats hold | Swing | ||||
| Party | Candidate | Votes | % | ±% | |
|---|---|---|---|---|---|
| Liberal Democrats | Timothy Payne | 1,391 | |||
| Conservative | David Thompson | 913 | |||
| Labour | Bernard Dugdale | 491 | |||
| UKIP | David Smith | 152 | |||
| Green | Isaac Price-Sosner | 88 | |||
| Majority | |||||
| Turnout | 3,058 | 71.57% | |||
| Liberal Democrats hold | Swing | ||||
| Party | Candidate | Votes | % | ±% | |
|---|---|---|---|---|---|
| Conservative | Cynthia Thompson | 755 | |||
| Labour | David Harvey | 749 | |||
| UKIP | Alison Sheridan | 143 | |||
| Liberal Democrats | Michael Payne | 63 | |||
| Green | John Moreman | 62 | |||
| Independent | David Smith | 11 | |||
| Majority | |||||
| Turnout | 1,758 | 34.72% | |||
| Conservative hold | Swing | ||||
| Party | Candidate | Votes | % | ±% | |
|---|---|---|---|---|---|
| Labour | Heather Morris | 1,376 | |||
| Liberal Democrats | Adrian Fullam | 863 | |||
| Conservative | Alexandre Pierre-Traves | 628 | |||
| Green | Joseph Levy | 197 | |||
| UKIP | Alison Sheridan | 73 | |||
| Majority | |||||
| Turnout | 3,144 | 42.43% | |||
| Labour hold | Swing | ||||
0
| Party | Candidate | Votes | % | ±% | |
|---|---|---|---|---|---|
| Conservative | Keith Sparkes | 2,315 | 42.5% | -4.5% | |
| Labour | Ivan Jordan | 1,713 | 31% | +1.1% | |
| Liberal Democrats | Christine Campion | 1,106 | 20% | +14.7 | |
| For Britain | Frankie Rufolo | 245 | 4.5% | +4.5% | |
| Majority | |||||
| Turnout | 5442 | 73.97% | |||
| Conservative hold | Swing | ||||
References
- "The City of Exeter (Electoral Arrangements) Order 1979". legislation.gov.uk. Retrieved 19 November 2015.
- "The Devon (District Boundaries) Order 1987". legislation.gov.uk. Retrieved 6 November 2015.
- "The City of Exeter (Electoral Changes) Order 1999". legislation.gov.uk. Retrieved 4 October 2015.
- "September by-elections for Exeter and Norwich". BBC. Retrieved 3 May 2016.
- "The Exeter (Electoral Changes) Order 2016". legislation.gov.uk. Retrieved 20 April 2016.
- "Election of City Councillorsfor the Wards of Exeter City Council Summary of Results" (PDF). Exeter City Council. 6 May 2010.
- "Election of City Councillorsfor the Wards of Exeter City Council Summary of Results" (PDF). Exeter City Council. 13 August 2015.
- "Election of City Councillorsfor the Wards of Exeter City Council Summary of Results" (PDF). Exeter City Council. 4 May 2017.
- "Election of City Councillorsfor the Wards of Exeter City Council Summary of Results". Exeter City Council. 13 December 2019.
External links
This article is issued from Wikipedia. The text is licensed under Creative Commons - Attribution - Sharealike. Additional terms may apply for the media files.