Experiment, Georgia
Experiment is a census-designated place (CDP) in Spalding County, Georgia, United States. The population was 3,233 at the 2000 census.
Experiment, Georgia | |
|---|---|
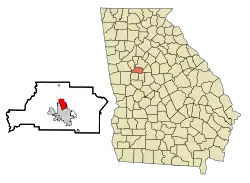 Location in Spalding County and the state of Georgia | |
| Coordinates: 33°16′28″N 84°16′29″W | |
| Country | United States |
| State | Georgia |
| County | Spalding |
| Area | |
| • Total | 2.98 sq mi (7.72 km2) |
| • Land | 2.97 sq mi (7.70 km2) |
| • Water | 0.01 sq mi (0.02 km2) |
| Elevation | 945 ft (288 m) |
| Population (2020) | |
| • Total | 3,328 |
| • Density | 1,119.41/sq mi (432.17/km2) |
| Time zone | UTC-5 (Eastern (EST)) |
| • Summer (DST) | UTC-4 (EDT) |
| ZIP code | 30212 |
| Area code | 770 |
| FIPS code | 13-28296[2] |
| GNIS feature ID | 0331680[3] |
History
Experiment is named for the University of Georgia Agricultural Experiment Station located there.[4] Experiment has been noted for its unusual place name.[5]
The community was heavily damaged by an EF3 tornado on January 12, 2023. The tornado injured 18 people along its path.[6]
Geography
Experiment is located at 33°16′28″N 84°16′29″W (33.274505, -84.274758),[7] immediately north of Griffin and approximately 30 miles (48.3 km) south-southeast of Atlanta.
According to the United States Census Bureau, the CDP has a total area of 3.0 square miles (7.8 km2), all land.
Climate
| Climate data for Experiment, Georgia, 1991–2020 normals, extremes 1900–2004 | |||||||||||||
|---|---|---|---|---|---|---|---|---|---|---|---|---|---|
| Month | Jan | Feb | Mar | Apr | May | Jun | Jul | Aug | Sep | Oct | Nov | Dec | Year |
| Record high °F (°C) | 79 (26) |
89 (32) |
88 (31) |
93 (34) |
97 (36) |
103 (39) |
104 (40) |
101 (38) |
103 (39) |
96 (36) |
86 (30) |
79 (26) |
104 (40) |
| Average high °F (°C) | 55.6 (13.1) |
59.0 (15.0) |
66.8 (19.3) |
74.1 (23.4) |
81.2 (27.3) |
87.3 (30.7) |
89.8 (32.1) |
88.5 (31.4) |
83.9 (28.8) |
75.0 (23.9) |
65.8 (18.8) |
58.0 (14.4) |
73.7 (23.2) |
| Daily mean °F (°C) | 45.0 (7.2) |
47.7 (8.7) |
55.5 (13.1) |
62.1 (16.7) |
70.2 (21.2) |
76.6 (24.8) |
79.4 (26.3) |
78.2 (25.7) |
73.7 (23.2) |
63.6 (17.6) |
54.0 (12.2) |
47.2 (8.4) |
62.8 (17.1) |
| Average low °F (°C) | 34.3 (1.3) |
36.5 (2.5) |
44.3 (6.8) |
50.1 (10.1) |
59.1 (15.1) |
66.0 (18.9) |
69.0 (20.6) |
68.0 (20.0) |
63.5 (17.5) |
52.2 (11.2) |
42.1 (5.6) |
36.4 (2.4) |
51.8 (11.0) |
| Record low °F (°C) | −8 (−22) |
5 (−15) |
11 (−12) |
25 (−4) |
35 (2) |
44 (7) |
51 (11) |
51 (11) |
35 (2) |
26 (−3) |
5 (−15) |
0 (−18) |
−8 (−22) |
| Average precipitation inches (mm) | 5.27 (134) |
4.32 (110) |
5.08 (129) |
4.04 (103) |
3.71 (94) |
4.91 (125) |
5.07 (129) |
5.08 (129) |
4.39 (112) |
3.31 (84) |
4.01 (102) |
5.00 (127) |
54.19 (1,378) |
| Average snowfall inches (cm) | 1.1 (2.8) |
0.0 (0.0) |
0.1 (0.25) |
0.0 (0.0) |
0.0 (0.0) |
0.0 (0.0) |
0.0 (0.0) |
0.0 (0.0) |
0.0 (0.0) |
0.0 (0.0) |
0.0 (0.0) |
0.0 (0.0) |
1.2 (3.05) |
| Average precipitation days (≥ 0.01 in) | 11.7 | 10.2 | 10.4 | 9.2 | 9.0 | 12.7 | 11.8 | 10.2 | 7.7 | 7.5 | 9.2 | 11.1 | 120.7 |
| Average snowy days (≥ 0.1 in) | 0.2 | 0.0 | 0.1 | 0.0 | 0.0 | 0.0 | 0.0 | 0.0 | 0.0 | 0.0 | 0.0 | 0.0 | 0.3 |
| Source 1: NOAA (snow/snow days 1981–2010)[8][9] | |||||||||||||
| Source 2: National Weather Service[10] | |||||||||||||
Demographics
| Census | Pop. | Note | %± |
|---|---|---|---|
| 2000 | 3,233 | — | |
| 2010 | 2,894 | −10.5% | |
| 2020 | 3,328 | 15.0% | |
| U.S. Decennial Census[11] | |||
2020 census
| Race / ethnicity | Pop. 2010[12] | Pop. 2020[13] | % 2010 | % 2020 |
|---|---|---|---|---|
| White alone (NH) | 1,220 | 967 | 42.16% | 29.06% |
| Black or African American alone (NH) | 1,504 | 2,024 | 51.97% | 60.82% |
| Native American or Alaska Native alone (NH) | 10 | 4 | 0.35% | 0.12% |
| Asian alone (NH) | 4 | 11 | 0.14% | 0.33% |
| Pacific Islander alone (NH) | 5 | 0 | 0.17% | 0.00% |
| Some other race alone (NH) | 4 | 7 | 0.14% | 0.21% |
| Mixed-race/multi-racial (NH) | 35 | 113 | 1.21% | 3.40% |
| Hispanic or Latino (any race) | 112 | 202 | 3.87% | 6.07% |
| Total | 2,894 | 3,328 | 100.00% | 100.00% |
As of the census[2] of 2000, there were 3,233 people, 1,163 households, and 839 families residing in the CDP. The population density was 1,063.4 inhabitants per square mile (410.6/km2). There were 1,259 housing units at an average density of 414.1 per square mile (159.9/km2). The racial makeup of the CDP was 45.50% White, 52.55% African American, 0.15% Native American, 0.03% Asian, 0.53% from other races, and 1.24% from two or more races. Hispanic or Latino people of any race were 1.24% of the population.
There were 1,163 households, out of which 34.7% had children under the age of 18 living with them, 35.9% were married couples living together, 30.4% had a female householder with no husband present, and 27.8% were non-families. 23.7% of all households were made up of individuals, and 11.1% had someone living alone who was 65 years of age or older. The average household size was 2.72 and the average family size was 3.16.
In the CDP, the population was spread out, with 30.6% under the age of 18, 10.1% from 18 to 24, 25.1% from 25 to 44, 20.2% from 45 to 64, and 14.1% who were 65 years of age or older. The median age was 31 years. For every 100 females, there were 82.0 males. For every 100 females age 18 and over, there were 74.0 males.
The median income for a household in the CDP was $25,078, and the median income for a family was $27,139. Males had a median income of $27,447 versus $19,194 for females. The per capita income for the CDP was $11,255. About 26.9% of families and 26.2% of the population were below the poverty line, including 41.2% of those under age 18 and 3.5% of those age 65 or over.
References
- "2020 U.S. Gazetteer Files". United States Census Bureau. Retrieved December 18, 2021.
- "U.S. Census website". United States Census Bureau. Retrieved January 31, 2008.
- "US Board on Geographic Names". United States Geological Survey. October 25, 2007. Retrieved January 31, 2008.
- Moyer, Armond; Moyer, Winifred (1958). The origins of unusual place-names. Keystone Pub. Associates. p. 46.
- "The Oddest Named Town in Every State". The Active Times. April 19, 2018. Retrieved July 3, 2019.
- "January 12, 2023 Tornado Outbreak". www.weather.gov. National Weather Service Peachtree City GA. Retrieved January 21, 2023.
- "US Gazetteer files: 2010, 2000, and 1990". United States Census Bureau. February 12, 2011. Retrieved April 23, 2011.
- "U.S. Climate Normals Quick Access – Station: Experiment, GA (1991–2020)". National Oceanic and Atmospheric Administration. Retrieved February 27, 2023.
- "U.S. Climate Normals Quick Access – Station: Experiment, GA (1981–2010)". National Oceanic and Atmospheric Administration. Retrieved February 27, 2023.
- "NOAA Online Weather Data – NWS Atlanta". National Weather Service. Retrieved February 27, 2023.
- "Census of Population and Housing". Census.gov. Retrieved June 4, 2016.
- "P2 HISPANIC OR LATINO, AND NOT HISPANIC OR LATINO BY RACE – 2010: DEC Redistricting Data (PL 94-171) – Experiment CDP, Georgia". United States Census Bureau.
- "P2 HISPANIC OR LATINO, AND NOT HISPANIC OR LATINO BY RACE – 2020: DEC Redistricting Data (PL 94-171) – Experiment CDP, Georgia". United States Census Bureau.
External links
Municipalities and communities of Spalding County, Georgia, United States | ||
|---|---|---|
| Cities | 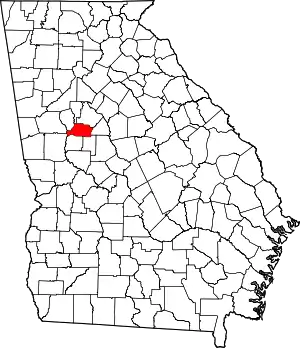 Map of Georgia highlighting Spalding County | |
| Town | ||
| CDPs | ||
| Unincorporated communities | ||
| Footnotes | ‡This populated place also has portions in an adjacent county or counties | |