Florida's 7th congressional district
Florida's 7th congressional district is a congressional district in the north central portion of the U.S. state of Florida.
| Florida's 7th congressional district | |||
|---|---|---|---|
Interactive map of district boundaries since January 3, 2023 | |||
| Representative |
| ||
| Area | 436[1] sq mi (1,130 km2) | ||
| Distribution |
| ||
| Population (2022) | 788,222[3] | ||
| Median household income | $75,437[3] | ||
| Ethnicity |
| ||
| Cook PVI | R+5[4] | ||
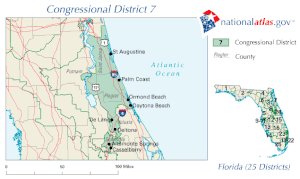
From 2003 to 2013, the district consisted of the suburban area between Orlando and Daytona Beach and included St. Augustine. The district included all of Flagler and St. Johns Counties; a very small portion of eastern Putnam County; parts of Volusia County, including portions of DeLand, Deltona, Ormond Beach, and Daytona Beach; much of western Seminole County; and a small, predominantly suburban portion of Orange County.
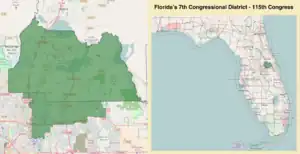
Following court-ordered redistricting in 2015, the district included all of Seminole County and northern Orange County, including much of downtown and northern Orlando and the cities of Maitland and Winter Park. At the time, the district was also home to the University of Central Florida (UCF), the state's largest university by student population in 2020-2021.[5]
Following further redistricting in 2022 based on the 2020 United States census, the 7th district still includes all of Seminole County. It now includes the southern half of Volusia County, while the portion of the district that extended into Orange County, including UCF, is now part of the 10th congressional district.
The district is currently represented in the U.S. Congress by Rep. Cory Mills.
Voting
Presidential
Results from previous presidential elections
| Year | Office | Results |
|---|---|---|
| 2000 | President | George W. Bush 53% - Al Gore 45% |
| 2004 | President | George W. Bush 57% - John Kerry 43% |
| 2008 | President | John McCain 53% - Barack Obama 45% |
| 2012 | President | Barack Obama 49.4% - Mitt Romney 49.4% |
| 2016 | President | Hillary Clinton 50.8% - Donald Trump 43.6% |
| 2020 | President | Joe Biden 54.6% - Donald Trump 44.2% |
Non-presidential
Results from previous non-presidential statewide elections
| Year | Office | Results |
|---|---|---|
| 2016 | Senate | Marco Rubio 48.2% - Patrick Murphy 45.5% |
| 2018 | Senate | Bill Nelson 55.2% - Rick Scott 44.8% |
| 2018 | Governor | Andrew Gillum 54.6% - Ron DeSantis 44.2% |
| 2018 | Attorney General | Sean Shaw 50.3% - Ashley Moody 47.7% |
List of members representing the district
Electoral history
2002
| Party | Candidate | Votes | % | |
|---|---|---|---|---|
| Republican | John L. Mica* | 142,147 | 59.58 | |
| Democratic | Wayne Hogan | 96,444 | 40.42 | |
| Total votes | 238,591 | 100.00 | ||
| Republican hold | ||||
2004
| Party | Candidate | Votes | % | |
|---|---|---|---|---|
| Republican | John L. Mica* | 100.00 | ||
| Total votes | 100.00 | |||
| Republican hold | ||||
2006
| Party | Candidate | Votes | % | |
|---|---|---|---|---|
| Republican | John L. Mica* | 149,656 | 59.88 | |
| Democratic | John F. Chagnon | 87,584 | 36.92 | |
| Total votes | 237,240 | 100.00 | ||
| Republican hold | ||||
2008
| Party | Candidate | Votes | % | |
|---|---|---|---|---|
| Republican | John L. Mica* | 238,721 | 62.00 | |
| Democratic | Faye Armitage | 146,292 | 38.00 | |
| Total votes | 385,013 | 100.00 | ||
| Republican hold | ||||
2010
| Party | Candidate | Votes | % | |
|---|---|---|---|---|
| Republican | John L. Mica* | 185,470 | 69.03 | |
| Democratic | Heather Beaven | 83,206 | 30.97 | |
| Total votes | 268,676 | 100.00 | ||
| Republican hold | ||||
2012
| Party | Candidate | Votes | % | |
|---|---|---|---|---|
| Republican | John Mica (Incumbent) | 185,518 | 58.7 | |
| Democratic | Jason H. Kenall | 130,479 | 41.3 | |
| Write-in | Fred Marra | 13 | 0.0 | |
| Total votes | 316,010 | 100.0 | ||
| Republican hold | ||||
2014
| Party | Candidate | Votes | % | |
|---|---|---|---|---|
| Republican | John Mica (Incumbent) | 144,474 | 63.60 | |
| Democratic | Wes Neuman | 73,011 | 32.14 | |
| No Party Affiliation | Al Krulick | 9,679 | 4.26 | |
| Total votes | 227,164 | 100.00 | ||
| Republican hold | ||||
2016
| Party | Candidate | Votes | % | |
|---|---|---|---|---|
| Democratic | Stephanie Murphy | 182,039 | 51.47 | |
| Republican | John Mica (Incumbent) | 171,583 | 48.52 | |
| No Party Affiliation | Mike Plaskon | 33 | 0.01 | |
| Total votes | 353,655 | 100 | ||
| Democratic gain from Republican | ||||
2018
| Party | Candidate | Votes | % | |
|---|---|---|---|---|
| Democratic | Stephanie Murphy (Incumbent) | 183,113 | 57.7 | |
| Republican | Mike Miller | 134,285 | 42.3 | |
| Total votes | 317,398 | 100.00 | ||
| Democratic hold | ||||
2020
| Party | Candidate | Votes | % | |
|---|---|---|---|---|
| Democratic | Stephanie Murphy (Incumbent) | 224,946 | 55.34 | |
| Republican | Leo Valentín | 175,750 | 43.24 | |
| No Party Affiliation | William Garlington | 5,753 | 1.42 | |
| Total votes | 406,449 | 100.00 | ||
| Democratic hold | ||||
2022
| Party | Candidate | Votes | % | |
|---|---|---|---|---|
| Republican | Cory Mills | 177,966 | 58.53 | |
| Democratic | Karen Green | 126,079 | 41.47 | |
| Independent | Cardon Pompey (write-in) | 10 | <0.01 | |
| Total votes | 304,045 | 100.00 | ||
| Republican gain from Democratic | ||||
References
- "Congressional Plan--SC14-1905 (Ordered by The Florida Supreme Court, 2-December-2015)" (PDF). Florida Senate Committee on Reapportionment. Retrieved January 11, 2017.
- "Congressional Districts Relationship Files (State-based)". U.S. Census Bureau. Archived from the original on April 2, 2013. Retrieved February 7, 2018.
- "My Congressional District".
- "2022 Cook PVI: District Map and List". Cook Political Report. Retrieved January 10, 2023.
- "UCF Facts 2020-2021 | University of Central Florida - Orlando, FL". University of Central Florida. Retrieved March 21, 2021.
- Martis, Kenneth C. (1989). The Historical Atlas of Political Parties in the United States Congress. New York: Macmillan Publishing Company.
- Martis, Kenneth C. (1982). The Historical Atlas of United States Congressional Districts. New York: Macmillan Publishing Company.
- Congressional Biographical Directory of the United States 1774–present
.svg.png.webp)


.tif.jpg.webp)


.svg.png.webp)