Faaborg (nomination district)
Faaborg nominating district is one of the 92 nominating districts that exists for Danish elections following the 2007 municipal reform.[3][4][5] It consists of Faaborg and Ærø municipality.[6] It was created in 1849[7] as a constituency, and has been a nomination district since 1920, though its boundaries have been changed since then. Between 1915 and 1970 it was known as Ærøskøbing-Fåborg.[8]
| Faaborg | |
|---|---|
| Faaborg | |
| Nomination district constituency for the Folketing | |
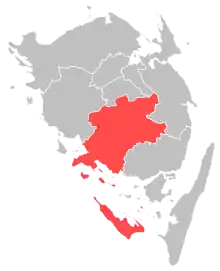 Location of Faaborg within Funen | |
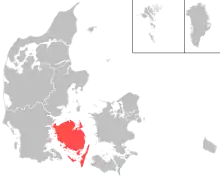 Location of Funen within Denmark | |
| Municipalities | Faaborg-Midtfyn Ærø |
| Constituency | Funen |
| Electorate | 43,974 (2022)[1] |
| Current constituency | |
| Created | 1849 (as constituency)[2] 1920 (as nomination district) |
In general elections, the district tends to vote close to the national result when looking at the voting split between the two blocs.[9]
General elections results
General elections in the 2020s
| Parties | Vote | |||||
|---|---|---|---|---|---|---|
| Votes | % | + / - | ||||
| Social Democrats | 12,218 | 33.43 | +4.24 | |||
| Venstre | 4,667 | 12.77 | -14.29 | |||
| Denmark Democrats | 4,127 | 11.29 | New | |||
| Moderates | 3,470 | 9.49 | New | |||
| Green Left | 2,586 | 7.08 | +0.84 | |||
| Liberal Alliance | 1,870 | 5.12 | +3.84 | |||
| Conservatives | 1,735 | 4.75 | -1.05 | |||
| New Right | 1,477 | 4.04 | +2.14 | |||
| Red–Green Alliance | 1,400 | 3.83 | -2.16 | |||
| Danish People's Party | 1,065 | 2.91 | -7.68 | |||
| The Alternative | 878 | 2.40 | -0.29 | |||
| Social Liberals | 779 | 2.13 | -3.31 | |||
| Christian Democrats | 141 | 0.39 | -0.76 | |||
| Independent Greens | 99 | 0.27 | New | |||
| Millah Kongsbach | 39 | 0.11 | New | |||
| Total | 36,551 | |||||
| Source[10] | ||||||
General elections in the 2010s
| Parties | Vote | |||||
|---|---|---|---|---|---|---|
| Votes | % | + / - | ||||
| Social Democrats | 10,697 | 29.19 | +2.46 | |||
| Venstre | 9,915 | 27.06 | +5.08 | |||
| Danish People's Party | 3,882 | 10.59 | -12.67 | |||
| Green Left | 2,285 | 6.24 | +2.24 | |||
| Red–Green Alliance | 2,195 | 5.99 | -1.26 | |||
| Conservatives | 2,124 | 5.80 | +1.54 | |||
| Social Liberals | 1,994 | 5.44 | +2.65 | |||
| The Alternative | 986 | 2.69 | -1.46 | |||
| New Right | 696 | 1.90 | New | |||
| Stram Kurs | 667 | 1.82 | New | |||
| Liberal Alliance | 469 | 1.28 | -3.95 | |||
| Christian Democrats | 422 | 1.15 | +0.79 | |||
| Klaus Riskær Pedersen Party | 313 | 0.85 | New | |||
| Total | 36,645 | |||||
| Source[11] | ||||||
| Parties | Vote | |||||
|---|---|---|---|---|---|---|
| Votes | % | + / - | ||||
| Social Democrats | 9,985 | 26.73 | +0.17 | |||
| Danish People's Party | 8,691 | 23.26 | +10.26 | |||
| Venstre | 8,211 | 21.98 | -6.78 | |||
| Red–Green Alliance | 2,710 | 7.25 | +1.87 | |||
| Liberal Alliance | 1,955 | 5.23 | +1.58 | |||
| Conservatives | 1,590 | 4.26 | -0.53 | |||
| The Alternative | 1,549 | 4.15 | New | |||
| Green Left | 1,493 | 4.00 | -5.31 | |||
| Social Liberals | 1,041 | 2.79 | -5.25 | |||
| Christian Democrats | 136 | 0.36 | -0.11 | |||
| Total | 37,361 | |||||
| Source[12] | ||||||
| Parties | Vote | |||||
|---|---|---|---|---|---|---|
| Votes | % | + / - | ||||
| Venstre | 11,075 | 28.76 | +2.41 | |||
| Social Democrats | 10,228 | 26.56 | +1.71 | |||
| Danish People's Party | 5,005 | 13.00 | -2.05 | |||
| Green Left | 3,586 | 9.31 | -3.18 | |||
| Social Liberals | 3,096 | 8.04 | +3.07 | |||
| Red–Green Alliance | 2,070 | 5.38 | +3.93 | |||
| Conservatives | 1,844 | 4.79 | -7.35 | |||
| Liberal Alliance | 1,405 | 3.65 | +1.32 | |||
| Christian Democrats | 180 | 0.47 | +0.12 | |||
| Lars Grønbæk Larsen | 12 | 0.03 | New | |||
| Michael Ellegård | 6 | 0.02 | 0.00 | |||
| Total | 38,507 | |||||
| Source[13] | ||||||
General elections in the 2000s
| Parties | Vote | |||||
|---|---|---|---|---|---|---|
| Votes | % | + / - | ||||
| Venstre | 10,105 | 26.35 | -3.60 | |||
| Social Democrats | 9,533 | 24.85 | +0.01 | |||
| Danish People's Party | 5,771 | 15.05 | +1.87 | |||
| Green Left | 4,791 | 12.49 | +7.21 | |||
| Conservatives | 4,656 | 12.14 | -2.32 | |||
| Social Liberals | 1,907 | 4.97 | -2.40 | |||
| New Alliance | 892 | 2.33 | New | |||
| Red–Green Alliance | 558 | 1.45 | -1.24 | |||
| Christian Democrats | 134 | 0.35 | -0.64 | |||
| Michael Ellegård | 9 | 0.02 | New | |||
| Total | 38,356 | |||||
| Source[14] | ||||||
| Parties | Vote | |||||
|---|---|---|---|---|---|---|
| Votes | % | + / - | ||||
| Venstre | 8,996 | 29.95 | -1.23 | |||
| Social Democrats | 7,463 | 24.84 | -2.08 | |||
| Conservatives | 4,345 | 14.46 | +0.51 | |||
| Danish People's Party | 3,959 | 13.18 | +1.13 | |||
| Social Liberals | 2,213 | 7.37 | +3.15 | |||
| Green Left | 1,585 | 5.28 | -0.43 | |||
| Red–Green Alliance | 809 | 2.69 | +0.90 | |||
| Centre Democrats | 303 | 1.01 | -1.08 | |||
| Christian Democrats | 296 | 0.99 | -0.52 | |||
| Minority Party | 71 | 0.24 | New | |||
| Total | 30,040 | |||||
| Source[15] | ||||||
| Parties | Vote | |||||
|---|---|---|---|---|---|---|
| Votes | % | + / - | ||||
| Venstre | 9,684 | 31.18 | +2.51 | |||
| Social Democrats | 8,361 | 26.92 | -5.69 | |||
| Conservatives | 4,333 | 13.95 | +3.65 | |||
| Danish People's Party | 3,741 | 12.05 | +4.52 | |||
| Green Left | 1,772 | 5.71 | -0.94 | |||
| Social Liberals | 1,310 | 4.22 | +0.08 | |||
| Centre Democrats | 649 | 2.09 | -2.41 | |||
| Red–Green Alliance | 556 | 1.79 | -0.21 | |||
| Christian People's Party | 470 | 1.51 | -0.31 | |||
| Progress Party | 181 | 0.58 | -0.71 | |||
| Total | 31,057 | |||||
| Source[16] | ||||||
General elections in the 1990s
| Parties | Vote | |||||
|---|---|---|---|---|---|---|
| Votes | % | + / - | ||||
| Social Democrats | 10,119 | 32.61 | -0.58 | |||
| Venstre | 8,895 | 28.67 | +0.07 | |||
| Conservatives | 3,196 | 10.30 | -4.08 | |||
| Danish People's Party | 2,337 | 7.53 | New | |||
| Green Left | 2,063 | 6.65 | +1.08 | |||
| Centre Democrats | 1,397 | 4.50 | +2.27 | |||
| Social Liberals | 1,283 | 4.14 | -0.64 | |||
| Red–Green Alliance | 620 | 2.00 | -0.47 | |||
| Christian People's Party | 564 | 1.82 | +0.76 | |||
| Progress Party | 401 | 1.29 | -6.37 | |||
| Democratic Renewal | 146 | 0.47 | New | |||
| Svend Jensen | 6 | 0.02 | New | |||
| Total | 31,027 | |||||
| Source[17] | ||||||
| Parties | Vote | |||||
|---|---|---|---|---|---|---|
| Votes | % | + / - | ||||
| Social Democrats | 10,075 | 33.19 | +0.63 | |||
| Venstre | 8,683 | 28.60 | +6.54 | |||
| Conservatives | 4,367 | 14.38 | -2.49 | |||
| Progress Party | 2,325 | 7.66 | -0.95 | |||
| Green Left | 1,692 | 5.57 | -0.34 | |||
| Social Liberals | 1,450 | 4.78 | +0.37 | |||
| Red–Green Alliance | 751 | 2.47 | +1.19 | |||
| Centre Democrats | 676 | 2.23 | -1.71 | |||
| Christian People's Party | 323 | 1.06 | -0.28 | |||
| Michael Ellegård | 6 | 0.02 | New | |||
| Leif Nybo | 6 | 0.02 | New | |||
| Else Lundgaard | 3 | 0.01 | New | |||
| Bjørn Henriksen | 3 | 0.01 | New | |||
| Total | 30,360 | |||||
| Source[18] | ||||||
| Parties | Vote | |||||
|---|---|---|---|---|---|---|
| Votes | % | + / - | ||||
| Social Democrats | 9,831 | 32.56 | +7.21 | |||
| Venstre | 6,661 | 22.06 | +4.32 | |||
| Conservatives | 5,094 | 16.87 | -4.22 | |||
| Progress Party | 2,599 | 8.61 | -3.27 | |||
| Green Left | 1,784 | 5.91 | -2.65 | |||
| Social Liberals | 1,332 | 4.41 | -1.63 | |||
| Centre Democrats | 1,190 | 3.94 | +0.35 | |||
| Common Course | 411 | 1.36 | -0.53 | |||
| Christian People's Party | 404 | 1.34 | +0.21 | |||
| Red–Green Alliance | 385 | 1.28 | New | |||
| The Greens | 303 | 1.00 | -0.81 | |||
| Justice Party of Denmark | 189 | 0.63 | New | |||
| Humanist Party | 7 | 0.02 | New | |||
| Mogens Trondhjem | 2 | 0.01 | New | |||
| Tage Abildgart | 1 | 0.00 | New | |||
| Total | 30,193 | |||||
| Source[19] | ||||||
General elections in the 1980s
| Parties | Vote | |||||
|---|---|---|---|---|---|---|
| Votes | % | + / - | ||||
| Social Democrats | 7,948 | 25.35 | +0.06 | |||
| Conservatives | 6,611 | 21.09 | -2.50 | |||
| Venstre | 5,562 | 17.74 | +0.83 | |||
| Progress Party | 3,726 | 11.88 | +5.82 | |||
| Green Left | 2,685 | 8.56 | -1.36 | |||
| Social Liberals | 1,895 | 6.04 | -1.01 | |||
| Centre Democrats | 1,124 | 3.59 | -0.35 | |||
| Common Course | 594 | 1.89 | -0.16 | |||
| The Greens | 568 | 1.81 | +0.17 | |||
| Christian People's Party | 353 | 1.13 | -0.45 | |||
| Communist Party of Denmark | 161 | 0.51 | -0.12 | |||
| Left Socialists | 117 | 0.37 | -0.35 | |||
| Carl Erik Jørgensen | 7 | 0.02 | New | |||
| Total | 31,351 | |||||
| Source[20] | ||||||
| Parties | Vote | |||||
|---|---|---|---|---|---|---|
| Votes | % | + / - | ||||
| Social Democrats | 7,985 | 25.29 | -0.19 | |||
| Conservatives | 7,448 | 23.59 | -2.45 | |||
| Venstre | 5,339 | 16.91 | -3.10 | |||
| Green Left | 3,133 | 9.92 | +2.54 | |||
| Social Liberals | 2,227 | 7.05 | +0.34 | |||
| Progress Party | 1,914 | 6.06 | +2.22 | |||
| Centre Democrats | 1,245 | 3.94 | -1.26 | |||
| Common Course | 647 | 2.05 | New | |||
| The Greens | 518 | 1.64 | New | |||
| Christian People's Party | 499 | 1.58 | -0.38 | |||
| Left Socialists | 227 | 0.72 | -0.85 | |||
| Communist Party of Denmark | 198 | 0.63 | +0.20 | |||
| Justice Party of Denmark | 129 | 0.41 | -0.90 | |||
| Humanist Party | 42 | 0.13 | New | |||
| Henrik Nørregård Nielsen | 7 | 0.02 | New | |||
| Marxist–Leninists Party | 6 | 0.02 | -0.01 | |||
| Socialist Workers Party | 5 | 0.02 | -0.02 | |||
| Total | 31,569 | |||||
| Source[21] | ||||||
| Parties | Vote | |||||
|---|---|---|---|---|---|---|
| Votes | % | + / - | ||||
| Conservatives | 8,354 | 26.04 | +10.81 | |||
| Social Democrats | 8,174 | 25.48 | -1.25 | |||
| Venstre | 6,420 | 20.01 | -0.02 | |||
| Green Left | 2,367 | 7.38 | +0.55 | |||
| Social Liberals | 2,153 | 6.71 | +0.52 | |||
| Centre Democrats | 1,668 | 5.20 | -4.13 | |||
| Progress Party | 1,232 | 3.84 | -6.75 | |||
| Christian People's Party | 630 | 1.96 | +0.42 | |||
| Left Socialists | 504 | 1.57 | +0.24 | |||
| Justice Party of Denmark | 419 | 1.31 | +0.01 | |||
| Communist Party of Denmark | 137 | 0.43 | -0.30 | |||
| Socialist Workers Party | 13 | 0.04 | 0.00 | |||
| Marxist–Leninists Party | 10 | 0.03 | New | |||
| Carl Erik Jørgensen | 5 | 0.02 | New | |||
| Total | 32,086 | |||||
| Source[22] | ||||||
| Parties | Vote | |||||
|---|---|---|---|---|---|---|
| Votes | % | + / - | ||||
| Social Democrats | 7,961 | 26.73 | -4.05 | |||
| Venstre | 5,966 | 20.03 | -1.42 | |||
| Conservatives | 4,535 | 15.23 | +2.36 | |||
| Progress Party | 3,154 | 10.59 | -3.45 | |||
| Centre Democrats | 2,780 | 9.33 | +5.23 | |||
| Green Left | 2,034 | 6.83 | +3.24 | |||
| Social Liberals | 1,845 | 6.19 | +0.42 | |||
| Christian People's Party | 458 | 1.54 | -0.30 | |||
| Left Socialists | 395 | 1.33 | -0.63 | |||
| Justice Party of Denmark | 388 | 1.30 | -1.05 | |||
| Communist Party of Denmark | 216 | 0.73 | -0.34 | |||
| Communist Workers Party | 40 | 0.13 | -0.05 | |||
| Socialist Workers Party | 12 | 0.04 | New | |||
| Anders Bondo Christensen | 0 | 0.00 | New | |||
| Total | 29,784 | |||||
| Source[23] | ||||||
General elections in the 1970s
| Parties | Vote | |||||
|---|---|---|---|---|---|---|
| Votes | % | + / - | ||||
| Social Democrats | 9,338 | 30.78 | +2.37 | |||
| Venstre | 6,507 | 21.45 | -0.03 | |||
| Progress Party | 4,258 | 14.04 | -2.72 | |||
| Conservatives | 3,906 | 12.87 | +2.39 | |||
| Social Liberals | 1,750 | 5.77 | +0.85 | |||
| Centre Democrats | 1,243 | 4.10 | -1.98 | |||
| Green Left | 1,090 | 3.59 | +1.23 | |||
| Justice Party of Denmark | 713 | 2.35 | -0.47 | |||
| Left Socialists | 596 | 1.96 | +0.56 | |||
| Christian People's Party | 559 | 1.84 | -0.98 | |||
| Communist Party of Denmark | 324 | 1.07 | -0.73 | |||
| Communist Workers Party | 54 | 0.18 | New | |||
| Total | 30,338 | |||||
| Source[24] | ||||||
| Parties | Vote | |||||
|---|---|---|---|---|---|---|
| Votes | % | + / - | ||||
| Social Democrats | 8,513 | 28.41 | +6.01 | |||
| Venstre | 6,438 | 21.48 | -13.34 | |||
| Progress Party | 5,022 | 16.76 | +2.99 | |||
| Conservatives | 3,140 | 10.48 | +2.93 | |||
| Centre Democrats | 1,821 | 6.08 | +4.50 | |||
| Social Liberals | 1,473 | 4.92 | -3.47 | |||
| Justice Party of Denmark | 844 | 2.82 | +1.42 | |||
| Christian People's Party | 844 | 2.82 | -1.65 | |||
| Green Left | 708 | 2.36 | -0.19 | |||
| Communist Party of Denmark | 539 | 1.80 | +0.01 | |||
| Left Socialists | 419 | 1.40 | +0.13 | |||
| Pensioners' Party | 207 | 0.69 | New | |||
| Total | 29,968 | |||||
| Source[25] | ||||||
| Parties | Vote | |||||
|---|---|---|---|---|---|---|
| Votes | % | + / - | ||||
| Venstre | 10,322 | 34.82 | +14.06 | |||
| Social Democrats | 6,639 | 22.40 | +4.15 | |||
| Progress Party | 4,082 | 13.77 | -3.65 | |||
| Social Liberals | 2,488 | 8.39 | -5.56 | |||
| Conservatives | 2,238 | 7.55 | -5.29 | |||
| Christian People's Party | 1,324 | 4.47 | +1.41 | |||
| Green Left | 755 | 2.55 | -0.18 | |||
| Communist Party of Denmark | 531 | 1.79 | +0.33 | |||
| Centre Democrats | 467 | 1.58 | -4.64 | |||
| Justice Party of Denmark | 415 | 1.40 | -0.97 | |||
| Left Socialists | 375 | 1.27 | +0.33 | |||
| Oscar Andersen | 1 | 0.00 | New | |||
| Ivan Folmer-Larsen | 1 | 0.00 | New | |||
| Gunner Pedersen | 1 | 0.00 | New | |||
| Hans Clausen Pilegaard | 1 | 0.00 | New | |||
| E. Just Jensen | 0 | 0.00 | New | |||
| Total | 29,640 | |||||
| Source[26] | ||||||
| Parties | Vote | |||||
|---|---|---|---|---|---|---|
| Votes | % | + / - | ||||
| Venstre | 6,111 | 20.76 | -5.12 | |||
| Social Democrats | 5,372 | 18.25 | -10.79 | |||
| Progress Party | 5,128 | 17.42 | New | |||
| Social Liberals | 4,106 | 13.95 | -4.77 | |||
| Conservatives | 3,780 | 12.84 | -4.78 | |||
| Centre Democrats | 1,831 | 6.22 | New | |||
| Christian People's Party | 900 | 3.06 | +1.62 | |||
| Green Left | 804 | 2.73 | -1.47 | |||
| Justice Party of Denmark | 697 | 2.37 | +0.65 | |||
| Communist Party of Denmark | 429 | 1.46 | +0.84 | |||
| Left Socialists | 278 | 0.94 | +0.16 | |||
| Total | 29,436 | |||||
| Source[27] | ||||||
| Parties | Vote | |||||
|---|---|---|---|---|---|---|
| Votes | % | + / - | ||||
| Social Democrats | 8,013 | 29.04 | +3.44 | |||
| Venstre | 7,140 | 25.88 | -6.28 | |||
| Social Liberals | 5,165 | 18.72 | +3.94 | |||
| Conservatives | 4,861 | 17.62 | -3.20 | |||
| Green Left | 1,158 | 4.20 | +1.39 | |||
| Justice Party of Denmark | 474 | 1.72 | +1.06 | |||
| Christian People's Party | 396 | 1.44 | New | |||
| Left Socialists | 215 | 0.78 | +0.11 | |||
| Communist Party of Denmark | 172 | 0.62 | +0.11 | |||
| Total | 27,594 | |||||
| Source[28] | ||||||
General elections in the 1960s
| Parties | Vote | |||||
|---|---|---|---|---|---|---|
| Votes | % | + / - | ||||
| Venstre | 4,524 | 32.16 | -0.95 | |||
| Social Democrats | 3,602 | 25.60 | -5.15 | |||
| Conservatives | 2,929 | 20.82 | +2.09 | |||
| Social Liberals | 2,079 | 14.78 | +6.26 | |||
| Green Left | 396 | 2.81 | -1.22 | |||
| Independent Party | 158 | 1.12 | -1.65 | |||
| Liberal Centre | 122 | 0.87 | -0.42 | |||
| Left Socialists | 94 | 0.67 | New | |||
| Justice Party of Denmark | 93 | 0.66 | +0.15 | |||
| Communist Party of Denmark | 72 | 0.51 | +0.20 | |||
| Total | 14,069 | |||||
| Source[29] | ||||||
| Parties | Vote | |||||
|---|---|---|---|---|---|---|
| Votes | % | + / - | ||||
| Venstre | 4,557 | 33.11 | -1.12 | |||
| Social Democrats | 4,232 | 30.75 | -1.15 | |||
| Conservatives | 2,578 | 18.73 | -1.08 | |||
| Social Liberals | 1,172 | 8.52 | +1.20 | |||
| Green Left | 554 | 4.03 | +2.29 | |||
| Independent Party | 381 | 2.77 | -0.34 | |||
| Liberal Centre | 177 | 1.29 | New | |||
| Justice Party of Denmark | 70 | 0.51 | -0.62 | |||
| Communist Party of Denmark | 42 | 0.31 | -0.01 | |||
| Total | 13,763 | |||||
| Source[30] | ||||||
| Parties | Vote | |||||
|---|---|---|---|---|---|---|
| Votes | % | + / - | ||||
| Venstre | 4,422 | 34.23 | -1.52 | |||
| Social Democrats | 4,122 | 31.90 | +1.72 | |||
| Conservatives | 2,559 | 19.81 | +1.11 | |||
| Social Liberals | 946 | 7.32 | -1.15 | |||
| Independent Party | 402 | 3.11 | -0.34 | |||
| Green Left | 225 | 1.74 | +0.04 | |||
| Justice Party of Denmark | 146 | 1.13 | -0.46 | |||
| Communist Party of Denmark | 41 | 0.32 | +0.15 | |||
| Peace Politics People's Party | 35 | 0.27 | New | |||
| Danish Unity | 22 | 0.17 | New | |||
| Total | 12,920 | |||||
| Source[31] | ||||||
| Parties | Vote | |||||
|---|---|---|---|---|---|---|
| Votes | % | + / - | ||||
| Venstre | 4,510 | 35.75 | -4.02 | |||
| Social Democrats | 3,807 | 30.18 | +2.39 | |||
| Conservatives | 2,359 | 18.70 | +0.53 | |||
| Social Liberals | 1,069 | 8.47 | -0.70 | |||
| Independent Party | 435 | 3.45 | +1.96 | |||
| Green Left | 214 | 1.70 | New | |||
| Justice Party of Denmark | 200 | 1.59 | -1.57 | |||
| Communist Party of Denmark | 22 | 0.17 | -0.29 | |||
| Total | 12,616 | |||||
| Source[32] | ||||||
General elections in the 1950s
| Parties | Vote | |||||
|---|---|---|---|---|---|---|
| Votes | % | + / - | ||||
| Venstre | 5,032 | 39.77 | +0.45 | |||
| Social Democrats | 3,516 | 27.79 | -0.50 | |||
| Conservatives | 2,299 | 18.17 | +0.15 | |||
| Social Liberals | 1,161 | 9.17 | 0.00 | |||
| Justice Party of Denmark | 400 | 3.16 | +0.82 | |||
| Independent Party | 188 | 1.49 | -0.44 | |||
| Communist Party of Denmark | 58 | 0.46 | -0.48 | |||
| Total | 12,654 | |||||
| Source[33] | ||||||
September 1953 Danish Folketing election
| Parties | Vote | |||||
|---|---|---|---|---|---|---|
| Votes | % | + / - | ||||
| Venstre | 4,812 | 39.32 | +31.32 | |||
| Social Democrats | 3,463 | 28.29 | -29.21 | |||
| Conservatives | 2,205 | 18.02 | +13.81 | |||
| Social Liberals | 1,122 | 9.17 | -3.00 | |||
| Justice Party of Denmark | 286 | 2.34 | -13.62 | |||
| Independent Party | 236 | 1.93 | New | |||
| Communist Party of Denmark | 115 | 0.94 | -0.75 | |||
| Total | 12,239 | |||||
| Source[34] | ||||||
April 1953 Danish Folketing election
| Parties | Vote | |||||
|---|---|---|---|---|---|---|
| Votes | % | + / - | ||||
| Social Democrats | 15,176 | 57.50 | +30.15 | |||
| Justice Party of Denmark | 4,212 | 15.96 | +10.75 | |||
| Social Liberals | 3,212 | 12.17 | +2.16 | |||
| Venstre | 2,112 | 8.00 | -27.11 | |||
| Conservatives | 1,110 | 4.21 | -16.92 | |||
| Communist Party of Denmark | 445 | 1.69 | +0.49 | |||
| Danish Unity | 127 | 0.48 | New | |||
| Total | 26,394 | |||||
| Source[35] | ||||||
1950 Danish Folketing election
| Parties | Vote | |||||
|---|---|---|---|---|---|---|
| Votes | % | + / - | ||||
| Venstre | 4,220 | 35.11 | -4.18 | |||
| Social Democrats | 3,287 | 27.35 | -0.99 | |||
| Conservatives | 2,540 | 21.13 | +3.44 | |||
| Social Liberals | 1,203 | 10.01 | +1.26 | |||
| Justice Party of Denmark | 626 | 5.21 | +2.58 | |||
| Communist Party of Denmark | 144 | 1.20 | -1.22 | |||
| Total | 12,020 | |||||
| Source[36] | ||||||
General elections in the 1940s
1947 Danish Folketing election
| Parties | Vote | |||||
|---|---|---|---|---|---|---|
| Votes | % | + / - | ||||
| Venstre | 4,950 | 39.29 | +4.89 | |||
| Social Democrats | 3,570 | 28.34 | +4.65 | |||
| Conservatives | 2,229 | 17.69 | -5.80 | |||
| Social Liberals | 1,103 | 8.75 | -1.38 | |||
| Justice Party of Denmark | 331 | 2.63 | +1.49 | |||
| Communist Party of Denmark | 305 | 2.42 | -2.29 | |||
| Danish Unity | 111 | 0.88 | -1.56 | |||
| Total | 12,599 | |||||
| Source[37] | ||||||
1945 Danish Folketing election
| Parties | Vote | |||||
|---|---|---|---|---|---|---|
| Votes | % | + / - | ||||
| Venstre | 4,362 | 34.40 | +4.33 | |||
| Social Democrats | 3,004 | 23.69 | -4.27 | |||
| Conservatives | 2,979 | 23.49 | -2.67 | |||
| Social Liberals | 1,285 | 10.13 | -1.32 | |||
| Communist Party of Denmark | 597 | 4.71 | New | |||
| Danish Unity | 310 | 2.44 | +1.52 | |||
| Justice Party of Denmark | 144 | 1.14 | -0.25 | |||
| Total | 12,681 | |||||
| Source[38] | ||||||
1943 Danish Folketing election
| Parties | Vote | |||||
|---|---|---|---|---|---|---|
| Votes | % | + / - | ||||
| Venstre | 3,931 | 30.07 | -3.46 | |||
| Social Democrats | 3,655 | 27.96 | +3.00 | |||
| Conservatives | 3,420 | 26.16 | +3.65 | |||
| Social Liberals | 1,497 | 11.45 | -0.64 | |||
| Justice Party of Denmark | 182 | 1.39 | -0.65 | |||
| National Socialist Workers' Party of Denmark | 162 | 1.24 | -0.55 | |||
| Danish Unity | 120 | 0.92 | +0.74 | |||
| Farmers' Party | 107 | 0.82 | -0.86 | |||
| Total | 13,074 | |||||
| Source[39] | ||||||
General elections in the 1930s
1939 Danish Folketing election
| Parties | Vote | |||||
|---|---|---|---|---|---|---|
| Votes | % | + / - | ||||
| Venstre | 3,671 | 33.53 | +3.87 | |||
| Social Democrats | 2,733 | 24.96 | -2.00 | |||
| Conservatives | 2,465 | 22.51 | -3.16 | |||
| Social Liberals | 1,324 | 12.09 | -0.33 | |||
| Justice Party of Denmark | 223 | 2.04 | -0.28 | |||
| National Socialist Workers' Party of Denmark | 196 | 1.79 | +0.74 | |||
| Farmers' Party | 184 | 1.68 | +0.05 | |||
| Communist Party of Denmark | 94 | 0.86 | +0.56 | |||
| National Cooperation | 39 | 0.36 | New | |||
| Danish Unity | 20 | 0.18 | New | |||
| Total | 10,949 | |||||
| Source[40] | ||||||
1935 Danish Folketing election
| Parties | Vote | |||||
|---|---|---|---|---|---|---|
| Votes | % | + / - | ||||
| Venstre | 3,317 | 29.66 | -6.54 | |||
| Social Democrats | 3,015 | 26.96 | +6.56 | |||
| Conservatives | 2,870 | 25.67 | -2.18 | |||
| Social Liberals | 1,389 | 12.42 | -1.18 | |||
| Justice Party of Denmark | 259 | 2.32 | +0.54 | |||
| Independent People's Party | 182 | 1.63 | New | |||
| National Socialist Workers' Party of Denmark | 117 | 1.05 | New | |||
| Communist Party of Denmark | 33 | 0.30 | +0.13 | |||
| Total | 11,182 | |||||
| Source[41] | ||||||
1932 Danish Folketing election
| Parties | Vote | |||||
|---|---|---|---|---|---|---|
| Votes | % | + / - | ||||
| Venstre | 4,219 | 36.20 | -0.33 | |||
| Conservatives | 3,246 | 27.85 | +1.81 | |||
| Social Democrats | 2,377 | 20.40 | +0.16 | |||
| Social Liberals | 1,585 | 13.60 | -2.76 | |||
| Justice Party of Denmark | 207 | 1.78 | +0.98 | |||
| Communist Party of Denmark | 20 | 0.17 | +0.13 | |||
| Total | 11,654 | |||||
| Source[42] | ||||||
General elections in the 1920s
1929 Danish Folketing election
| Parties | Vote | |||||
|---|---|---|---|---|---|---|
| Votes | % | + / - | ||||
| Venstre | 3,939 | 36.53 | +3.24 | |||
| Conservatives | 2,808 | 26.04 | -8.78 | |||
| Social Democrats | 2,182 | 20.24 | +2.84 | |||
| Social Liberals | 1,764 | 16.36 | +2.19 | |||
| Justice Party of Denmark | 86 | 0.80 | +0.52 | |||
| Communist Party of Denmark | 4 | 0.04 | -0.02 | |||
| Total | 10,783 | |||||
| Source[43] | ||||||
1926 Danish Folketing election
| Parties | Vote | |||||
|---|---|---|---|---|---|---|
| Votes | % | + / - | ||||
| Conservatives | 3,662 | 34.82 | +1.38 | |||
| Venstre | 3,501 | 33.29 | +0.80 | |||
| Social Democrats | 1,830 | 17.40 | +0.93 | |||
| Social Liberals | 1,490 | 14.17 | -1.70 | |||
| Justice Party of Denmark | 29 | 0.28 | +0.03 | |||
| Communist Party of Denmark | 6 | 0.06 | -0.02 | |||
| Total | 10,518 | |||||
| Source[44] | ||||||
1924 Danish Folketing election
| Parties | Vote | |||||
|---|---|---|---|---|---|---|
| Votes | % | + / - | ||||
| Conservatives | 3,430 | 33.44 | -0.82 | |||
| Venstre | 3,333 | 32.49 | -5.43 | |||
| Social Democrats | 1,690 | 16.47 | +1.51 | |||
| Social Liberals | 1,628 | 15.87 | +5.13 | |||
| Farmer Party | 143 | 1.39 | New | |||
| Justice Party of Denmark | 26 | 0.25 | New | |||
| Communist Party of Denmark | 8 | 0.08 | New | |||
| Total | 10,258 | |||||
| Source[45] | ||||||
September 1920 Danish Folketing election
| Parties | Vote | |||||
|---|---|---|---|---|---|---|
| Votes | % | + / - | ||||
| Venstre | 3,756 | 37.92 | -2.95 | |||
| Conservatives | 3,393 | 34.26 | -2.27 | |||
| Social Democrats | 1,482 | 14.96 | +3.07 | |||
| Social Liberals | 1,064 | 10.74 | +2.02 | |||
| Industry Party | 204 | 2.06 | +0.07 | |||
| Danish Left Socialist Party | 6 | 0.06 | New | |||
| Total | 9,905 | |||||
| Source[46] | ||||||
July 1920 Danish Folketing election
| Parties | Vote | |||||
|---|---|---|---|---|---|---|
| Votes | % | + / - | ||||
| Venstre | 3,653 | 40.87 | +1.29 | |||
| Conservatives | 3,265 | 36.53 | -1.18 | |||
| Social Democrats | 1,063 | 11.89 | +0.15 | |||
| Social Liberals | 779 | 8.72 | -0.09 | |||
| Industry Party | 178 | 1.99 | -0.17 | |||
| Total | 8,938 | |||||
| Source[47] | ||||||
April 1920 Danish Folketing election
| Parties | Vote | |||||
|---|---|---|---|---|---|---|
| Votes | % | |||||
| Venstre | 3,709 | 39.58 | ||||
| Conservatives | 3,534 | 37.71 | ||||
| Social Democrats | 1,100 | 11.74 | ||||
| Social Liberals | 826 | 8.81 | ||||
| Industry Party | 202 | 2.16 | ||||
| Total | 9,371 | |||||
| Source[48] | ||||||
European Parliament elections results
2019 European Parliament election in Denmark
| Parties | Vote | |||||
|---|---|---|---|---|---|---|
| Votes | % | + / - | ||||
| Social Democrats | 7,085 | 24.55 | +5.06 | |||
| Venstre | 6,778 | 23.49 | +8.69 | |||
| Danish People's Party | 3,433 | 11.90 | -13.96 | |||
| Green Left | 3,340 | 11.58 | +2.72 | |||
| Social Liberals | 2,244 | 7.78 | +3.64 | |||
| Conservatives | 2,063 | 7.15 | -10.56 | |||
| Red–Green Alliance | 1,443 | 5.00 | New | |||
| People's Movement against the EU | 1,244 | 4.31 | -3.17 | |||
| The Alternative | 814 | 2.82 | New | |||
| Liberal Alliance | 411 | 1.42 | -0.23 | |||
| Total | 28,855 | |||||
| Source[49] | ||||||
2014 European Parliament election in Denmark
| Parties | Vote | |||||
|---|---|---|---|---|---|---|
| Votes | % | + / - | ||||
| Danish People's Party | 6,519 | 25.86 | +11.79 | |||
| Social Democrats | 4,913 | 19.49 | -3.62 | |||
| Conservatives | 4,464 | 17.71 | -0.43 | |||
| Venstre | 3,731 | 14.80 | -3.97 | |||
| Green Left | 2,234 | 8.86 | -5.44 | |||
| People's Movement against the EU | 1,886 | 7.48 | +1.77 | |||
| Social Liberals | 1,043 | 4.14 | +1.12 | |||
| Liberal Alliance | 415 | 1.65 | +1.19 | |||
| Total | 25,205 | |||||
| Source[50] | ||||||
2009 European Parliament election in Denmark
| Parties | Vote | |||||
|---|---|---|---|---|---|---|
| Votes | % | + / - | ||||
| Social Democrats | 6,314 | 23.11 | -7.76 | |||
| Venstre | 5,130 | 18.77 | -4.10 | |||
| Conservatives | 4,957 | 18.14 | +4.48 | |||
| Green Left | 3,908 | 14.30 | +7.45 | |||
| Danish People's Party | 3,846 | 14.07 | +7.19 | |||
| People's Movement against the EU | 1,561 | 5.71 | +1.45 | |||
| Social Liberals | 826 | 3.02 | -1.96 | |||
| June Movement | 659 | 2.41 | -6.59 | |||
| Liberal Alliance | 126 | 0.46 | New | |||
| Total | 27,327 | |||||
| Source[51] | ||||||
2004 European Parliament election in Denmark
| Parties | Vote | |||||
|---|---|---|---|---|---|---|
| Votes | % | + / - | ||||
| Social Democrats | 5,403 | 30.87 | +4.34 | |||
| Venstre | 4,003 | 22.87 | -2.68 | |||
| Conservatives | 2,391 | 13.66 | +5.85 | |||
| June Movement | 1,576 | 9.00 | -5.21 | |||
| Danish People's Party | 1,204 | 6.88 | +1.91 | |||
| Green Left | 1,199 | 6.85 | +2.24 | |||
| Social Liberals | 872 | 4.98 | -2.32 | |||
| People's Movement against the EU | 745 | 4.26 | -1.15 | |||
| Christian Democrats | 109 | 0.62 | -0.45 | |||
| Total | 17,502 | |||||
| Source[52] | ||||||
1999 European Parliament election in Denmark
| Parties | Vote | |||||
|---|---|---|---|---|---|---|
| Votes | % | + / - | ||||
| Social Democrats | 5,084 | 26.53 | +5.06 | |||
| Venstre | 4,895 | 25.55 | +1.26 | |||
| June Movement | 2,723 | 14.21 | +1.23 | |||
| Conservatives | 1,496 | 7.81 | -7.69 | |||
| Social Liberals | 1,398 | 7.30 | -0.51 | |||
| People's Movement against the EU | 1,036 | 5.41 | -2.69 | |||
| Danish People's Party | 952 | 4.97 | New | |||
| Green Left | 884 | 4.61 | -1.47 | |||
| Centre Democrats | 489 | 2.55 | +1.89 | |||
| Christian Democrats | 205 | 1.07 | +0.69 | |||
| Progress Party | 86 | 0.45 | -2.30 | |||
| Total | 19,162 | |||||
| Source[53] | ||||||
1994 European Parliament election in Denmark
| Parties | Vote | |||||
|---|---|---|---|---|---|---|
| Votes | % | + / - | ||||
| Venstre | 4,876 | 24.29 | +0.27 | |||
| Social Democrats | 4,310 | 21.47 | -5.18 | |||
| Conservatives | 3,111 | 15.50 | +2.66 | |||
| June Movement | 2,605 | 12.98 | New | |||
| People's Movement against the EU | 1,626 | 8.10 | -3.32 | |||
| Social Liberals | 1,568 | 7.81 | +4.17 | |||
| Green Left | 1,220 | 6.08 | +0.23 | |||
| Progress Party | 552 | 2.75 | -3.27 | |||
| Centre Democrats | 133 | 0.66 | -7.17 | |||
| Christian Democrats | 76 | 0.38 | -1.35 | |||
| Total | 20,077 | |||||
| Source[54] | ||||||
1989 European Parliament election in Denmark
| Parties | Vote | |||||
|---|---|---|---|---|---|---|
| Votes | % | + / - | ||||
| Social Democrats | 4,656 | 26.65 | +9.55 | |||
| Venstre | 4,197 | 24.02 | +2.17 | |||
| Conservatives | 2,244 | 12.84 | -10.78 | |||
| People's Movement against the EU | 1,995 | 11.42 | -3.45 | |||
| Centre Democrats | 1,369 | 7.83 | +0.57 | |||
| Progress Party | 1,052 | 6.02 | +2.99 | |||
| Green Left | 1,023 | 5.85 | +0.56 | |||
| Social Liberals | 636 | 3.64 | -0.77 | |||
| Christian Democrats | 302 | 1.73 | -0.19 | |||
| Total | 17,474 | |||||
| Source[55] | ||||||
1984 European Parliament election in Denmark
| Parties | Vote | |||||
|---|---|---|---|---|---|---|
| Votes | % | |||||
| Conservatives | 4,558 | 23.62 | ||||
| Venstre | 4,217 | 21.85 | ||||
| Social Democrats | 3,300 | 17.10 | ||||
| People's Movement against the EU | 2,870 | 14.87 | ||||
| Centre Democrats | 1,402 | 7.26 | ||||
| Green Left | 1,021 | 5.29 | ||||
| Social Liberals | 852 | 4.41 | ||||
| Progress Party | 585 | 3.03 | ||||
| Christian Democrats | 370 | 1.92 | ||||
| Left Socialists | 125 | 0.65 | ||||
| Total | 19,300 | |||||
| Source[56] | ||||||
Referendums
2022 Danish European Union opt-out referendum[57]
| Option | Votes | % |
|---|---|---|
| ✓ YES | 19,811 | 67.19 |
| X NO | 9,675 | 32.81 |
2015 Danish European Union opt-out referendum[58]
| Option | Votes | % |
|---|---|---|
| X NO | 17,483 | 54.35 |
| ✓ YES | 14,687 | 45.65 |
2014 Danish Unified Patent Court membership referendum[59]
| Option | Votes | % |
|---|---|---|
| ✓ YES | 15,850 | 64.57 |
| X NO | 8,698 | 35.43 |
2009 Danish Act of Succession referendum[60]
| Option | Votes | % |
|---|---|---|
| ✓ YES | 22,079 | 85.41 |
| X NO | 3,772 | 14.59 |
2000 Danish euro referendum[61]
| Option | Votes | % |
|---|---|---|
| X NO | 17,130 | 54.69 |
| ✓ YES | 14,190 | 45.31 |
1998 Danish Amsterdam Treaty referendum[62]
| Option | Votes | % |
|---|---|---|
| ✓ YES | 15,841 | 57.37 |
| X NO | 11,771 | 42.63 |
1993 Danish Maastricht Treaty referendum[63]
| Option | Votes | % |
|---|---|---|
| ✓ YES | 18,672 | 59.65 |
| X NO | 12,631 | 40.35 |
1992 Danish Maastricht Treaty referendum[64]
| Option | Votes | % |
|---|---|---|
| ✓ YES | 15,812 | 52.99 |
| X NO | 14,029 | 47.01 |
1986 Danish Single European Act referendum[65]
| Option | Votes | % |
|---|---|---|
| ✓ YES | 19,232 | 69.24 |
| X NO | 8,543 | 30.76 |
1972 Danish European Communities membership referendum[66]
| Option | Votes | % |
|---|---|---|
| ✓ YES | 21,831 | 74.29 |
| X NO | 7,555 | 25.71 |
1953 Danish constitutional and electoral age referendum[67]
| Option | Votes | % |
|---|---|---|
| ✓ YES | 7,438 | 88.31 |
| X NO | 985 | 11.69 |
| 23 years | 5,006 | 58.67 |
| 21 years | 3,526 | 41.33 |
1939 Danish constitutional referendum[68]
| Option | Votes | % |
|---|---|---|
| ✓ YES | 4,747 | 92.68 |
| X NO | 375 | 7.32 |
References
- "Faaborgkredsen". kmdvalg.dk (in Danish). Retrieved 2023-06-05.
- "Beretning om Forhandlingerne paa Rigsdagen". Rigsdagstidende. II: Spalte 3892 ff.
- "Nye valgkredse fordeler stemmerne anderledes". dr.dk (in Danish). 17 August 2007. Retrieved 2023-06-05.
- "Beretning om nye valgkredse som følge af kommunalreformen" (in Danish). 2 July 2008. Retrieved 2023-06-05.
- "Det danske valgsystem: Valg til Folketinget". valg.im (in Danish). Retrieved 2023-06-05.
- "48 Faaborg". dataforsyningen.dk (in Danish). Retrieved 2023-06-05.
- "Beretning om Forhandlingerne paa Rigsdagen". Rigsdagstidende. II: Spalte 3892 ff.
- "Forslag til Lov om Valg til Rigsdagen". Rigsdagstidende. 1914-15 (første samling): Tillæg C, spalte 1067 ff.
- "Valgresultater fra tidligere valg". kmdvalg (in Danish). Retrieved 2023-06-05.
- "FOLKETINGSVALG TIRSDAG 1. NOVEMBER 2022". valg.im (in Danish). Retrieved 2023-06-27.
- "FOLKETINGSVALG ONSDAG 5. JUNI 2019". valg.im (in Danish). Retrieved 2023-06-27.
- "FOLKETINGSVALG TORSDAG 18. JUNI 2015". valg.im (in Danish). Retrieved 2023-06-27.
- "FOLKETINGSVALG TORSDAG 15. SEPTEMBER 2011". valg.im (in Danish). Retrieved 2023-06-27.
- "Folketingsvalget den 13. november 2007". valg.im (in Danish). Retrieved 2023-06-27.
- "valg2005.book" (PDF). valg.im (in Danish). Retrieved 2023-06-27.
- "BMTABEL" (PDF). valg.im (in Danish). Retrieved 2023-06-27.
- "VALG98" (PDF). valg.im (in Danish). Retrieved 2023-06-27.
- "VALG94" (PDF). valg.im (in Danish). Retrieved 2023-06-27.
- "VALG90" (PDF). valg.im (in Danish). Retrieved 2023-06-27.
- "Folketingsvalget den 10. maj 1988". valg.im (in Danish). Retrieved 2023-06-27.
- "Folketingsvalget den 8.september 1987". dst.dk (in Danish). Retrieved 2023-06-27.
- "Folketingsvalget den 10. januar 1984". dst.dk (in Danish). Retrieved 2023-06-27.
- "Folketingsvalget den 8. december 1981". dst.dk (in Danish). Retrieved 2023-06-27.
- "Folketingsvalget den 23. oktober 1979". dst.dk (in Danish). Retrieved 2023-06-27.
- "Folketingsvalget den 15. februar 1977". dst.dk (in Danish). Retrieved 2023-06-27.
- "Folketingsvalget den 9. januar 1975". dst.dk (in Danish). Retrieved 2023-06-27.
- "Folketingsvalget den 4. december 1973". dst.dk (in Danish). Retrieved 2023-06-27.
- "Folketingsvalget den 21. september 1971 samt folkeafstemningen". dst.dk (in Danish). Retrieved 2023-06-27.
- "Folketingsvalget den 23. januar 1968". dst.dk (in Danish). Retrieved 2023-06-27.
- "Folketingsvalget den 22. november 1966". dst.dk (in Danish). Retrieved 2023-06-27.
- "Folketingsvalget den 22. september 1964". dst.dk (in Danish). Retrieved 2023-06-27.
- "Folketingsvalget den 15. november 1960". dst.dk (in Danish). Retrieved 2023-06-27.
- "Folketingsvalget den 14. maj 1957". dst.dk (in Danish). Retrieved 2023-06-27.
- "Folketingsvalget den 22. september 1953". dst.dk (in Danish). Retrieved 2023-06-27.
- "Rigsdagsvalgene og folkeafstemningerne i april og maj 1953". dst.dk (in Danish). Retrieved 2023-06-27.
- "Folketingsvalget den 5. september 1950". dst.dk (in Danish). Retrieved 2023-06-27.
- "Folketingsvalget den 28. oktober 1947". dst.dk (in Danish). Retrieved 2023-06-27.
- "Rigsdagsvalgene i oktober og november 1945". dst.dk (in Danish). Retrieved 2023-06-27.
- "Rigsdagsvalgene i marts og april 1943". dst.dk (in Danish). Retrieved 2023-06-27.
- "Rigsdagsvalgene og Folkeafstemningen i april og maj 1939". dst.dk (in Danish). Retrieved 2023-06-27.
- "Folketingsvalget den 22. oktober 1935". dst.dk (in Danish). Retrieved 2023-06-27.
- "Folketingsvalget den 16. november 1932". dst.dk (in Danish). Retrieved 2023-06-27.
- "Folketingsvalget den 24. april 1929". dst.dk (in Danish). Retrieved 2023-06-27.
- "Folketingsvalget den 2. december 1926". dst.dk (in Danish). Retrieved 2023-06-27.
- "Folketingsvalget den 11. april 1924". dst.dk (in Danish). Retrieved 2023-06-27.
- "Rigsdagsvalgene september-oktober 1920". dst.dk (in Danish). Retrieved 2023-06-27.
- "Rigsdagsvalgene juli-august 1920". dst.dk (in Danish). Retrieved 2023-06-27.
- "Folketingsvalget den 26. april 1920". dst.dk (in Danish). Retrieved 2023-06-27.
- "EUROPA-PARLAMENTSVALG SØNDAG 26. MAJ 2019". dst.dk (in Danish). Retrieved 2023-07-01.
- "EUROPA-PARLAMENTSVALG SØNDAG 25. MAJ 2014". dst.dk (in Danish). Retrieved 2023-07-01.
- "EUROPA-PARLAMENTSVALG SØNDAG 7. JUNI 2009". dst.dk (in Danish). Retrieved 2023-07-01.
- "EUROPA-PARLAMENTSVALGET DEN 13. JUNI 2004" (PDF). im.dk (in Danish). Retrieved 2023-07-01.
- "VALGET TIL EUROPA-PARLAMENTET DEN 10. JUNI 1999" (PDF). im.dk (in Danish). Retrieved 2023-07-01.
- "VALGET TIL EUROPA-PARLAMENTET DEN 9. JUNI 1994" (PDF). im.dk (in Danish). Retrieved 2023-07-01.
- "Valget til Europa-parlamentet den 15. juni 1989". dst.dk (in Danish). Retrieved 2023-07-01.
- "Valget til Europa-Parlamentet den 14. juni 1984". dst.dk (in Danish). Retrieved 2023-07-01.
- "FOLKEAFSTEMNING ONSDAG 1. JUNI 2022". dst.dk (in Danish). Retrieved 2023-07-05.
- "FOLKEAFSTEMNING TORSDAG 3. DECEMBER 2015". dst.dk (in Danish). Retrieved 2023-07-05.
- "FOLKEAFSTEMNING SØNDAG 25. MAJ 2014". dst.dk (in Danish). Retrieved 2023-07-05.
- "FOLKEAFSTEMNING SØNDAG 7. JUNI 2009". dst.dk (in Danish). Retrieved 2023-07-05.
- "FOLKEAFSTEMNINGEN DEN 28. SEPTEMBER 2000 OM DANMARKS DELTAGELSE I DEN FÆLLES VALUTA" (PDF). valg.im (in Danish). Retrieved 2023-07-05.
- "FOLKEAFSTEMNINGEN DEN 28. MAJ 1998OM DANMARKS TILTRÆDELSE AF AMSTERDAMTRAKTATEN" (PDF). valg.im (in Danish). Retrieved 2023-07-05.
- "FOLKEAFSTEMNINGEN DEN 18. MAJ 1993 OM DANMARKS TILTRÆDELSE AF EDINBURGH-AFGØRELSEN OG MAASTRICHT-TRAKTATEN". dst.dk (in Danish). Retrieved 2023-07-05.
- "Folkeafstemningen den 1. juni 1992 om Danmarks tiltrædelse af traktaten om Den Europæiske Union". dst.dk (in Danish). Retrieved 2023-07-05.
- "Vejledende folkeafstemning torsdag den 27. februar 1986 om Danmarks tiltrædelse af EF- pakken". dst.dk (in Danish). Retrieved 2023-07-05.
- "Folkeafstemningen om Danmarks tiltrædelse af De europæiske Fælleskaber 2. oktober 1972". dst.dk (in Danish). Retrieved 2023-07-05.
- "Publikationsfortegnelse vedrørende Folkeafstemninger". dst.dk (in Danish). Retrieved 2023-07-05.
- "Publikationsfortegnelse vedrørende Folkeafstemninger". dst.dk (in Danish). Retrieved 2023-07-05.