Fenland District Council elections
Fenland District Council in Cambridgeshire, England is elected every four years. Since the last boundary changes in 2023, the council has comprised 43 councillors representing 18 wards, with each ward electing one, two or three councillors.[1]
Fenland rejected the introduction of a directly elected mayor by 17,296 votes to 5,509, on a turnout of just under 34%, in a referendum held in July 2005.[2]
Council elections
| Election | Conservative | Labour | Liberal Democrat[lower-alpha 1] | Green | Others | Total |
|---|---|---|---|---|---|---|
| 1973[3][4] | 20 | 8 | 0 | 0 | 12 | 40 |
| 1976[3][5] | 27 | 8 | 1 | 0 | 4 | 40[lower-alpha 2] |
| 1979[3] | 24 | 6 | 3 | 0 | 7 | 40 |
| 1983[3][6] | 22 | 8 | 6 | 0 | 4 | 40 |
| 1987[3][7] | 25 | 4 | 6 | 0 | 5 | 40 |
| 1991[3][8] | 27 | 6 | 2 | 0 | 5 | 40[lower-alpha 3] |
| 1995[9] | 14 | 21 | 2 | 0 | 3 | 40 |
| 1999[10][11] | 28 | 7 | 1 | 0 | 3 | 40[lower-alpha 4] |
| 2003[12] | 36 | 3 | 0 | 0 | 1 | 40[lower-alpha 5] |
| 2007[13] | 39 | 0 | 0 | 0 | 1 | 40 |
| 2011[14] | 34 | 0 | 2 | 0 | 4 | 40 |
| 2015 | 34 | 0 | 2 | 0 | 3 | 39[lower-alpha 6] |
| 2019[15] | 26 | 0 | 2 | 1 | 10 | 39 |
| 2023[16] | 35 | 0 | 2 | 0 | 6 | 43 |
Composition since 1973
1973
1976
1979
1983
1987
1991
1995
1999
2003
2007
2011
2015
2019
2023
- Notes:
- Liberal Party prior to 1982, SDP-Liberal Alliance from 1982 to 1988.
- New ward boundaries: The District of Fenland (Electoral Arrangements) Order 1975.
- Minor alterations to district boundaries: The Cambridgeshire, Essex, Hertfordshire and Lincolnshire (County Boundaries) Order 1989 and The Cambridgeshire, Norfolk and Suffolk (County Boundaries) Order 1990.
- One seat was left vacant at this election.
- New ward boundaries: The District of Fenland (Electoral Changes) Order 2002.
- New ward boundaries: The Fenland (Electoral Changes) Order 2014.
District result maps
 2003 results map
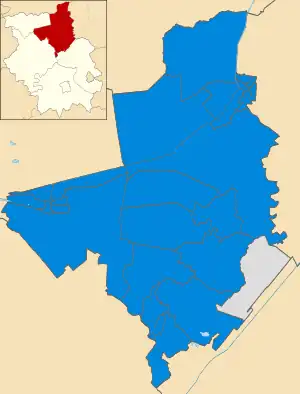 2007 results map
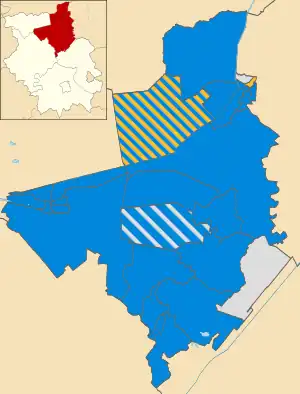 2011 results map
By-election results
1995-1999
| Party | Candidate | Votes | % | ±% | |
|---|---|---|---|---|---|
| Conservative | 278 | 50.1 | |||
| Labour | 133 | 24.0 | |||
| Independent | 98 | 17.6 | |||
| Liberal Democrats | 46 | 8.2 | |||
| Majority | 145 | 26.1 | |||
| Turnout | 555 | 50.6 | |||
| Conservative gain from Labour | Swing | ||||
| Party | Candidate | Votes | % | ±% | |
|---|---|---|---|---|---|
| Conservative | 434 | 56.7 | +10.8 | ||
| Labour | 252 | 32.9 | -21.2 | ||
| Independent | 79 | 10.3 | +10.3 | ||
| Majority | 182 | 23.8 | |||
| Turnout | 765 | 24.4 | |||
| Conservative gain from Labour | Swing | ||||
| Party | Candidate | Votes | % | ±% | |
|---|---|---|---|---|---|
| Labour | 574 | 50.6 | -0.3 | ||
| Conservative | 561 | 49.4 | +0.3 | ||
| Majority | 13 | 1.2 | |||
| Turnout | 1,135 | 27.7 | |||
| Labour hold | Swing | ||||
| Party | Candidate | Votes | % | ±% | |
|---|---|---|---|---|---|
| Labour | 707 | 59.4 | +8.2 | ||
| Conservative | 483 | 40.6 | +10.0 | ||
| Majority | 224 | 18.8 | |||
| Turnout | 1,190 | ||||
| Labour hold | Swing | ||||
1999-2003
| Party | Candidate | Votes | % | ±% | |
|---|---|---|---|---|---|
| Conservative | 298 | 71.8 | +71.8 | ||
| Labour | 57 | 13.7 | -37.3 | ||
| Liberal Democrats | 42 | 10.1 | -38.9 | ||
| Independent Labour | 18 | 4.3 | +4.3 | ||
| Majority | 241 | 58.1 | |||
| Turnout | 415 | 37.6 | |||
| Conservative gain from Labour | Swing | ||||
| Party | Candidate | Votes | % | ±% | |
|---|---|---|---|---|---|
| Labour | 1,596 | 49.6 | |||
| Conservative | 1,366 | 42.4 | |||
| Liberal Democrats | 258 | 8.0 | |||
| Majority | 230 | 7.2 | |||
| Turnout | 3,220 | ||||
| Labour gain from Conservative | Swing | ||||
| Party | Candidate | Votes | % | ±% | |
|---|---|---|---|---|---|
| Conservative | 402 | 49.2 | +2.0 | ||
| Liberal Democrats | 343 | 42.0 | -0.8 | ||
| Labour | 72 | 8.8 | -1.2 | ||
| Majority | 59 | 7.2 | |||
| Turnout | 817 | 25.7 | |||
| Conservative hold | Swing | ||||
| Party | Candidate | Votes | % | ±% | |
|---|---|---|---|---|---|
| Conservative | 546 | 65.4 | +20.5 | ||
| Labour | 289 | 34.6 | +10.1 | ||
| Majority | 257 | 30.8 | |||
| Turnout | 835 | 16.5 | |||
| Conservative hold | Swing | ||||
2003-2007
| Party | Candidate | Votes | % | ±% | |
|---|---|---|---|---|---|
| Conservative | Philip Hatton | 501 | 50.2 | -21.9 | |
| Liberal Democrats | Maddy Forster | 254 | 25.5 | +25.5 | |
| Independent | 155 | 15.5 | +15.5 | ||
| Labour | 88 | 8.8 | -19.1 | ||
| Majority | 247 | 24.7 | |||
| Turnout | 998 | 21.0 | |||
| Conservative hold | Swing | ||||
| Party | Candidate | Votes | % | ±% | |
|---|---|---|---|---|---|
| Conservative | Robert Sears | 264 | 45.0 | ||
| Liberal Democrats | Christopher Howes | 136 | 23.2 | ||
| Independent | Mark Archer | 136 | 23.2 | ||
| Independent | Stephen Wilson | 39 | 6.6 | ||
| Labour | Richard Hibbert | 12 | 2.0 | ||
| Majority | 128 | 21.8 | |||
| Turnout | 587 | 42.1 | |||
| Conservative hold | Swing | ||||
| Party | Candidate | Votes | % | ±% | |
|---|---|---|---|---|---|
| Conservative | Florence Newell | 259 | 57.2 | +17.8 | |
| Liberal Democrats | Christopher Howes | 194 | 42.8 | +12.0 | |
| Majority | 65 | 14.4 | |||
| Turnout | 453 | 26.7 | |||
| Conservative hold | Swing | ||||
2007-2011
| Party | Candidate | Votes | % | ±% | |
|---|---|---|---|---|---|
| Conservative | Phil Wait | 646 | 61.8 | ||
| Labour | Dave Goode | 191 | 18.3 | ||
| Independent | Paul Carpenter | 119 | 11.4 | ||
| UKIP | Paul Clapp | 55 | 5.3 | ||
| Liberal Democrats | Chris Howes | 35 | 3.3 | ||
| Majority | 455 | 43.5 | |||
| Turnout | 1,046 | ||||
| Conservative hold | Swing | ||||
| Party | Candidate | Votes | % | ±% | |
|---|---|---|---|---|---|
| Conservative | Robert Scrimshaw | 512 | 50.6 | ||
| Liberal Democrats | Gavin Booth | 208 | 20.6 | ||
| Labour | Dave Goode | 190 | 18.8 | ||
| Green | Paul Carpenter | 101 | 10.0 | ||
| Majority | 304 | 30.0 | |||
| Turnout | 1,011 | ||||
| Conservative hold | Swing | ||||
| Party | Candidate | Votes | % | ±% | |
|---|---|---|---|---|---|
| Conservative | Steve Count | 803 | 53.9 | -5.2 | |
| Labour | Martin Field | 460 | 29.9 | +29.9 | |
| Liberal Democrats | Ann Elliott | 250 | 16.2 | -24.7 | |
| Majority | 370 | 24.0 | |||
| Turnout | 1,540 | 28 | |||
| Conservative hold | Swing | ||||
| Party | Candidate | Votes | % | ±% | |
|---|---|---|---|---|---|
| Conservative | Robert Chambers | 301 | 45.9 | -11.2 | |
| Liberal Democrats | Christopher Howes | 264 | 40.2 | -2.7 | |
| UKIP | Sandra Rylance | 58 | 8.8 | +8.8 | |
| Labour | Max Kelly | 33 | 5.0 | +5.0 | |
| Majority | 37 | 5.7 | |||
| Turnout | 656 | 31.8 | |||
| Conservative hold | Swing | ||||
| Party | Candidate | Votes | % | ±% | |
|---|---|---|---|---|---|
| Liberal Democrats | Dave Patrick | 287 | 51.3 | ||
| Conservative | Steve Tierney | 145 | 25.9 | ||
| Labour | Barry Diggle | 74 | 13.2 | ||
| UKIP | Paul Clapp | 54 | 9.6 | ||
| Majority | 142 | 25.4 | |||
| Turnout | 560 | 31.1 | |||
| Liberal Democrats gain from Conservative | Swing | ||||
2011-2015
| Party | Candidate | Votes | % | ±% | |
|---|---|---|---|---|---|
| Conservative | David Hodgson | 228 | 42.0 | -13.1 | |
| Labour | John White | 166 | 30.6 | +1.8 | |
| Liberal Democrats | Robert McLaren | 90 | 16.6 | +16.6 | |
| UKIP | Will Schooling | 39 | 7.2 | -8.9 | |
| Independent | Phil Webb | 20 | 3.7 | +3.7 | |
| Majority | 62 | 11.4 | |||
| Turnout | 543 | 28.8 | |||
| Conservative hold | Swing | ||||
This by-election was due to the Conservative incumbent cllr Farmer being disqualified for a firearms offence.[25] This was cllr Tierney's third attempt to win a seat on FDC.
| Party | Candidate | Votes | % | ±% | |
|---|---|---|---|---|---|
| Conservative | Steve Tierney | 257 | 44.6 | ||
| UKIP | Andrew Hunt | 201 | 34.9 | ||
| Labour | Kathy Dougall | 79 | 13.7 | ||
| Liberal Democrats | Josie Ratcliffe | 24 | 4.2 | ||
| Independent | Erbie Murat | 15 | 2.6 | ||
| Majority | 56 | ||||
| Turnout | 576 | ||||
| Conservative hold | Swing | ||||
2019-2023
| Party | Candidate | Votes | % | ±% | |
|---|---|---|---|---|---|
| Conservative | Jason Mockett | 449 | 62.71 | ||
| Labour | Jes Hibbert | 267 | 37.29 | ||
| Majority | 716 | ||||
| Turnout | |||||
| Conservative hold | Swing | ||||
References
- "The Fenland (Electoral Changes) Order 2023", legislation.gov.uk, The National Archives, SI 2023/48, retrieved 15 June 2023
- "Result: Mayoral Referendum". Fenland Citizen. 18 July 2005. Retrieved 13 September 2011.
- Local elections in Britain: a statistical digest, edited by Colin Rallings and Michael Thrasher. 1993
- The Times reported this election result as Conservative 18, Labour 8, Independent 14. "Liberals capture Eastbourne and exceed ambition to win 1,000 loval government seats". The Times. 9 June 1973.
- "Heavy Labour losses in district polls". The Times. 8 May 1976.
- The Times reported this election result as Conservative 19, Labour 8, Liberal 4, SDP 2, Independent 7. "How votes were cast in local government elections". The Times. 7 May 1983.
- "Results in Thursday's local elections". The Times. 9 May 1987.
- The Times reported this election result as Conservative 28, Labour 6, Liberal Democrat 2, Independent 4. "Complete round-up of results from Thursday's local council elections". The Times. 4 May 1991.
- "Complete list of results from Thursday's council elections". The Times. 6 May 1995. p. 10.
- "How the Nations Voted". The Times. 8 May 1999.
- "Fenland". BBC News. Retrieved 26 January 2017.
- "Fenland". BBC News. Retrieved 26 January 2017.
- "Fenland". BBC News. 5 May 2007. Retrieved 26 January 2017.
- "Fenland". BBC News. Retrieved 26 January 2017.
- "Fenland". BBC News. 3 May 2019. Retrieved 14 May 2019.
- "Fenland". BBC News. 3 May 2019. Retrieved 14 May 2019.
- "Comfortable winner Sears". Cambs Times. 10 February 2006. Retrieved 13 September 2011.
- Rory, Carroll (19 July 2006). "Election: Florence back on council". Fenland Citizen.
- "Convincing win for Conservatives". Peterborough Evening Telegraph. 12 April 2008.
- "Result of Poll Parson Drove and Wisbech St Mary Ward". Fenland District Council. Archived from the original on 26 April 2010. Retrieved 9 September 2009.
- "Tories keep it 39 out of 40 with decisive by election contest for Fenland District Council". The Cambs Times. 9 October 2009. Retrieved 9 October 2009.
- "Declaration of Result - The Mills Ward of Fenland District Council". Fenland District Council. Retrieved 5 March 2010.
- "Dave Patrick stuns Tories and wins Wisbech seat on Fenland District Council for Lib Dems". Wisbech Standard. 16 April 2010. Retrieved 16 April 2010.
- "Tories retain Staithe seat on Fenland Council despite 7% swing towards Labour". Wisbech Standard. 23 September 2011. Retrieved 23 September 2011.
- "By-election". www.edp24.co.uk. Retrieved 28 May 2021.
- "Conservatives win". www.edp24.co.uk. Retrieved 23 May 2021.
- "2021 electiins". www.fenland.gov.uk. Retrieved 8 May 2021.
- By-election results Archived 29 March 2010 at the Wayback Machine
External links
| Cambridgeshire County Council | |
|---|---|
| Peterborough City Council | |
| Cambridge City Council | |
| East Cambridgeshire District Council | |
| Fenland District Council | |
| Huntingdonshire District Council | |
| South Cambridgeshire District Council | |
| Isle of Ely County Council |
|
| Huntingdon & Peterborough County Council |
|
| Mayor of Cambridgeshire and Peterborough | |
| |
This article is issued from Wikipedia. The text is licensed under Creative Commons - Attribution - Sharealike. Additional terms may apply for the media files.