Fredensborg (nomination district)
Fredensborg nominating district is one of the 92 nominating districts that was created for Danish elections following the 2007 municipal reform.[3][4][5] It consists of Fredensborg and Hørsholm municipality.[6] It was created in 1849 as a constituency,[7] and has been a nomination district since 1920, though its boundaries have been changed since then.
| Fredensborg | |
|---|---|
| Fredensborg | |
| Nomination district constituency for the Folketing | |
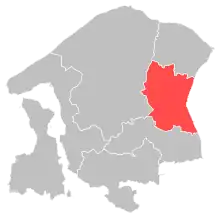 Location of Fredensborg within North Zealand | |
 Location of North Zealand within Denmark | |
| Municipalities | Fredensborg Hørsholm |
| Constituency | North Zealand |
| Electorate | 46,686 (2022)[1] |
| Current constituency | |
| Created | 1849 (as constituency)[2] 1920 (as nomination district) |
In general elections, the district is a strong area for parties commonly associated with the blue bloc.[8]
General elections results
General elections in the 2020s
| Parties | Vote | |||||
|---|---|---|---|---|---|---|
| Votes | % | + / - | ||||
| Social Democrats | 7,588 | 18.83 | +2.48 | |||
| Venstre | 6,913 | 17.16 | -9.06 | |||
| Moderates | 5,124 | 12.72 | New | |||
| Liberal Alliance | 5,097 | 12.65 | +8.17 | |||
| Conservatives | 4,051 | 10.05 | -5.44 | |||
| Green Left | 2,583 | 6.41 | +0.63 | |||
| Social Liberals | 2,215 | 5.50 | -7.16 | |||
| Denmark Democrats | 1,455 | 3.61 | New | |||
| New Right | 1,412 | 3.50 | +0.42 | |||
| Red–Green Alliance | 1,301 | 3.23 | -0.98 | |||
| The Alternative | 1,199 | 2.98 | +0.67 | |||
| Danish People's Party | 916 | 2.27 | -4.03 | |||
| Independent Greens | 288 | 0.71 | New | |||
| Christian Democrats | 116 | 0.29 | -0.65 | |||
| Jayseth Lotus Arrose Simoysano | 23 | 0.06 | New | |||
| Katjalivah Elleyhansen | 11 | 0.03 | New | |||
| Total | 40,292 | |||||
| Source[9] | ||||||
General elections in the 2010s
| Parties | Vote | |||||
|---|---|---|---|---|---|---|
| Votes | % | + / - | ||||
| Venstre | 10,701 | 26.22 | +3.11 | |||
| Social Democrats | 6,671 | 16.35 | -2.19 | |||
| Conservatives | 6,320 | 15.49 | +7.89 | |||
| Social Liberals | 5,168 | 12.66 | +5.64 | |||
| Danish People's Party | 2,572 | 6.30 | -9.57 | |||
| Green Left | 2,359 | 5.78 | +2.55 | |||
| Liberal Alliance | 1,829 | 4.48 | -10.76 | |||
| Red–Green Alliance | 1,717 | 4.21 | -0.73 | |||
| New Right | 1,255 | 3.08 | New | |||
| The Alternative | 944 | 2.31 | -1.71 | |||
| Stram Kurs | 490 | 1.20 | New | |||
| Christian Democrats | 383 | 0.94 | +0.54 | |||
| Klaus Riskær Pedersen Party | 376 | 0.92 | New | |||
| Gert Lassen | 27 | 0.07 | +0.06 | |||
| Hans Frederik Brobjerg | 1 | 0.00 | New | |||
| Total | 40,813 | |||||
| Source[10] | ||||||
| Parties | Vote | |||||
|---|---|---|---|---|---|---|
| Votes | % | + / - | ||||
| Venstre | 9,377 | 23.11 | -11.89 | |||
| Social Democrats | 7,523 | 18.54 | +3.92 | |||
| Danish People's Party | 6,441 | 15.87 | +6.87 | |||
| Liberal Alliance | 6,182 | 15.24 | +6.24 | |||
| Conservatives | 3,083 | 7.60 | -2.71 | |||
| Social Liberals | 2,848 | 7.02 | -5.06 | |||
| Red–Green Alliance | 2,003 | 4.94 | +1.15 | |||
| The Alternative | 1,633 | 4.02 | New | |||
| Green Left | 1,311 | 3.23 | -2.67 | |||
| Christian Democrats | 161 | 0.40 | +0.13 | |||
| Aleks Jensen | 11 | 0.03 | New | |||
| Gert Lassen | 4 | 0.01 | New | |||
| Total | 40,577 | |||||
| Source[11] | ||||||
| Parties | Vote | |||||
|---|---|---|---|---|---|---|
| Votes | % | + / - | ||||
| Venstre | 14,314 | 35.00 | +3.56 | |||
| Social Democrats | 5,981 | 14.62 | -1.66 | |||
| Social Liberals | 4,942 | 12.08 | +4.46 | |||
| Conservatives | 4,216 | 10.31 | -8.14 | |||
| Liberal Alliance | 3,679 | 9.00 | +3.91 | |||
| Danish People's Party | 3,679 | 9.00 | -1.99 | |||
| Green Left | 2,411 | 5.90 | -2.28 | |||
| Red–Green Alliance | 1,549 | 3.79 | +2.19 | |||
| Christian Democrats | 112 | 0.27 | -0.07 | |||
| Bjarne Holm | 15 | 0.04 | New | |||
| Total | 40,898 | |||||
| Source[12] | ||||||
General elections in the 2000s
| Parties | Vote | |||||
|---|---|---|---|---|---|---|
| Votes | % | + / - | ||||
| Venstre | 12,600 | 31.44 | -3.32 | |||
| Conservatives | 7,396 | 18.45 | +3.47 | |||
| Social Democrats | 6,526 | 16.28 | +0.67 | |||
| Danish People's Party | 4,405 | 10.99 | -1.14 | |||
| Green Left | 3,278 | 8.18 | +3.56 | |||
| Social Liberals | 3,054 | 7.62 | -4.92 | |||
| New Alliance | 2,042 | 5.09 | New | |||
| Red–Green Alliance | 643 | 1.60 | -1.20 | |||
| Christian Democrats | 137 | 0.34 | -0.98 | |||
| Total | 40,081 | |||||
| Source[13] | ||||||
| Parties | Vote | |||||
|---|---|---|---|---|---|---|
| Votes | % | + / - | ||||
| Venstre | 22,950 | 34.76 | -3.99 | |||
| Social Democrats | 10,305 | 15.61 | -3.68 | |||
| Conservatives | 9,889 | 14.98 | +3.35 | |||
| Social Liberals | 8,282 | 12.54 | +4.88 | |||
| Danish People's Party | 8,010 | 12.13 | +1.88 | |||
| Green Left | 3,053 | 4.62 | -1.18 | |||
| Red–Green Alliance | 1,851 | 2.80 | +0.86 | |||
| Christian Democrats | 872 | 1.32 | -0.76 | |||
| Centre Democrats | 667 | 1.01 | -1.19 | |||
| Minority Party | 143 | 0.22 | New | |||
| Total | 66,022 | |||||
| Source[14] | ||||||
| Parties | Vote | |||||
|---|---|---|---|---|---|---|
| Votes | % | + / - | ||||
| Venstre | 26,567 | 38.75 | +12.42 | |||
| Social Democrats | 13,226 | 19.29 | -5.47 | |||
| Conservatives | 7,972 | 11.63 | -8.30 | |||
| Danish People's Party | 7,027 | 10.25 | +3.43 | |||
| Social Liberals | 5,251 | 7.66 | +3.26 | |||
| Green Left | 3,975 | 5.80 | -1.08 | |||
| Centre Democrats | 1,510 | 2.20 | -2.89 | |||
| Christian People's Party | 1,424 | 2.08 | +0.08 | |||
| Red–Green Alliance | 1,333 | 1.94 | -0.33 | |||
| Progress Party | 273 | 0.40 | -0.83 | |||
| Total | 68,558 | |||||
| Source[15] | ||||||
General elections in the 1990s
| Parties | Vote | |||||
|---|---|---|---|---|---|---|
| Votes | % | + / - | ||||
| Venstre | 17,658 | 26.33 | +3.01 | |||
| Social Democrats | 16,602 | 24.76 | +1.57 | |||
| Conservatives | 13,366 | 19.93 | -8.83 | |||
| Green Left | 4,614 | 6.88 | -0.04 | |||
| Danish People's Party | 4,576 | 6.82 | New | |||
| Centre Democrats | 3,411 | 5.09 | +1.60 | |||
| Social Liberals | 2,948 | 4.40 | -1.13 | |||
| Red–Green Alliance | 1,521 | 2.27 | -0.46 | |||
| Christian People's Party | 1,338 | 2.00 | +0.67 | |||
| Progress Party | 828 | 1.23 | -3.43 | |||
| Democratic Renewal | 168 | 0.25 | New | |||
| Sabina Schilliing Nybo Rasmussen | 34 | 0.05 | New | |||
| Total | 67,064 | |||||
| Source[16] | ||||||
| Parties | Vote | |||||
|---|---|---|---|---|---|---|
| Votes | % | + / - | ||||
| Conservatives | 18,812 | 28.76 | +2.34 | |||
| Venstre | 15,248 | 23.32 | +5.12 | |||
| Social Democrats | 15,163 | 23.19 | -2.37 | |||
| Green Left | 4,527 | 6.92 | -0.28 | |||
| Social Liberals | 3,616 | 5.53 | +1.10 | |||
| Progress Party | 3,047 | 4.66 | +0.05 | |||
| Centre Democrats | 2,281 | 3.49 | -3.70 | |||
| Red–Green Alliance | 1,784 | 2.73 | +0.55 | |||
| Christian People's Party | 869 | 1.33 | -0.28 | |||
| Jørgen Ruberg | 52 | 0.08 | New | |||
| Total | 65,399 | |||||
| Source[17] | ||||||
| Parties | Vote | |||||
|---|---|---|---|---|---|---|
| Votes | % | + / - | ||||
| Conservatives | 16,394 | 26.42 | -4.84 | |||
| Social Democrats | 15,861 | 25.56 | +6.28 | |||
| Venstre | 11,294 | 18.20 | +7.40 | |||
| Green Left | 4,465 | 7.20 | -4.21 | |||
| Centre Democrats | 4,461 | 7.19 | +0.38 | |||
| Progress Party | 2,860 | 4.61 | -3.01 | |||
| Social Liberals | 2,747 | 4.43 | -2.67 | |||
| Red–Green Alliance | 1,351 | 2.18 | New | |||
| Christian People's Party | 998 | 1.61 | +0.23 | |||
| Common Course | 755 | 1.22 | -0.09 | |||
| The Greens | 606 | 0.98 | -0.94 | |||
| Justice Party of Denmark | 244 | 0.39 | New | |||
| Humanist Party | 19 | 0.03 | New | |||
| Total | 62,055 | |||||
| Source[18] | ||||||
General elections in the 1980s
| Parties | Vote | |||||
|---|---|---|---|---|---|---|
| Votes | % | + / - | ||||
| Conservatives | 19,684 | 31.26 | -2.07 | |||
| Social Democrats | 12,140 | 19.28 | +1.36 | |||
| Green Left | 7,188 | 11.41 | -1.46 | |||
| Venstre | 6,799 | 10.80 | +2.75 | |||
| Progress Party | 4,796 | 7.62 | +3.98 | |||
| Social Liberals | 4,469 | 7.10 | -1.44 | |||
| Centre Democrats | 4,290 | 6.81 | -0.98 | |||
| The Greens | 1,206 | 1.92 | -0.08 | |||
| Christian People's Party | 871 | 1.38 | -0.33 | |||
| Common Course | 827 | 1.31 | -0.19 | |||
| Communist Party of Denmark | 426 | 0.68 | -0.02 | |||
| Left Socialists | 267 | 0.42 | -0.88 | |||
| Lars Kristensen | 10 | 0.02 | 0.00 | |||
| Total | 62,973 | |||||
| Source[19] | ||||||
| Parties | Vote | |||||
|---|---|---|---|---|---|---|
| Votes | % | + / - | ||||
| Conservatives | 21,312 | 33.33 | -1.45 | |||
| Social Democrats | 11,461 | 17.92 | -3.38 | |||
| Green Left | 8,230 | 12.87 | +2.00 | |||
| Social Liberals | 5,462 | 8.54 | +1.05 | |||
| Venstre | 5,148 | 8.05 | -2.97 | |||
| Centre Democrats | 4,984 | 7.79 | +2.99 | |||
| Progress Party | 2,330 | 3.64 | +0.65 | |||
| The Greens | 1,280 | 2.00 | New | |||
| Christian People's Party | 1,094 | 1.71 | -0.15 | |||
| Common Course | 957 | 1.50 | New | |||
| Left Socialists | 829 | 1.30 | -1.47 | |||
| Communist Party of Denmark | 446 | 0.70 | +0.08 | |||
| Justice Party of Denmark | 229 | 0.36 | -1.09 | |||
| Humanist Party | 132 | 0.21 | New | |||
| Socialist Workers Party | 26 | 0.04 | 0.00 | |||
| Lars Kristensen | 12 | 0.02 | +0.01 | |||
| Marxist–Leninists Party | 7 | 0.01 | 0.00 | |||
| Total | 63,939 | |||||
| Source[20] | ||||||
| Parties | Vote | |||||
|---|---|---|---|---|---|---|
| Votes | % | + / - | ||||
| Conservatives | 21,222 | 34.78 | +9.00 | |||
| Social Democrats | 12,995 | 21.30 | -1.82 | |||
| Venstre | 6,722 | 11.02 | +2.18 | |||
| Green Left | 6,632 | 10.87 | -0.16 | |||
| Social Liberals | 4,568 | 7.49 | +1.33 | |||
| Centre Democrats | 2,927 | 4.80 | -4.45 | |||
| Progress Party | 1,823 | 2.99 | -6.02 | |||
| Left Socialists | 1,690 | 2.77 | -0.15 | |||
| Christian People's Party | 1,136 | 1.86 | +0.41 | |||
| Justice Party of Denmark | 887 | 1.45 | +0.14 | |||
| Communist Party of Denmark | 381 | 0.62 | -0.33 | |||
| Socialist Workers Party | 24 | 0.04 | -0.01 | |||
| Marxist–Leninists Party | 5 | 0.01 | New | |||
| Lars Kristensen | 4 | 0.01 | New | |||
| Leni Thomsen | 3 | 0.00 | New | |||
| Lars Bjørnbak Hallstein | 1 | 0.00 | New | |||
| Total | 61,020 | |||||
| Source[21] | ||||||
| Parties | Vote | |||||
|---|---|---|---|---|---|---|
| Votes | % | + / - | ||||
| Conservatives | 14,306 | 25.78 | +4.45 | |||
| Social Democrats | 12,830 | 23.12 | -5.10 | |||
| Green Left | 6,119 | 11.03 | +5.01 | |||
| Centre Democrats | 5,131 | 9.25 | +5.29 | |||
| Progress Party | 4,999 | 9.01 | -1.94 | |||
| Venstre | 4,906 | 8.84 | -3.72 | |||
| Social Liberals | 3,419 | 6.16 | -0.80 | |||
| Left Socialists | 1,619 | 2.92 | -1.09 | |||
| Christian People's Party | 807 | 1.45 | -0.16 | |||
| Justice Party of Denmark | 727 | 1.31 | -1.24 | |||
| Communist Party of Denmark | 525 | 0.95 | -0.46 | |||
| Communist Workers Party | 85 | 0.15 | -0.28 | |||
| Socialist Workers Party | 26 | 0.05 | New | |||
| Total | 55,499 | |||||
| Source[22] | ||||||
General elections in the 1970s
| Parties | Vote | |||||
|---|---|---|---|---|---|---|
| Votes | % | + / - | ||||
| Social Democrats | 15,628 | 28.22 | +0.05 | |||
| Conservatives | 11,813 | 21.33 | +7.02 | |||
| Venstre | 6,954 | 12.56 | +1.03 | |||
| Progress Party | 6,064 | 10.95 | -5.36 | |||
| Social Liberals | 3,853 | 6.96 | +2.65 | |||
| Green Left | 3,332 | 6.02 | +2.13 | |||
| Left Socialists | 2,223 | 4.01 | +0.55 | |||
| Centre Democrats | 2,194 | 3.96 | -5.52 | |||
| Justice Party of Denmark | 1,415 | 2.55 | -0.58 | |||
| Christian People's Party | 889 | 1.61 | -0.60 | |||
| Communist Party of Denmark | 781 | 1.41 | -1.26 | |||
| Communist Workers Party | 239 | 0.43 | New | |||
| Total | 55,385 | |||||
| Source[23] | ||||||
| Parties | Vote | |||||
|---|---|---|---|---|---|---|
| Votes | % | + / - | ||||
| Social Democrats | 14,284 | 28.17 | +8.45 | |||
| Progress Party | 8,272 | 16.31 | +0.77 | |||
| Conservatives | 7,258 | 14.31 | +5.26 | |||
| Venstre | 5,845 | 11.53 | -17.58 | |||
| Centre Democrats | 4,805 | 9.48 | +6.91 | |||
| Social Liberals | 2,184 | 4.31 | -3.75 | |||
| Green Left | 1,973 | 3.89 | -0.66 | |||
| Left Socialists | 1,755 | 3.46 | +0.53 | |||
| Justice Party of Denmark | 1,588 | 3.13 | +1.33 | |||
| Communist Party of Denmark | 1,356 | 2.67 | -0.31 | |||
| Christian People's Party | 1,120 | 2.21 | -1.42 | |||
| Pensioners' Party | 250 | 0.49 | New | |||
| Kaj Boriths-Sørensen | 17 | 0.03 | New | |||
| Total | 50,707 | |||||
| Source[24] | ||||||
| Parties | Vote | |||||
|---|---|---|---|---|---|---|
| Votes | % | + / - | ||||
| Venstre | 13,741 | 29.11 | +15.42 | |||
| Social Democrats | 9,307 | 19.72 | +3.27 | |||
| Progress Party | 7,334 | 15.54 | -3.15 | |||
| Conservatives | 4,271 | 9.05 | -4.73 | |||
| Social Liberals | 3,805 | 8.06 | -4.42 | |||
| Green Left | 2,148 | 4.55 | -0.80 | |||
| Christian People's Party | 1,715 | 3.63 | +1.07 | |||
| Communist Party of Denmark | 1,407 | 2.98 | +0.07 | |||
| Left Socialists | 1,381 | 2.93 | +0.94 | |||
| Centre Democrats | 1,211 | 2.57 | -6.76 | |||
| Justice Party of Denmark | 850 | 1.80 | -0.97 | |||
| H. Lindholt | 35 | 0.07 | New | |||
| Total | 47,205 | |||||
| Source[25] | ||||||
| Parties | Vote | |||||
|---|---|---|---|---|---|---|
| Votes | % | + / - | ||||
| Progress Party | 8,517 | 18.69 | New | |||
| Social Democrats | 7,497 | 16.45 | -8.91 | |||
| Conservatives | 6,280 | 13.78 | -15.60 | |||
| Venstre | 6,241 | 13.69 | -1.14 | |||
| Social Liberals | 5,689 | 12.48 | -3.83 | |||
| Centre Democrats | 4,252 | 9.33 | New | |||
| Green Left | 2,437 | 5.35 | -2.52 | |||
| Communist Party of Denmark | 1,328 | 2.91 | +1.91 | |||
| Justice Party of Denmark | 1,261 | 2.77 | +1.01 | |||
| Christian People's Party | 1,169 | 2.56 | +1.46 | |||
| Left Socialists | 909 | 1.99 | -0.40 | |||
| Total | 45,580 | |||||
| Source[26] | ||||||
| Parties | Vote | |||||
|---|---|---|---|---|---|---|
| Votes | % | + / - | ||||
| Conservatives | 11,702 | 29.38 | -4.53 | |||
| Social Democrats | 10,102 | 25.36 | +1.47 | |||
| Social Liberals | 6,497 | 16.31 | +1.34 | |||
| Venstre | 5,905 | 14.83 | -2.37 | |||
| Green Left | 3,135 | 7.87 | +3.77 | |||
| Left Socialists | 952 | 2.39 | +0.22 | |||
| Justice Party of Denmark | 699 | 1.76 | +1.34 | |||
| Christian People's Party | 437 | 1.10 | New | |||
| Communist Party of Denmark | 400 | 1.00 | +0.28 | |||
| Total | 39,829 | |||||
| Source[27] | ||||||
General elections in the 1960s
| Parties | Vote | |||||
|---|---|---|---|---|---|---|
| Votes | % | + / - | ||||
| Conservatives | 13,280 | 33.91 | +4.46 | |||
| Social Democrats | 9,356 | 23.89 | -4.75 | |||
| Venstre | 6,736 | 17.20 | -2.90 | |||
| Social Liberals | 5,863 | 14.97 | +7.88 | |||
| Green Left | 1,607 | 4.10 | -3.89 | |||
| Liberal Centre | 860 | 2.20 | -2.02 | |||
| Left Socialists | 850 | 2.17 | New | |||
| Communist Party of Denmark | 282 | 0.72 | +0.07 | |||
| Justice Party of Denmark | 165 | 0.42 | -0.06 | |||
| Independent Party | 162 | 0.41 | -0.94 | |||
| Total | 39,161 | |||||
| Source[28] | ||||||
| Parties | Vote | |||||
|---|---|---|---|---|---|---|
| Votes | % | + / - | ||||
| Conservatives | 10,702 | 29.45 | +1.10 | |||
| Social Democrats | 10,406 | 28.64 | -3.73 | |||
| Venstre | 7,303 | 20.10 | -4.11 | |||
| Green Left | 2,905 | 7.99 | +3.29 | |||
| Social Liberals | 2,578 | 7.09 | +1.87 | |||
| Liberal Centre | 1,534 | 4.22 | New | |||
| Independent Party | 492 | 1.35 | -1.23 | |||
| Communist Party of Denmark | 237 | 0.65 | -0.40 | |||
| Justice Party of Denmark | 174 | 0.48 | -0.53 | |||
| Erik Hoffmeyer | 5 | 0.01 | New | |||
| Carl Møller | 4 | 0.01 | -0.04 | |||
| P. Lüchow | 0 | 0.00 | -0.01 | |||
| Total | 36,340 | |||||
| Source[29] | ||||||
| Parties | Vote | |||||
|---|---|---|---|---|---|---|
| Votes | % | + / - | ||||
| Social Democrats | 10,490 | 32.37 | -3.44 | |||
| Conservatives | 9,187 | 28.35 | +3.92 | |||
| Venstre | 7,846 | 24.21 | +2.61 | |||
| Social Liberals | 1,690 | 5.22 | -1.23 | |||
| Green Left | 1,523 | 4.70 | -0.38 | |||
| Independent Party | 835 | 2.58 | -1.35 | |||
| Communist Party of Denmark | 339 | 1.05 | +0.06 | |||
| Justice Party of Denmark | 326 | 1.01 | -0.69 | |||
| Danish Unity | 148 | 0.46 | New | |||
| Carl Møller | 16 | 0.05 | New | |||
| P. Lüchow | 4 | 0.01 | New | |||
| Total | 32,404 | |||||
| Source[30] | ||||||
| Parties | Vote | |||||
|---|---|---|---|---|---|---|
| Votes | % | + / - | ||||
| Social Democrats | 9,793 | 35.81 | +1.15 | |||
| Conservatives | 6,681 | 24.43 | +2.15 | |||
| Venstre | 5,907 | 21.60 | -4.19 | |||
| Social Liberals | 1,765 | 6.45 | -1.17 | |||
| Green Left | 1,388 | 5.08 | New | |||
| Independent Party | 1,075 | 3.93 | +1.95 | |||
| Justice Party of Denmark | 465 | 1.70 | -3.76 | |||
| Communist Party of Denmark | 272 | 0.99 | -1.21 | |||
| Total | 27,346 | |||||
| Source[31] | ||||||
General elections in the 1950s
| Parties | Vote | |||||
|---|---|---|---|---|---|---|
| Votes | % | + / - | ||||
| Social Democrats | 8,208 | 34.66 | -3.11 | |||
| Venstre | 6,109 | 25.79 | +1.31 | |||
| Conservatives | 5,276 | 22.28 | +0.55 | |||
| Social Liberals | 1,804 | 7.62 | -0.45 | |||
| Justice Party of Denmark | 1,294 | 5.46 | +2.79 | |||
| Communist Party of Denmark | 522 | 2.20 | -0.62 | |||
| Independent Party | 470 | 1.98 | -0.48 | |||
| Total | 23,683 | |||||
| Source[32] | ||||||
September 1953 Danish Folketing election
| Parties | Vote | |||||
|---|---|---|---|---|---|---|
| Votes | % | + / - | ||||
| Social Democrats | 7,901 | 37.77 | +0.31 | |||
| Venstre | 5,121 | 24.48 | +1.65 | |||
| Conservatives | 4,545 | 21.73 | -1.14 | |||
| Social Liberals | 1,689 | 8.07 | -0.99 | |||
| Communist Party of Denmark | 589 | 2.82 | -0.34 | |||
| Justice Party of Denmark | 558 | 2.67 | -1.18 | |||
| Independent Party | 515 | 2.46 | New | |||
| Total | 20,918 | |||||
| Source[33] | ||||||
April 1953 Danish Folketing election
| Parties | Vote | |||||
|---|---|---|---|---|---|---|
| Votes | % | + / - | ||||
| Social Democrats | 7,321 | 37.46 | -0.75 | |||
| Conservatives | 4,469 | 22.87 | -1.59 | |||
| Venstre | 4,461 | 22.83 | +0.89 | |||
| Social Liberals | 1,770 | 9.06 | +1.14 | |||
| Justice Party of Denmark | 753 | 3.85 | -0.95 | |||
| Communist Party of Denmark | 617 | 3.16 | +0.51 | |||
| Danish Unity | 150 | 0.77 | New | |||
| Total | 19,541 | |||||
| Source[34] | ||||||
1950 Danish Folketing election
| Parties | Vote | |||||
|---|---|---|---|---|---|---|
| Votes | % | + / - | ||||
| Social Democrats | 7,111 | 38.21 | -1.02 | |||
| Conservatives | 4,552 | 24.46 | +8.63 | |||
| Venstre | 4,083 | 21.94 | -8.71 | |||
| Social Liberals | 1,474 | 7.92 | +0.94 | |||
| Justice Party of Denmark | 894 | 4.80 | +2.51 | |||
| Communist Party of Denmark | 494 | 2.65 | -1.34 | |||
| Total | 18,608 | |||||
| Source[35] | ||||||
General elections in the 1940s
1947 Danish Folketing election
| Parties | Vote | |||||
|---|---|---|---|---|---|---|
| Votes | % | + / - | ||||
| Social Democrats | 7,045 | 39.23 | +5.57 | |||
| Venstre | 5,504 | 30.65 | +6.01 | |||
| Conservatives | 2,843 | 15.83 | -5.59 | |||
| Social Liberals | 1,254 | 6.98 | -1.73 | |||
| Communist Party of Denmark | 716 | 3.99 | -3.69 | |||
| Justice Party of Denmark | 411 | 2.29 | +1.37 | |||
| Danish Unity | 187 | 1.04 | -1.95 | |||
| Total | 17,960 | |||||
| Source[36] | ||||||
1945 Danish Folketing election
| Parties | Vote | |||||
|---|---|---|---|---|---|---|
| Votes | % | + / - | ||||
| Social Democrats | 5,884 | 33.66 | -8.87 | |||
| Venstre | 4,307 | 24.64 | +8.24 | |||
| Conservatives | 3,744 | 21.42 | -4.32 | |||
| Social Liberals | 1,522 | 8.71 | +0.20 | |||
| Communist Party of Denmark | 1,342 | 7.68 | New | |||
| Danish Unity | 522 | 2.99 | -0.61 | |||
| Justice Party of Denmark | 160 | 0.92 | +0.37 | |||
| Total | 17,481 | |||||
| Source[37] | ||||||
1943 Danish Folketing election
| Parties | Vote | |||||
|---|---|---|---|---|---|---|
| Votes | % | + / - | ||||
| Social Democrats | 7,283 | 42.53 | +1.82 | |||
| Conservatives | 4,408 | 25.74 | +0.45 | |||
| Venstre | 2,809 | 16.40 | -0.95 | |||
| Social Liberals | 1,457 | 8.51 | -1.57 | |||
| Danish Unity | 617 | 3.60 | +3.02 | |||
| National Socialist Workers' Party of Denmark | 386 | 2.25 | +0.45 | |||
| Justice Party of Denmark | 94 | 0.55 | -0.15 | |||
| Farmers' Party | 72 | 0.42 | -1.35 | |||
| Total | 17,126 | |||||
| Source[38] | ||||||
General elections in the 1930s
1939 Danish Folketing election
| Parties | Vote | |||||
|---|---|---|---|---|---|---|
| Votes | % | + / - | ||||
| Social Democrats | 5,986 | 40.71 | -2.16 | |||
| Conservatives | 3,719 | 25.29 | -1.20 | |||
| Venstre | 2,551 | 17.35 | +0.91 | |||
| Social Liberals | 1,482 | 10.08 | -0.37 | |||
| National Socialist Workers' Party of Denmark | 264 | 1.80 | +1.04 | |||
| Farmers' Party | 260 | 1.77 | +0.37 | |||
| National Cooperation | 136 | 0.92 | New | |||
| Communist Party of Denmark | 119 | 0.81 | +0.23 | |||
| Justice Party of Denmark | 103 | 0.70 | -0.31 | |||
| Danish Unity | 85 | 0.58 | New | |||
| Total | 14,705 | |||||
| Source[39] | ||||||
1935 Danish Folketing election
| Parties | Vote | |||||
|---|---|---|---|---|---|---|
| Votes | % | + / - | ||||
| Social Democrats | 5,960 | 42.87 | -1.43 | |||
| Conservatives | 3,682 | 26.49 | +3.38 | |||
| Venstre | 2,286 | 16.44 | -4.92 | |||
| Social Liberals | 1,453 | 10.45 | +0.51 | |||
| Independent People's Party | 194 | 1.40 | New | |||
| Justice Party of Denmark | 140 | 1.01 | +0.32 | |||
| National Socialist Workers' Party of Denmark | 106 | 0.76 | New | |||
| Communist Party of Denmark | 80 | 0.58 | -0.03 | |||
| Total | 13,901 | |||||
| Source[40] | ||||||
1932 Danish Folketing election
| Parties | Vote | |||||
|---|---|---|---|---|---|---|
| Votes | % | + / - | ||||
| Social Democrats | 6,287 | 44.30 | +6.07 | |||
| Conservatives | 3,280 | 23.11 | -1.25 | |||
| Venstre | 3,031 | 21.36 | -4.06 | |||
| Social Liberals | 1,410 | 9.94 | -1.45 | |||
| Justice Party of Denmark | 98 | 0.69 | +0.10 | |||
| Communist Party of Denmark | 86 | 0.61 | New | |||
| Total | 14,192 | |||||
| Source[41] | ||||||
General elections in the 1920s
1929 Danish Folketing election
| Parties | Vote | |||||
|---|---|---|---|---|---|---|
| Votes | % | + / - | ||||
| Social Democrats | 4,822 | 38.23 | +4.34 | |||
| Venstre | 3,207 | 25.42 | +1.84 | |||
| Conservatives | 3,073 | 24.36 | -6.82 | |||
| Social Liberals | 1,437 | 11.39 | +0.41 | |||
| Justice Party of Denmark | 75 | 0.59 | +0.22 | |||
| Total | 12,614 | |||||
| Source[42] | ||||||
1926 Danish Folketing election
| Parties | Vote | |||||
|---|---|---|---|---|---|---|
| Votes | % | + / - | ||||
| Social Democrats | 4,070 | 33.89 | -1.55 | |||
| Conservatives | 3,744 | 31.18 | +3.19 | |||
| Venstre | 2,831 | 23.58 | +2.13 | |||
| Social Liberals | 1,319 | 10.98 | -1.38 | |||
| Justice Party of Denmark | 44 | 0.37 | New | |||
| Independence Party | 0 | 0.00 | New | |||
| Total | 12,008 | |||||
| Source[43] | ||||||
1924 Danish Folketing election
| Parties | Vote | |||||
|---|---|---|---|---|---|---|
| Votes | % | + / - | ||||
| Social Democrats | 4,061 | 35.44 | +2.35 | |||
| Conservatives | 3,207 | 27.99 | +0.59 | |||
| Venstre | 2,458 | 21.45 | -5.12 | |||
| Social Liberals | 1,416 | 12.36 | +2.57 | |||
| Farmer Party | 303 | 2.64 | New | |||
| Communist Party of Denmark | 13 | 0.11 | New | |||
| Total | 11,458 | |||||
| Source[44] | ||||||
September 1920 Danish Folketing election
| Parties | Vote | |||||
|---|---|---|---|---|---|---|
| Votes | % | + / - | ||||
| Social Democrats | 3,691 | 33.09 | +2.98 | |||
| Conservatives | 3,056 | 27.40 | -2.88 | |||
| Venstre | 2,964 | 26.57 | -2.40 | |||
| Social Liberals | 1,092 | 9.79 | +2.26 | |||
| Industry Party | 291 | 2.61 | -0.40 | |||
| Free Social Democrats | 49 | 0.44 | New | |||
| Total | 11,154 | |||||
| Source[45] | ||||||
July 1920 Danish Folketing election
| Parties | Vote | |||||
|---|---|---|---|---|---|---|
| Votes | % | + / - | ||||
| Conservatives | 2,850 | 30.28 | +0.54 | |||
| Social Democrats | 2,834 | 30.11 | -0.01 | |||
| Venstre | 2,726 | 28.97 | +1.61 | |||
| Social Liberals | 709 | 7.53 | -1.32 | |||
| Industry Party | 283 | 3.01 | -0.81 | |||
| Daniel Nielsen | 6 | 0.06 | New | |||
| Total | 9,411 | |||||
| Source[46] | ||||||
April 1920 Danish Folketing election
| Parties | Vote | |||||
|---|---|---|---|---|---|---|
| Votes | % | |||||
| Social Democrats | 2,987 | 30.12 | ||||
| Conservatives | 2,949 | 29.74 | ||||
| Venstre | 2,713 | 27.36 | ||||
| Social Liberals | 878 | 8.85 | ||||
| Industry Party | 379 | 3.82 | ||||
| Elias S. Nielsen | 10 | 0.10 | ||||
| Total | 9,916 | |||||
| Source[47] | ||||||
European Parliament elections results
2019 European Parliament election in Denmark
| Parties | Vote | |||||
|---|---|---|---|---|---|---|
| Votes | % | + / - | ||||
| Venstre | 9,415 | 27.50 | +7.11 | |||
| Social Democrats | 4,776 | 13.95 | +0.54 | |||
| Conservatives | 4,769 | 13.93 | -1.58 | |||
| Social Liberals | 4,522 | 13.21 | +4.17 | |||
| Green Left | 3,722 | 10.87 | +2.06 | |||
| Danish People's Party | 2,935 | 8.57 | -14.03 | |||
| Liberal Alliance | 1,205 | 3.52 | -1.97 | |||
| Red–Green Alliance | 1,161 | 3.39 | New | |||
| People's Movement against the EU | 864 | 2.52 | -2.23 | |||
| The Alternative | 863 | 2.52 | New | |||
| Total | 34,232 | |||||
| Source[48] | ||||||
2014 European Parliament election in Denmark
| Parties | Vote | |||||
|---|---|---|---|---|---|---|
| Votes | % | + / - | ||||
| Danish People's Party | 6,646 | 22.60 | +8.46 | |||
| Venstre | 5,996 | 20.39 | -5.38 | |||
| Conservatives | 4,562 | 15.51 | -4.32 | |||
| Social Democrats | 3,943 | 13.41 | -1.01 | |||
| Social Liberals | 2,659 | 9.04 | +3.23 | |||
| Green Left | 2,591 | 8.81 | -3.22 | |||
| Liberal Alliance | 1,616 | 5.49 | +4.59 | |||
| People's Movement against the EU | 1,397 | 4.75 | -0.42 | |||
| Total | 29,410 | |||||
| Source[49] | ||||||
2009 European Parliament election in Denmark
| Parties | Vote | |||||
|---|---|---|---|---|---|---|
| Votes | % | + / - | ||||
| Venstre | 7,754 | 25.77 | +5.32 | |||
| Conservatives | 5,966 | 19.83 | -0.93 | |||
| Social Democrats | 4,339 | 14.42 | -8.81 | |||
| Danish People's Party | 4,254 | 14.14 | +7.34 | |||
| Green Left | 3,619 | 12.03 | +4.59 | |||
| Social Liberals | 1,748 | 5.81 | -2.38 | |||
| People's Movement against the EU | 1,554 | 5.17 | +0.51 | |||
| June Movement | 582 | 1.93 | -5.72 | |||
| Liberal Alliance | 270 | 0.90 | New | |||
| Total | 30,086 | |||||
| Source[50] | ||||||
2004 European Parliament election in Denmark
| Parties | Vote | |||||
|---|---|---|---|---|---|---|
| Votes | % | + / - | ||||
| Social Democrats | 9,778 | 23.23 | +13.45 | |||
| Conservatives | 8,736 | 20.76 | +7.63 | |||
| Venstre | 8,605 | 20.45 | -8.51 | |||
| Social Liberals | 3,446 | 8.19 | -2.78 | |||
| June Movement | 3,218 | 7.65 | -5.99 | |||
| Green Left | 3,133 | 7.44 | +1.65 | |||
| Danish People's Party | 2,861 | 6.80 | +1.29 | |||
| People's Movement against the EU | 1,960 | 4.66 | -1.88 | |||
| Christian Democrats | 349 | 0.83 | -0.61 | |||
| Total | 42,086 | |||||
| Source[51] | ||||||
1999 European Parliament election in Denmark
| Parties | Vote | |||||
|---|---|---|---|---|---|---|
| Votes | % | + / - | ||||
| Venstre | 12,385 | 28.96 | +10.00 | |||
| June Movement | 5,834 | 13.64 | -0.24 | |||
| Conservatives | 5,615 | 13.13 | -15.04 | |||
| Social Liberals | 4,689 | 10.97 | +0.82 | |||
| Social Democrats | 4,182 | 9.78 | +0.26 | |||
| People's Movement against the EU | 2,797 | 6.54 | -1.20 | |||
| Green Left | 2,478 | 5.79 | -1.82 | |||
| Danish People's Party | 2,358 | 5.51 | New | |||
| Centre Democrats | 1,810 | 4.23 | +3.13 | |||
| Christian Democrats | 615 | 1.44 | +0.77 | |||
| Progress Party | 199 | 0.47 | -1.74 | |||
| Total | 42,763 | |||||
| Source[52] | ||||||
1994 European Parliament election in Denmark
| Parties | Vote | |||||
|---|---|---|---|---|---|---|
| Votes | % | + / - | ||||
| Conservatives | 12,336 | 28.17 | +6.19 | |||
| Venstre | 8,304 | 18.96 | +1.32 | |||
| June Movement | 6,080 | 13.88 | New | |||
| Social Liberals | 4,444 | 10.15 | +6.95 | |||
| Social Democrats | 4,170 | 9.52 | -5.71 | |||
| People's Movement against the EU | 3,388 | 7.74 | -9.23 | |||
| Green Left | 3,334 | 7.61 | +0.14 | |||
| Progress Party | 966 | 2.21 | -1.94 | |||
| Centre Democrats | 482 | 1.10 | -10.41 | |||
| Christian Democrats | 295 | 0.67 | -1.19 | |||
| Total | 43,799 | |||||
| Source[53] | ||||||
1989 European Parliament election in Denmark
| Parties | Vote | |||||
|---|---|---|---|---|---|---|
| Votes | % | + / - | ||||
| Conservatives | 7,996 | 21.98 | -11.88 | |||
| Venstre | 6,417 | 17.64 | +8.88 | |||
| People's Movement against the EU | 6,173 | 16.97 | -3.84 | |||
| Social Democrats | 5,542 | 15.23 | +3.22 | |||
| Centre Democrats | 4,188 | 11.51 | +4.26 | |||
| Green Left | 2,717 | 7.47 | -0.07 | |||
| Progress Party | 1,511 | 4.15 | +1.02 | |||
| Social Liberals | 1,163 | 3.20 | -0.38 | |||
| Christian Democrats | 678 | 1.86 | +0.04 | |||
| Total | 36,385 | |||||
| Source[54] | ||||||
1984 European Parliament election in Denmark
| Parties | Vote | |||||
|---|---|---|---|---|---|---|
| Votes | % | |||||
| Conservatives | 12,953 | 33.86 | ||||
| People's Movement against the EU | 7,961 | 20.81 | ||||
| Social Democrats | 4,596 | 12.01 | ||||
| Venstre | 3,353 | 8.76 | ||||
| Green Left | 2,884 | 7.54 | ||||
| Centre Democrats | 2,774 | 7.25 | ||||
| Social Liberals | 1,369 | 3.58 | ||||
| Progress Party | 1,197 | 3.13 | ||||
| Christian Democrats | 696 | 1.82 | ||||
| Left Socialists | 476 | 1.24 | ||||
| Total | 38,259 | |||||
| Source[55] | ||||||
Referendums
2022 Danish European Union opt-out referendum[56]
| Option | Votes | % |
|---|---|---|
| ✓ YES | 25,446 | 75.81 |
| X NO | 8,121 | 24.19 |
2015 Danish European Union opt-out referendum[57]
| Option | Votes | % |
|---|---|---|
| ✓ YES | 18,271 | 60.91 |
| X NO | 11,727 | 39.09 |
2014 Danish Unified Patent Court membership referendum[58]
| Option | Votes | % |
|---|---|---|
| ✓ YES | 20,866 | 72.57 |
| X NO | 7,887 | 27.43 |
2009 Danish Act of Succession referendum[59]
| Option | Votes | % |
|---|---|---|
| ✓ YES | 23,743 | 86.50 |
| X NO | 3,707 | 13.50 |
2000 Danish euro referendum[60]
| Option | Votes | % |
|---|---|---|
| ✓ YES | 39,102 | 57.30 |
| X NO | 29,140 | 42.70 |
1998 Danish Amsterdam Treaty referendum[61]
| Option | Votes | % |
|---|---|---|
| ✓ YES | 38,328 | 63.21 |
| X NO | 22,312 | 36.79 |
1993 Danish Maastricht Treaty referendum[62]
| Option | Votes | % |
|---|---|---|
| ✓ YES | 42,763 | 64.76 |
| X NO | 23,272 | 35.24 |
1992 Danish Maastricht Treaty referendum[63]
| Option | Votes | % |
|---|---|---|
| ✓ YES | 38,118 | 59.82 |
| X NO | 25,605 | 40.18 |
1986 Danish Single European Act referendum[64]
| Option | Votes | % |
|---|---|---|
| ✓ YES | 35,451 | 59.31 |
| X NO | 24,324 | 40.69 |
1972 Danish European Communities membership referendum[65]
| Option | Votes | % |
|---|---|---|
| ✓ YES | 44,008 | 59.63 |
| X NO | 29,793 | 40.37 |
1953 Danish constitutional and electoral age referendum[66]
| Option | Votes | % |
|---|---|---|
| ✓ YES | 11,822 | 78.21 |
| X NO | 3,294 | 21.79 |
| 23 years | 8,947 | 57.47 |
| 21 years | 6,621 | 42.53 |
1939 Danish constitutional referendum[67]
| Option | Votes | % |
|---|---|---|
| ✓ YES | 8,227 | 92.50 |
| X NO | 667 | 7.50 |
References
- "Fredensborgkredsen". kmdvalg.dk (in Danish). Retrieved 2023-06-08.
- "Beretning om Forhandlingerne paa Rigsdagen". Rigsdagstidende. II: Spalte 3892 ff.
- "Nye valgkredse fordeler stemmerne anderledes". dr.dk (in Danish). Retrieved 2023-06-08.
- "Beretning om nye valgkredse som følge af kommunalreformen" (in Danish). Retrieved 2023-06-08.
- "Det danske valgsystem: Valg til Folketinget". valg.im (in Danish). Retrieved 2023-06-08.
- "22 Fredensborg". dataforsyningen.dk (in Danish). Retrieved 2023-06-08.
- "Beretning om Forhandlingerne paa Rigsdagen". Rigsdagstidende. II: Spalte 3892 ff.
- "Valgresultater fra tidligere valg:". kmdvalg (in Danish). Retrieved 2023-06-08.
- "FOLKETINGSVALG TIRSDAG 1. NOVEMBER 2022". valg.im (in Danish). Retrieved 2023-06-27.
- "FOLKETINGSVALG ONSDAG 5. JUNI 2019". valg.im (in Danish). Retrieved 2023-06-27.
- "FOLKETINGSVALG TORSDAG 18. JUNI 2015". valg.im (in Danish). Retrieved 2023-06-27.
- "FOLKETINGSVALG TORSDAG 15. SEPTEMBER 2011". valg.im (in Danish). Retrieved 2023-06-27.
- "Folketingsvalget den 13. november 2007". valg.im (in Danish). Retrieved 2023-06-27.
- "valg2005.book" (PDF). valg.im (in Danish). Retrieved 2023-06-27.
- "BMTABEL" (PDF). valg.im (in Danish). Retrieved 2023-06-27.
- "VALG98" (PDF). valg.im (in Danish). Retrieved 2023-06-27.
- "VALG94" (PDF). valg.im (in Danish). Retrieved 2023-06-27.
- "VALG90" (PDF). valg.im (in Danish). Retrieved 2023-06-27.
- "Folketingsvalget den 10. maj 1988". valg.im (in Danish). Retrieved 2023-06-27.
- "Folketingsvalget den 8.september 1987". dst.dk (in Danish). Retrieved 2023-06-27.
- "Folketingsvalget den 10. januar 1984". dst.dk (in Danish). Retrieved 2023-06-27.
- "Folketingsvalget den 8. december 1981". dst.dk (in Danish). Retrieved 2023-06-27.
- "Folketingsvalget den 23. oktober 1979". dst.dk (in Danish). Retrieved 2023-06-27.
- "Folketingsvalget den 15. februar 1977". dst.dk (in Danish). Retrieved 2023-06-27.
- "Folketingsvalget den 9. januar 1975". dst.dk (in Danish). Retrieved 2023-06-27.
- "Folketingsvalget den 4. december 1973". dst.dk (in Danish). Retrieved 2023-06-27.
- "Folketingsvalget den 21. september 1971 samt folkeafstemningen". dst.dk (in Danish). Retrieved 2023-06-27.
- "Folketingsvalget den 23. januar 1968". dst.dk (in Danish). Retrieved 2023-06-27.
- "Folketingsvalget den 22. november 1966". dst.dk (in Danish). Retrieved 2023-06-27.
- "Folketingsvalget den 22. september 1964". dst.dk (in Danish). Retrieved 2023-06-27.
- "Folketingsvalget den 15. november 1960". dst.dk (in Danish). Retrieved 2023-06-27.
- "Folketingsvalget den 14. maj 1957". dst.dk (in Danish). Retrieved 2023-06-27.
- "Folketingsvalget den 22. september 1953". dst.dk (in Danish). Retrieved 2023-06-27.
- "Rigsdagsvalgene og folkeafstemningerne i april og maj 1953". dst.dk (in Danish). Retrieved 2023-06-27.
- "Folketingsvalget den 5. september 1950". dst.dk (in Danish). Retrieved 2023-06-27.
- "Folketingsvalget den 28. oktober 1947". dst.dk (in Danish). Retrieved 2023-06-27.
- "Rigsdagsvalgene i oktober og november 1945". dst.dk (in Danish). Retrieved 2023-06-27.
- "Rigsdagsvalgene i marts og april 1943". dst.dk (in Danish). Retrieved 2023-06-27.
- "Rigsdagsvalgene og Folkeafstemningen i april og maj 1939". dst.dk (in Danish). Retrieved 2023-06-27.
- "Folketingsvalget den 22. oktober 1935". dst.dk (in Danish). Retrieved 2023-06-27.
- "Folketingsvalget den 16. november 1932". dst.dk (in Danish). Retrieved 2023-06-27.
- "Folketingsvalget den 24. april 1929". dst.dk (in Danish). Retrieved 2023-06-27.
- "Folketingsvalget den 2. december 1926". dst.dk (in Danish). Retrieved 2023-06-27.
- "Folketingsvalget den 11. april 1924". dst.dk (in Danish). Retrieved 2023-06-27.
- "Rigsdagsvalgene september-oktober 1920". dst.dk (in Danish). Retrieved 2023-06-27.
- "Rigsdagsvalgene juli-august 1920". dst.dk (in Danish). Retrieved 2023-06-27.
- "Folketingsvalget den 26. april 1920". dst.dk (in Danish). Retrieved 2023-06-27.
- "EUROPA-PARLAMENTSVALG SØNDAG 26. MAJ 2019". dst.dk (in Danish). Retrieved 2023-07-01.
- "EUROPA-PARLAMENTSVALG SØNDAG 25. MAJ 2014". dst.dk (in Danish). Retrieved 2023-07-01.
- "EUROPA-PARLAMENTSVALG SØNDAG 7. JUNI 2009". dst.dk (in Danish). Retrieved 2023-07-01.
- "EUROPA-PARLAMENTSVALGET DEN 13. JUNI 2004" (PDF). im.dk (in Danish). Retrieved 2023-07-01.
- "VALGET TIL EUROPA-PARLAMENTET DEN 10. JUNI 1999" (PDF). im.dk (in Danish). Retrieved 2023-07-01.
- "VALGET TIL EUROPA-PARLAMENTET DEN 9. JUNI 1994" (PDF). im.dk (in Danish). Retrieved 2023-07-01.
- "Valget til Europa-parlamentet den 15. juni 1989". dst.dk (in Danish). Retrieved 2023-07-01.
- "Valget til Europa-Parlamentet den 14. juni 1984". dst.dk (in Danish). Retrieved 2023-07-01.
- "FOLKEAFSTEMNING ONSDAG 1. JUNI 2022". dst.dk (in Danish). Retrieved 2023-07-05.
- "FOLKEAFSTEMNING TORSDAG 3. DECEMBER 2015". dst.dk (in Danish). Retrieved 2023-07-05.
- "FOLKEAFSTEMNING SØNDAG 25. MAJ 2014". dst.dk (in Danish). Retrieved 2023-07-05.
- "FOLKEAFSTEMNING SØNDAG 7. JUNI 2009". dst.dk (in Danish). Retrieved 2023-07-05.
- "FOLKEAFSTEMNINGEN DEN 28. SEPTEMBER 2000 OM DANMARKS DELTAGELSE I DEN FÆLLES VALUTA" (PDF). valg.im (in Danish). Retrieved 2023-07-05.
- "FOLKEAFSTEMNINGEN DEN 28. MAJ 1998OM DANMARKS TILTRÆDELSE AF AMSTERDAMTRAKTATEN" (PDF). valg.im (in Danish). Retrieved 2023-07-05.
- "FOLKEAFSTEMNINGEN DEN 18. MAJ 1993 OM DANMARKS TILTRÆDELSE AF EDINBURGH-AFGØRELSEN OG MAASTRICHT-TRAKTATEN". dst.dk (in Danish). Retrieved 2023-07-05.
- "Folkeafstemningen den 1. juni 1992 om Danmarks tiltrædelse af traktaten om Den Europæiske Union". dst.dk (in Danish). Retrieved 2023-07-05.
- "Vejledende folkeafstemning torsdag den 27. februar 1986 om Danmarks tiltrædelse af EF- pakken". dst.dk (in Danish). Retrieved 2023-07-05.
- "Folkeafstemningen om Danmarks tiltrædelse af De europæiske Fælleskaber 2. oktober 1972". dst.dk (in Danish). Retrieved 2023-07-05.
- "Publikationsfortegnelse vedrørende Folkeafstemninger". dst.dk (in Danish). Retrieved 2023-07-05.
- "Publikationsfortegnelse vedrørende Folkeafstemninger". dst.dk (in Danish). Retrieved 2023-07-05.