Fredericia (nomination district)
Fredericia nominating district is one of the 92 nominating districts that exits for Danish elections following the 2007 municipal reform.[3][4][5] It consists of Fredericia Municipality.[6] It was created in 1849[7] as a constituency, and has been a nomination district since 1920, though its boundaries have been changed since then.
| Fredericia | |
|---|---|
| Fredericia | |
| Nomination district constituency for the Folketing | |
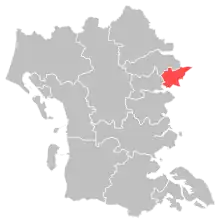 Location of Fredericia within South Jutland | |
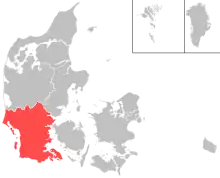 Location of South Jutland within Denmark | |
| Municipalities | Fredericia |
| Constituency | South Jutland |
| Electorate | 38,502 (2022)[1] |
| Current constituency | |
| Created | 1849 (as constituency)[2] 1920 (as nomination district) |
In general elections, the district has usually voted a little bit more for parties of the blue bloc.[8]
General elections results
General elections in the 2020s
| Parties | Vote | |||||
|---|---|---|---|---|---|---|
| Votes | % | + / - | ||||
| Social Democrats | 10,317 | 33.59 | +2.96 | |||
| Venstre | 3,438 | 11.20 | -10.48 | |||
| Moderates | 3,111 | 10.13 | New | |||
| Denmark Democrats | 2,877 | 9.37 | New | |||
| Liberal Alliance | 2,417 | 7.87 | +5.87 | |||
| Green Left | 2,050 | 6.68 | +0.96 | |||
| New Right | 1,638 | 5.33 | +1.74 | |||
| Conservatives | 1,443 | 4.70 | -1.06 | |||
| Red–Green Alliance | 1,010 | 3.29 | -2.20 | |||
| Danish People's Party | 881 | 2.87 | -9.77 | |||
| Social Liberals | 652 | 2.12 | -3.68 | |||
| The Alternative | 546 | 1.78 | -0.13 | |||
| Christian Democrats | 197 | 0.64 | -1.17 | |||
| Independent Greens | 108 | 0.35 | New | |||
| Kent Nielsen | 23 | 0.07 | New | |||
| Kenneth Vestergaard | 2 | 0.01 | New | |||
| Total | 30,710 | |||||
| Source[9] | ||||||
General elections in the 2010s
| Parties | Vote | |||||
|---|---|---|---|---|---|---|
| Votes | % | + / - | ||||
| Social Democrats | 9,432 | 30.63 | +2.60 | |||
| Venstre | 6,675 | 21.68 | +4.16 | |||
| Danish People's Party | 3,891 | 12.64 | -17.18 | |||
| Social Liberals | 1,785 | 5.80 | +3.27 | |||
| Conservatives | 1,774 | 5.76 | +3.71 | |||
| Green Left | 1,762 | 5.72 | +2.34 | |||
| Red–Green Alliance | 1,691 | 5.49 | -0.63 | |||
| New Right | 1,105 | 3.59 | New | |||
| Liberal Alliance | 617 | 2.00 | -4.65 | |||
| Stram Kurs | 595 | 1.93 | New | |||
| The Alternative | 588 | 1.91 | -1.18 | |||
| Christian Democrats | 556 | 1.81 | +0.99 | |||
| Klaus Riskær Pedersen Party | 302 | 0.98 | New | |||
| Michael Thomsen | 17 | 0.06 | New | |||
| Total | 30,790 | |||||
| Source[10] | ||||||
| Parties | Vote | |||||
|---|---|---|---|---|---|---|
| Votes | % | + / - | ||||
| Danish People's Party | 9,312 | 29.82 | +14.66 | |||
| Social Democrats | 8,755 | 28.03 | -2.40 | |||
| Venstre | 5,471 | 17.52 | -9.22 | |||
| Liberal Alliance | 2,077 | 6.65 | +2.30 | |||
| Red–Green Alliance | 1,911 | 6.12 | +1.64 | |||
| Green Left | 1,057 | 3.38 | -4.51 | |||
| The Alternative | 965 | 3.09 | New | |||
| Social Liberals | 789 | 2.53 | -3.64 | |||
| Conservatives | 639 | 2.05 | -1.82 | |||
| Christian Democrats | 256 | 0.82 | -0.06 | |||
| Total | 31,232 | |||||
| Source[11] | ||||||
| Parties | Vote | |||||
|---|---|---|---|---|---|---|
| Votes | % | + / - | ||||
| Social Democrats | 9,753 | 30.43 | +3.83 | |||
| Venstre | 8,570 | 26.74 | -0.24 | |||
| Danish People's Party | 4,858 | 15.16 | -1.26 | |||
| Green Left | 2,530 | 7.89 | -5.97 | |||
| Social Liberals | 1,978 | 6.17 | +3.07 | |||
| Red–Green Alliance | 1,436 | 4.48 | +3.60 | |||
| Liberal Alliance | 1,395 | 4.35 | +2.37 | |||
| Conservatives | 1,242 | 3.87 | -5.40 | |||
| Christian Democrats | 281 | 0.88 | -0.02 | |||
| Niesl-Aage Bjerre | 5 | 0.02 | New | |||
| Jørn Bjorholm | 5 | 0.02 | New | |||
| Total | 32,053 | |||||
| Source[12] | ||||||
General elections in the 2000s
| Parties | Vote | |||||
|---|---|---|---|---|---|---|
| Votes | % | + / - | ||||
| Venstre | 8,350 | 26.98 | -2.50 | |||
| Social Democrats | 8,234 | 26.60 | -1.27 | |||
| Danish People's Party | 5,082 | 16.42 | +1.04 | |||
| Green Left | 4,291 | 13.86 | +7.67 | |||
| Conservatives | 2,868 | 9.27 | +0.61 | |||
| Social Liberals | 961 | 3.10 | -3.68 | |||
| New Alliance | 614 | 1.98 | New | |||
| Christian Democrats | 279 | 0.90 | -1.57 | |||
| Red–Green Alliance | 272 | 0.88 | -1.32 | |||
| Total | 30,951 | |||||
| Source[13] | ||||||
| Parties | Vote | |||||
|---|---|---|---|---|---|---|
| Votes | % | + / - | ||||
| Venstre | 10,925 | 29.47 | -0.72 | |||
| Social Democrats | 10,328 | 27.86 | -5.13 | |||
| Danish People's Party | 5,699 | 15.37 | +1.27 | |||
| Conservatives | 3,209 | 8.66 | +0.85 | |||
| Social Liberals | 2,512 | 6.78 | +3.49 | |||
| Green Left | 2,294 | 6.19 | +0.42 | |||
| Christian Democrats | 916 | 2.47 | -0.25 | |||
| Red–Green Alliance | 814 | 2.20 | +1.01 | |||
| Centre Democrats | 291 | 0.78 | -0.48 | |||
| Minority Party | 70 | 0.19 | New | |||
| Benjamin Blender | 15 | 0.04 | +0.01 | |||
| Total | 37,073 | |||||
| Source[14] | ||||||
| Parties | Vote | |||||
|---|---|---|---|---|---|---|
| Votes | % | + / - | ||||
| Social Democrats | 12,495 | 32.99 | -8.11 | |||
| Venstre | 11,436 | 30.19 | +6.59 | |||
| Danish People's Party | 5,341 | 14.10 | +5.80 | |||
| Conservatives | 2,957 | 7.81 | +1.14 | |||
| Green Left | 2,186 | 5.77 | -1.49 | |||
| Social Liberals | 1,245 | 3.29 | +0.44 | |||
| Christian People's Party | 1,030 | 2.72 | -0.18 | |||
| Centre Democrats | 479 | 1.26 | -2.58 | |||
| Red–Green Alliance | 452 | 1.19 | -0.26 | |||
| Progress Party | 242 | 0.64 | -1.11 | |||
| Benjamin Blender | 11 | 0.03 | New | |||
| Total | 37,874 | |||||
| Source[15] | ||||||
General elections in the 1990s
| Parties | Vote | |||||
|---|---|---|---|---|---|---|
| Votes | % | + / - | ||||
| Social Democrats | 15,309 | 41.10 | +2.35 | |||
| Venstre | 8,792 | 23.60 | +0.53 | |||
| Danish People's Party | 3,091 | 8.30 | New | |||
| Green Left | 2,704 | 7.26 | -0.60 | |||
| Conservatives | 2,486 | 6.67 | -6.94 | |||
| Centre Democrats | 1,429 | 3.84 | +1.34 | |||
| Christian People's Party | 1,079 | 2.90 | +0.63 | |||
| Social Liberals | 1,061 | 2.85 | -0.79 | |||
| Progress Party | 652 | 1.75 | -4.88 | |||
| Red–Green Alliance | 539 | 1.45 | -0.13 | |||
| Democratic Renewal | 94 | 0.25 | New | |||
| Birgitte Bjerring Sonneby | 16 | 0.04 | New | |||
| Total | 37,252 | |||||
| Source[16] | ||||||
| Parties | Vote | |||||
|---|---|---|---|---|---|---|
| Votes | % | + / - | ||||
| Social Democrats | 14,020 | 38.75 | -4.14 | |||
| Venstre | 8,345 | 23.07 | +9.35 | |||
| Conservatives | 4,924 | 13.61 | -1.78 | |||
| Green Left | 2,843 | 7.86 | +0.92 | |||
| Progress Party | 2,398 | 6.63 | +0.12 | |||
| Social Liberals | 1,315 | 3.64 | +1.19 | |||
| Centre Democrats | 905 | 2.50 | -2.67 | |||
| Christian People's Party | 820 | 2.27 | -0.77 | |||
| Red–Green Alliance | 573 | 1.58 | +0.88 | |||
| Knud Haugmark | 33 | 0.09 | New | |||
| Total | 36,176 | |||||
| Source[17] | ||||||
| Parties | Vote | |||||
|---|---|---|---|---|---|---|
| Votes | % | + / - | ||||
| Social Democrats | 15,061 | 42.89 | +7.47 | |||
| Conservatives | 5,405 | 15.39 | -3.63 | |||
| Venstre | 4,817 | 13.72 | +3.59 | |||
| Green Left | 2,438 | 6.94 | -4.67 | |||
| Progress Party | 2,287 | 6.51 | -2.33 | |||
| Centre Democrats | 1,815 | 5.17 | +0.60 | |||
| Christian People's Party | 1,069 | 3.04 | +0.38 | |||
| Social Liberals | 861 | 2.45 | -1.97 | |||
| Common Course | 674 | 1.92 | +0.36 | |||
| The Greens | 262 | 0.75 | -0.33 | |||
| Red–Green Alliance | 247 | 0.70 | New | |||
| Justice Party of Denmark | 177 | 0.50 | New | |||
| Total | 35,113 | |||||
| Source[18] | ||||||
General elections in the 1980s
| Parties | Vote | |||||
|---|---|---|---|---|---|---|
| Votes | % | + / - | ||||
| Social Democrats | 12,774 | 35.42 | -0.12 | |||
| Conservatives | 6,860 | 19.02 | -1.33 | |||
| Green Left | 4,187 | 11.61 | -1.86 | |||
| Venstre | 3,654 | 10.13 | +1.21 | |||
| Progress Party | 3,188 | 8.84 | +4.43 | |||
| Centre Democrats | 1,647 | 4.57 | -0.14 | |||
| Social Liberals | 1,594 | 4.42 | -0.36 | |||
| Christian People's Party | 960 | 2.66 | -0.36 | |||
| Common Course | 562 | 1.56 | -0.38 | |||
| The Greens | 389 | 1.08 | +0.08 | |||
| Communist Party of Denmark | 168 | 0.47 | -0.16 | |||
| Left Socialists | 80 | 0.22 | -0.26 | |||
| Total | 36,063 | |||||
| Source[19] | ||||||
| Parties | Vote | |||||
|---|---|---|---|---|---|---|
| Votes | % | + / - | ||||
| Social Democrats | 12,928 | 35.54 | -0.64 | |||
| Conservatives | 7,404 | 20.35 | -2.83 | |||
| Green Left | 4,899 | 13.47 | +3.41 | |||
| Venstre | 3,244 | 8.92 | -2.53 | |||
| Social Liberals | 1,740 | 4.78 | +0.13 | |||
| Centre Democrats | 1,715 | 4.71 | -0.34 | |||
| Progress Party | 1,606 | 4.41 | +1.40 | |||
| Christian People's Party | 1,097 | 3.02 | -0.06 | |||
| Common Course | 707 | 1.94 | New | |||
| The Greens | 363 | 1.00 | New | |||
| Communist Party of Denmark | 229 | 0.63 | +0.12 | |||
| Justice Party of Denmark | 199 | 0.55 | -1.05 | |||
| Left Socialists | 175 | 0.48 | -0.67 | |||
| Humanist Party | 53 | 0.15 | New | |||
| Socialist Workers Party | 12 | 0.03 | -0.01 | |||
| Marxist–Leninists Party | 6 | 0.02 | 0.00 | |||
| Total | 36,377 | |||||
| Source[20] | ||||||
| Parties | Vote | |||||
|---|---|---|---|---|---|---|
| Votes | % | + / - | ||||
| Social Democrats | 13,102 | 36.18 | -2.04 | |||
| Conservatives | 8,397 | 23.18 | +9.26 | |||
| Venstre | 4,148 | 11.45 | +1.38 | |||
| Green Left | 3,645 | 10.06 | +0.02 | |||
| Centre Democrats | 1,829 | 5.05 | -3.41 | |||
| Social Liberals | 1,684 | 4.65 | +0.40 | |||
| Christian People's Party | 1,114 | 3.08 | +0.41 | |||
| Progress Party | 1,090 | 3.01 | -5.84 | |||
| Justice Party of Denmark | 580 | 1.60 | +0.20 | |||
| Left Socialists | 417 | 1.15 | +0.10 | |||
| Communist Party of Denmark | 184 | 0.51 | -0.36 | |||
| Socialist Workers Party | 16 | 0.04 | -0.01 | |||
| Marxist–Leninists Party | 7 | 0.02 | New | |||
| A. Egedal Christoffersen | 5 | 0.01 | New | |||
| Total | 36,218 | |||||
| Source[21] | ||||||
| Parties | Vote | |||||
|---|---|---|---|---|---|---|
| Votes | % | + / - | ||||
| Social Democrats | 12,594 | 38.22 | -5.87 | |||
| Conservatives | 4,587 | 13.92 | +2.56 | |||
| Venstre | 3,318 | 10.07 | -1.90 | |||
| Green Left | 3,309 | 10.04 | +4.98 | |||
| Progress Party | 2,918 | 8.85 | -1.00 | |||
| Centre Democrats | 2,787 | 8.46 | +4.85 | |||
| Social Liberals | 1,402 | 4.25 | -0.09 | |||
| Christian People's Party | 881 | 2.67 | -0.62 | |||
| Justice Party of Denmark | 463 | 1.40 | -1.32 | |||
| Left Socialists | 346 | 1.05 | -0.79 | |||
| Communist Party of Denmark | 286 | 0.87 | -0.70 | |||
| Communist Workers Party | 47 | 0.14 | -0.17 | |||
| Socialist Workers Party | 16 | 0.05 | New | |||
| Total | 32,954 | |||||
| Source[22] | ||||||
General elections in the 1970s
| Parties | Vote | |||||
|---|---|---|---|---|---|---|
| Votes | % | + / - | ||||
| Social Democrats | 14,732 | 44.09 | +2.65 | |||
| Venstre | 4,000 | 11.97 | -0.37 | |||
| Conservatives | 3,795 | 11.36 | +4.03 | |||
| Progress Party | 3,293 | 9.85 | -3.21 | |||
| Green Left | 1,690 | 5.06 | +2.18 | |||
| Social Liberals | 1,449 | 4.34 | +1.59 | |||
| Centre Democrats | 1,207 | 3.61 | -2.95 | |||
| Christian People's Party | 1,101 | 3.29 | -0.64 | |||
| Justice Party of Denmark | 908 | 2.72 | -0.85 | |||
| Left Socialists | 615 | 1.84 | +0.50 | |||
| Communist Party of Denmark | 523 | 1.57 | -2.38 | |||
| Communist Workers Party | 104 | 0.31 | New | |||
| Total | 33,417 | |||||
| Source[23] | ||||||
| Parties | Vote | |||||
|---|---|---|---|---|---|---|
| Votes | % | + / - | ||||
| Social Democrats | 13,381 | 41.44 | +6.26 | |||
| Progress Party | 4,216 | 13.06 | +1.53 | |||
| Venstre | 3,983 | 12.34 | -11.54 | |||
| Conservatives | 2,366 | 7.33 | +3.25 | |||
| Centre Democrats | 2,119 | 6.56 | +4.12 | |||
| Communist Party of Denmark | 1,274 | 3.95 | +0.21 | |||
| Christian People's Party | 1,268 | 3.93 | -2.43 | |||
| Justice Party of Denmark | 1,152 | 3.57 | +1.78 | |||
| Green Left | 931 | 2.88 | -1.44 | |||
| Social Liberals | 888 | 2.75 | -2.89 | |||
| Left Socialists | 433 | 1.34 | +0.31 | |||
| Pensioners' Party | 278 | 0.86 | New | |||
| Total | 32,289 | |||||
| Source[24] | ||||||
| Parties | Vote | |||||
|---|---|---|---|---|---|---|
| Votes | % | + / - | ||||
| Social Democrats | 11,215 | 35.18 | +3.81 | |||
| Venstre | 7,612 | 23.88 | +12.74 | |||
| Progress Party | 3,677 | 11.53 | -3.18 | |||
| Christian People's Party | 2,029 | 6.36 | +0.78 | |||
| Social Liberals | 1,797 | 5.64 | -4.36 | |||
| Green Left | 1,376 | 4.32 | -0.53 | |||
| Conservatives | 1,302 | 4.08 | -3.97 | |||
| Communist Party of Denmark | 1,193 | 3.74 | +1.27 | |||
| Centre Democrats | 777 | 2.44 | -5.74 | |||
| Justice Party of Denmark | 570 | 1.79 | -0.99 | |||
| Left Socialists | 328 | 1.03 | +0.16 | |||
| Erik Holm | 4 | 0.01 | New | |||
| Elin Høgsbro Appel | 2 | 0.01 | New | |||
| Total | 31,882 | |||||
| Source[25] | ||||||
| Parties | Vote | |||||
|---|---|---|---|---|---|---|
| Votes | % | + / - | ||||
| Social Democrats | 9,904 | 31.37 | -14.81 | |||
| Progress Party | 4,646 | 14.71 | New | |||
| Venstre | 3,519 | 11.14 | -4.52 | |||
| Social Liberals | 3,158 | 10.00 | -2.08 | |||
| Centre Democrats | 2,583 | 8.18 | New | |||
| Conservatives | 2,542 | 8.05 | -4.90 | |||
| Christian People's Party | 1,761 | 5.58 | +3.14 | |||
| Green Left | 1,533 | 4.85 | -2.63 | |||
| Justice Party of Denmark | 877 | 2.78 | +1.34 | |||
| Communist Party of Denmark | 779 | 2.47 | +1.38 | |||
| Left Socialists | 274 | 0.87 | +0.20 | |||
| Total | 31,576 | |||||
| Source[26] | ||||||
| Parties | Vote | |||||
|---|---|---|---|---|---|---|
| Votes | % | + / - | ||||
| Social Democrats | 13,708 | 46.18 | +3.95 | |||
| Venstre | 4,649 | 15.66 | -3.39 | |||
| Conservatives | 3,844 | 12.95 | -4.47 | |||
| Social Liberals | 3,586 | 12.08 | +0.52 | |||
| Green Left | 2,220 | 7.48 | +1.81 | |||
| Christian People's Party | 725 | 2.44 | New | |||
| Justice Party of Denmark | 428 | 1.44 | +0.65 | |||
| Communist Party of Denmark | 324 | 1.09 | +0.36 | |||
| Left Socialists | 198 | 0.67 | -0.37 | |||
| Total | 29,682 | |||||
| Source[27] | ||||||
General elections in the 1960s
| Parties | Vote | |||||
|---|---|---|---|---|---|---|
| Votes | % | + / - | ||||
| Social Democrats | 13,033 | 42.23 | -4.68 | |||
| Venstre | 5,879 | 19.05 | -0.56 | |||
| Conservatives | 5,377 | 17.42 | +2.28 | |||
| Social Liberals | 3,567 | 11.56 | +6.53 | |||
| Green Left | 1,750 | 5.67 | -2.70 | |||
| Liberal Centre | 331 | 1.07 | -1.24 | |||
| Left Socialists | 320 | 1.04 | New | |||
| Justice Party of Denmark | 244 | 0.79 | +0.03 | |||
| Communist Party of Denmark | 226 | 0.73 | +0.22 | |||
| Independent Party | 137 | 0.44 | -0.93 | |||
| Total | 30,864 | |||||
| Source[28] | ||||||
| Parties | Vote | |||||
|---|---|---|---|---|---|---|
| Votes | % | + / - | ||||
| Social Democrats | 13,969 | 46.91 | -2.10 | |||
| Venstre | 5,839 | 19.61 | -0.04 | |||
| Conservatives | 4,507 | 15.14 | -3.36 | |||
| Green Left | 2,491 | 8.37 | +4.51 | |||
| Social Liberals | 1,497 | 5.03 | +1.48 | |||
| Liberal Centre | 687 | 2.31 | New | |||
| Independent Party | 409 | 1.37 | -1.26 | |||
| Justice Party of Denmark | 226 | 0.76 | -0.38 | |||
| Communist Party of Denmark | 151 | 0.51 | -0.34 | |||
| Total | 29,776 | |||||
| Source[29] | ||||||
| Parties | Vote | |||||
|---|---|---|---|---|---|---|
| Votes | % | + / - | ||||
| Social Democrats | 13,374 | 49.01 | +2.51 | |||
| Venstre | 5,361 | 19.65 | -2.91 | |||
| Conservatives | 5,047 | 18.50 | +3.32 | |||
| Green Left | 1,054 | 3.86 | -1.49 | |||
| Social Liberals | 968 | 3.55 | -0.52 | |||
| Independent Party | 718 | 2.63 | -1.01 | |||
| Justice Party of Denmark | 312 | 1.14 | -0.80 | |||
| Communist Party of Denmark | 231 | 0.85 | +0.08 | |||
| Danish Unity | 121 | 0.44 | New | |||
| Peace Politics People's Party | 102 | 0.37 | New | |||
| Total | 27,288 | |||||
| Source[30] | ||||||
| Parties | Vote | |||||
|---|---|---|---|---|---|---|
| Votes | % | + / - | ||||
| Social Democrats | 11,552 | 46.50 | +1.73 | |||
| Venstre | 5,604 | 22.56 | -4.07 | |||
| Conservatives | 3,770 | 15.18 | +2.53 | |||
| Green Left | 1,328 | 5.35 | New | |||
| Social Liberals | 1,011 | 4.07 | -1.53 | |||
| Independent Party | 904 | 3.64 | +1.05 | |||
| Justice Party of Denmark | 482 | 1.94 | -3.53 | |||
| Communist Party of Denmark | 191 | 0.77 | -1.51 | |||
| Total | 24,842 | |||||
| Source[31] | ||||||
General elections in the 1950s
| Parties | Vote | |||||
|---|---|---|---|---|---|---|
| Votes | % | + / - | ||||
| Social Democrats | 10,532 | 44.77 | -2.40 | |||
| Venstre | 6,265 | 26.63 | -1.01 | |||
| Conservatives | 2,975 | 12.65 | +1.98 | |||
| Social Liberals | 1,318 | 5.60 | +0.29 | |||
| Justice Party of Denmark | 1,287 | 5.47 | +2.45 | |||
| Independent Party | 609 | 2.59 | -0.51 | |||
| Communist Party of Denmark | 537 | 2.28 | -0.81 | |||
| Total | 23,523 | |||||
| Source[32] | ||||||
September 1953 Danish Folketing election
| Parties | Vote | |||||
|---|---|---|---|---|---|---|
| Votes | % | + / - | ||||
| Social Democrats | 10,348 | 47.17 | +1.79 | |||
| Venstre | 6,063 | 27.64 | +1.09 | |||
| Conservatives | 2,340 | 10.67 | -1.85 | |||
| Social Liberals | 1,166 | 5.31 | -1.03 | |||
| Independent Party | 681 | 3.10 | New | |||
| Communist Party of Denmark | 678 | 3.09 | -0.40 | |||
| Justice Party of Denmark | 662 | 3.02 | -1.56 | |||
| Total | 21,938 | |||||
| Source[33] | ||||||
April 1953 Danish Folketing election
| Parties | Vote | |||||
|---|---|---|---|---|---|---|
| Votes | % | + / - | ||||
| Social Democrats | 9,377 | 45.38 | +0.61 | |||
| Venstre | 5,487 | 26.55 | +2.02 | |||
| Conservatives | 2,588 | 12.52 | -1.51 | |||
| Social Liberals | 1,311 | 6.34 | +1.19 | |||
| Justice Party of Denmark | 946 | 4.58 | -3.31 | |||
| Communist Party of Denmark | 722 | 3.49 | -0.13 | |||
| Danish Unity | 233 | 1.13 | New | |||
| Total | 20,664 | |||||
| Source[34] | ||||||
1950 Danish Folketing election
| Parties | Vote | |||||
|---|---|---|---|---|---|---|
| Votes | % | + / - | ||||
| Social Democrats | 9,165 | 44.77 | -1.18 | |||
| Venstre | 5,023 | 24.53 | -6.47 | |||
| Conservatives | 2,873 | 14.03 | +5.61 | |||
| Justice Party of Denmark | 1,615 | 7.89 | +3.30 | |||
| Social Liberals | 1,055 | 5.15 | +1.94 | |||
| Communist Party of Denmark | 742 | 3.62 | -1.19 | |||
| Total | 20,473 | |||||
| Source[35] | ||||||
General elections in the 1940s
1947 Danish Folketing election
| Parties | Vote | |||||
|---|---|---|---|---|---|---|
| Votes | % | + / - | ||||
| Social Democrats | 9,306 | 45.95 | +8.55 | |||
| Venstre | 6,278 | 31.00 | +5.23 | |||
| Conservatives | 1,705 | 8.42 | -4.89 | |||
| Communist Party of Denmark | 974 | 4.81 | -8.07 | |||
| Justice Party of Denmark | 930 | 4.59 | +3.13 | |||
| Social Liberals | 650 | 3.21 | -0.39 | |||
| Danish Unity | 408 | 2.01 | -3.57 | |||
| Total | 20,251 | |||||
| Source[36] | ||||||
1945 Danish Folketing election
| Parties | Vote | |||||
|---|---|---|---|---|---|---|
| Votes | % | + / - | ||||
| Social Democrats | 7,398 | 37.40 | -14.70 | |||
| Venstre | 5,097 | 25.77 | +6.70 | |||
| Conservatives | 2,632 | 13.31 | -3.90 | |||
| Communist Party of Denmark | 2,547 | 12.88 | New | |||
| Danish Unity | 1,103 | 5.58 | +1.70 | |||
| Social Liberals | 713 | 3.60 | +0.28 | |||
| Justice Party of Denmark | 289 | 1.46 | +0.31 | |||
| 0,0 | 0.00 | |||||
| Total | 19,779 | |||||
| Source[37] | ||||||
1943 Danish Folketing election
| Parties | Vote | |||||
|---|---|---|---|---|---|---|
| Votes | % | + / - | ||||
| Social Democrats | 10,148 | 52.10 | +0.55 | |||
| Venstre | 3,714 | 19.07 | +1.41 | |||
| Conservatives | 3,352 | 17.21 | +3.60 | |||
| Danish Unity | 755 | 3.88 | +1.85 | |||
| Social Liberals | 647 | 3.32 | -0.79 | |||
| Farmers' Party | 356 | 1.83 | -2.65 | |||
| National Socialist Workers' Party of Denmark | 283 | 1.45 | +0.82 | |||
| Justice Party of Denmark | 224 | 1.15 | -0.58 | |||
| Total | 19,479 | |||||
| Source[38] | ||||||
General elections in the 1930s
1939 Danish Folketing election
| Parties | Vote | |||||
|---|---|---|---|---|---|---|
| Votes | % | + / - | ||||
| Social Democrats | 8,769 | 51.55 | -5.13 | |||
| Venstre | 3,004 | 17.66 | +2.37 | |||
| Conservatives | 2,315 | 13.61 | -1.39 | |||
| Farmers' Party | 762 | 4.48 | -0.79 | |||
| Social Liberals | 700 | 4.11 | +0.39 | |||
| Communist Party of Denmark | 473 | 2.78 | +1.63 | |||
| Danish Unity | 345 | 2.03 | New | |||
| Justice Party of Denmark | 295 | 1.73 | -0.45 | |||
| National Cooperation | 240 | 1.41 | New | |||
| National Socialist Workers' Party of Denmark | 108 | 0.63 | -0.08 | |||
| Total | 17,011 | |||||
| Source[39] | ||||||
1935 Danish Folketing election
| Parties | Vote | |||||
|---|---|---|---|---|---|---|
| Votes | % | + / - | ||||
| Social Democrats | 9,348 | 56.68 | +3.07 | |||
| Venstre | 2,522 | 15.29 | -9.50 | |||
| Conservatives | 2,474 | 15.00 | -0.25 | |||
| Independent People's Party | 869 | 5.27 | New | |||
| Social Liberals | 613 | 3.72 | +0.79 | |||
| Justice Party of Denmark | 359 | 2.18 | -0.34 | |||
| Communist Party of Denmark | 190 | 1.15 | +0.24 | |||
| National Socialist Workers' Party of Denmark | 117 | 0.71 | New | |||
| Total | 16,492 | |||||
| Source[40] | ||||||
1932 Danish Folketing election
| Parties | Vote | |||||
|---|---|---|---|---|---|---|
| Votes | % | + / - | ||||
| Social Democrats | 8,170 | 53.61 | +0.61 | |||
| Venstre | 3,778 | 24.79 | -5.33 | |||
| Conservatives | 2,324 | 15.25 | +3.12 | |||
| Social Liberals | 446 | 2.93 | -0.04 | |||
| Justice Party of Denmark | 384 | 2.52 | +1.03 | |||
| Communist Party of Denmark | 138 | 0.91 | +0.62 | |||
| Total | 15,240 | |||||
| Source[41] | ||||||
General elections in the 1920s
1929 Danish Folketing election
| Parties | Vote | |||||
|---|---|---|---|---|---|---|
| Votes | % | + / - | ||||
| Social Democrats | 7,592 | 53.00 | +4.97 | |||
| Venstre | 4,315 | 30.12 | -1.84 | |||
| Conservatives | 1,737 | 12.13 | -3.42 | |||
| Social Liberals | 426 | 2.97 | +0.10 | |||
| Justice Party of Denmark | 213 | 1.49 | +0.46 | |||
| Total | 14,324 | |||||
| Source[42] | ||||||
1926 Danish Folketing election
| Parties | Vote | |||||
|---|---|---|---|---|---|---|
| Votes | % | + / - | ||||
| Social Democrats | 6,451 | 48.03 | +0.42 | |||
| Venstre | 4,293 | 31.96 | -1.27 | |||
| Conservatives | 2,088 | 15.55 | +4.02 | |||
| Social Liberals | 385 | 2.87 | -0.19 | |||
| Justice Party of Denmark | 139 | 1.03 | +0.42 | |||
| Communist Party of Denmark | 75 | 0.56 | +0.09 | |||
| Total | 13,431 | |||||
| Source[43] | ||||||
1924 Danish Folketing election
| Parties | Vote | |||||
|---|---|---|---|---|---|---|
| Votes | % | + / - | ||||
| Social Democrats | 6,061 | 47.61 | +7.42 | |||
| Venstre | 4,231 | 33.23 | -11.73 | |||
| Conservatives | 1,468 | 11.53 | +2.34 | |||
| Farmer Party | 444 | 3.49 | New | |||
| Social Liberals | 389 | 3.06 | +0.26 | |||
| Total | 12,731 | |||||
| Source[44] | ||||||
September 1920 Danish Folketing election
| Parties | Vote | |||||
|---|---|---|---|---|---|---|
| Votes | % | + / - | ||||
| Venstre | 5,474 | 44.96 | -2.51 | |||
| Social Democrats | 4,893 | 40.19 | +2.50 | |||
| Conservatives | 1,119 | 9.19 | -0.27 | |||
| Social Liberals | 341 | 2.80 | +0.12 | |||
| Industry Party | 274 | 2.25 | -0.02 | |||
| Danish Left Socialist Party | 75 | 0.62 | New | |||
| Total | 12,176 | |||||
| Source[45] | ||||||
July 1920 Danish Folketing election
| Parties | Vote | |||||
|---|---|---|---|---|---|---|
| Votes | % | + / - | ||||
| Venstre | 4,872 | 47.47 | +1.34 | |||
| Social Democrats | 3,869 | 37.69 | +0.79 | |||
| Conservatives | 971 | 9.46 | -0.85 | |||
| Social Liberals | 275 | 2.68 | -0.16 | |||
| Industry Party | 233 | 2.27 | -1.04 | |||
| Sigvald Hellberg | 44 | 0.43 | -0.08 | |||
| Total | 10,264 | |||||
| Source[46] | ||||||
April 1920 Danish Folketing election
| Parties | Vote | |||||
|---|---|---|---|---|---|---|
| Votes | % | |||||
| Venstre | 4,915 | 46.13 | ||||
| Social Democrats | 3,931 | 36.90 | ||||
| Conservatives | 1,098 | 10.31 | ||||
| Industry Party | 353 | 3.31 | ||||
| Social Liberals | 303 | 2.84 | ||||
| Sigvald Hellberg | 54 | 0.51 | ||||
| Total | 10,654 | |||||
| Source[47] | ||||||
European Parliament elections results
2019 European Parliament election in Denmark
| Parties | Vote | |||||
|---|---|---|---|---|---|---|
| Votes | % | + / - | ||||
| Social Democrats | 6,272 | 26.92 | +5.46 | |||
| Venstre | 5,125 | 22.00 | +6.45 | |||
| Danish People's Party | 3,531 | 15.15 | -19.86 | |||
| Green Left | 2,307 | 9.90 | +2.46 | |||
| Social Liberals | 1,672 | 7.18 | +3.36 | |||
| Conservatives | 1,259 | 5.40 | -2.43 | |||
| Red–Green Alliance | 1,175 | 5.04 | New | |||
| People's Movement against the EU | 899 | 3.86 | -2.78 | |||
| Liberal Alliance | 556 | 2.39 | +0.14 | |||
| The Alternative | 504 | 2.16 | New | |||
| Total | 23,300 | |||||
| Source[48] | ||||||
2014 European Parliament election in Denmark
| Parties | Vote | |||||
|---|---|---|---|---|---|---|
| Votes | % | + / - | ||||
| Danish People's Party | 6,794 | 35.01 | +16.10 | |||
| Social Democrats | 4,165 | 21.46 | -0.33 | |||
| Venstre | 3,017 | 15.55 | -5.06 | |||
| Conservatives | 1,519 | 7.83 | -5.14 | |||
| Green Left | 1,443 | 7.44 | -6.57 | |||
| People's Movement against the EU | 1,289 | 6.64 | +0.04 | |||
| Social Liberals | 742 | 3.82 | +1.31 | |||
| Liberal Alliance | 437 | 2.25 | +1.63 | |||
| Total | 19,406 | |||||
| Source[49] | ||||||
2009 European Parliament election in Denmark
| Parties | Vote | |||||
|---|---|---|---|---|---|---|
| Votes | % | + / - | ||||
| Social Democrats | 4,396 | 21.79 | -17.90 | |||
| Venstre | 4,158 | 20.61 | +1.16 | |||
| Danish People's Party | 3,815 | 18.91 | +11.11 | |||
| Green Left | 2,825 | 14.01 | +8.66 | |||
| Conservatives | 2,616 | 12.97 | +3.32 | |||
| People's Movement against the EU | 1,332 | 6.60 | +2.83 | |||
| Social Liberals | 506 | 2.51 | -1.12 | |||
| June Movement | 398 | 1.97 | -6.76 | |||
| Liberal Alliance | 125 | 0.62 | New | |||
| Total | 20,171 | |||||
| Source[50] | ||||||
2004 European Parliament election in Denmark
| Parties | Vote | |||||
|---|---|---|---|---|---|---|
| Votes | % | + / - | ||||
| Social Democrats | 7,726 | 39.69 | +20.63 | |||
| Venstre | 3,787 | 19.45 | -4.15 | |||
| Conservatives | 1,878 | 9.65 | +2.03 | |||
| June Movement | 1,699 | 8.73 | -8.60 | |||
| Danish People's Party | 1,518 | 7.80 | +1.43 | |||
| Green Left | 1,041 | 5.35 | -0.74 | |||
| People's Movement against the EU | 733 | 3.77 | -2.59 | |||
| Social Liberals | 707 | 3.63 | -3.60 | |||
| Christian Democrats | 379 | 1.95 | -1.03 | |||
| Total | 19,468 | |||||
| Source[51] | ||||||
1999 European Parliament election in Denmark
| Parties | Vote | |||||
|---|---|---|---|---|---|---|
| Votes | % | + / - | ||||
| Venstre | 4,710 | 23.60 | +3.13 | |||
| Social Democrats | 3,804 | 19.06 | +1.47 | |||
| June Movement | 3,458 | 17.33 | +3.86 | |||
| Conservatives | 1,521 | 7.62 | -7.97 | |||
| Social Liberals | 1,443 | 7.23 | +0.47 | |||
| Danish People's Party | 1,272 | 6.37 | New | |||
| People's Movement against the EU | 1,270 | 6.36 | -1.95 | |||
| Green Left | 1,215 | 6.09 | -6.28 | |||
| Centre Democrats | 670 | 3.36 | +2.63 | |||
| Christian Democrats | 594 | 2.98 | +1.38 | |||
| Progress Party | 142 | 0.71 | -2.40 | |||
| Total | 19,957 | |||||
| Source[52] | ||||||
1994 European Parliament election in Denmark
| Parties | Vote | |||||
|---|---|---|---|---|---|---|
| Votes | % | + / - | ||||
| Venstre | 4,315 | 20.47 | +6.84 | |||
| Social Democrats | 3,708 | 17.59 | -12.92 | |||
| Conservatives | 3,286 | 15.59 | +0.54 | |||
| June Movement | 2,839 | 13.47 | New | |||
| Green Left | 2,608 | 12.37 | +5.55 | |||
| People's Movement against the EU | 1,751 | 8.31 | -8.00 | |||
| Social Liberals | 1,424 | 6.76 | +4.88 | |||
| Progress Party | 655 | 3.11 | -2.98 | |||
| Christian Democrats | 337 | 1.60 | -1.55 | |||
| Centre Democrats | 154 | 0.73 | -5.81 | |||
| Total | 21,077 | |||||
| Source[53] | ||||||
1989 European Parliament election in Denmark
| Parties | Vote | |||||
|---|---|---|---|---|---|---|
| Votes | % | + / - | ||||
| Social Democrats | 5,595 | 30.51 | +5.70 | |||
| People's Movement against the EU | 2,991 | 16.31 | -1.74 | |||
| Conservatives | 2,760 | 15.05 | -6.20 | |||
| Venstre | 2,500 | 13.63 | +2.87 | |||
| Green Left | 1,251 | 6.82 | -1.03 | |||
| Centre Democrats | 1,200 | 6.54 | -0.14 | |||
| Progress Party | 1,117 | 6.09 | +2.67 | |||
| Christian Democrats | 577 | 3.15 | -0.59 | |||
| Social Liberals | 345 | 1.88 | -0.79 | |||
| Total | 18,336 | |||||
| Source[54] | ||||||
1984 European Parliament election in Denmark
| Parties | Vote | |||||
|---|---|---|---|---|---|---|
| Votes | % | |||||
| Social Democrats | 4,995 | 24.81 | ||||
| Conservatives | 4,279 | 21.25 | ||||
| People's Movement against the EU | 3,634 | 18.05 | ||||
| Venstre | 2,167 | 10.76 | ||||
| Green Left | 1,581 | 7.85 | ||||
| Centre Democrats | 1,344 | 6.68 | ||||
| Christian Democrats | 752 | 3.74 | ||||
| Progress Party | 688 | 3.42 | ||||
| Social Liberals | 537 | 2.67 | ||||
| Left Socialists | 156 | 0.77 | ||||
| Total | 20,133 | |||||
| Source[55] | ||||||
Referendums
2022 Danish European Union opt-out referendum[56]
| Option | Votes | % |
|---|---|---|
| ✓ YES | 15,271 | 62.23 |
| X NO | 9,268 | 37.77 |
2015 Danish European Union opt-out referendum[57]
| Option | Votes | % |
|---|---|---|
| X NO | 15,582 | 58.98 |
| ✓ YES | 10,838 | 41.02 |
2014 Danish Unified Patent Court membership referendum[58]
| Option | Votes | % |
|---|---|---|
| ✓ YES | 11,166 | 58.89 |
| X NO | 7,796 | 41.11 |
2009 Danish Act of Succession referendum[59]
| Option | Votes | % |
|---|---|---|
| ✓ YES | 16,262 | 84.35 |
| X NO | 3,017 | 15.65 |
2000 Danish euro referendum[60]
| Option | Votes | % |
|---|---|---|
| X NO | 20,494 | 54.62 |
| ✓ YES | 17,026 | 45.38 |
1998 Danish Amsterdam Treaty referendum[61]
| Option | Votes | % |
|---|---|---|
| ✓ YES | 17,165 | 52.46 |
| X NO | 15,556 | 47.54 |
1993 Danish Maastricht Treaty referendum[62]
| Option | Votes | % |
|---|---|---|
| ✓ YES | 21,220 | 57.02 |
| X NO | 15,996 | 42.98 |
1992 Danish Maastricht Treaty referendum[63]
| Option | Votes | % |
|---|---|---|
| X NO | 18,331 | 51.28 |
| ✓ YES | 17,417 | 48.72 |
1986 Danish Single European Act referendum[64]
| Option | Votes | % |
|---|---|---|
| ✓ YES | 18,008 | 59.00 |
| X NO | 12,513 | 41.00 |
1972 Danish European Communities membership referendum[65]
| Option | Votes | % |
|---|---|---|
| ✓ YES | 20,553 | 65.53 |
| X NO | 10,813 | 34.47 |
1953 Danish constitutional and electoral age referendum[66]
| Option | Votes | % |
|---|---|---|
| ✓ YES | 12,317 | 78.06 |
| X NO | 3,461 | 21.94 |
| 23 years | 8,833 | 55.39 |
| 21 years | 7,114 | 44.61 |
1939 Danish constitutional referendum[67]
| Option | Votes | % |
|---|---|---|
| ✓ YES | 9,397 | 88.35 |
| X NO | 1,239 | 11.65 |
References
- "Fredericiakredsen". kmdvalg.dk (in Danish). Retrieved 2023-06-04.
- "Beretning om Forhandlingerne paa Rigsdagen". Rigsdagstidende. II: Spalte 3892 ff.
- "Nye valgkredse fordeler stemmerne anderledes". dr.dk (in Danish). Retrieved 2023-06-04.
- "Beretning om nye valgkredse som følge af kommunalreformen" (in Danish). Retrieved 2023-06-04.
- "Det danske valgsystem: Valg til Folketinget". valg.im (in Danish). Retrieved 2023-06-04.
- "59 Fredericia". dataforsyningen.dk (in Danish). Retrieved 2023-06-04.
- "Beretning om Forhandlingerne paa Rigsdagen". Rigsdagstidende. II: Spalte 3892 ff.
- "Valgresultater fra tidligere valg:". kmdvalg (in Danish). Retrieved 2023-06-04.
- "FOLKETINGSVALG TIRSDAG 1. NOVEMBER 2022". valg.im (in Danish). Retrieved 2023-06-27.
- "FOLKETINGSVALG ONSDAG 5. JUNI 2019". valg.im (in Danish). Retrieved 2023-06-27.
- "FOLKETINGSVALG TORSDAG 18. JUNI 2015". valg.im (in Danish). Retrieved 2023-06-27.
- "FOLKETINGSVALG TORSDAG 15. SEPTEMBER 2011". valg.im (in Danish). Retrieved 2023-06-27.
- "Folketingsvalget den 13. november 2007". valg.im (in Danish). Retrieved 2023-06-27.
- "valg2005.book" (PDF). valg.im (in Danish). Retrieved 2023-06-27.
- "BMTABEL" (PDF). valg.im (in Danish). Retrieved 2023-06-27.
- "VALG98" (PDF). valg.im (in Danish). Retrieved 2023-06-27.
- "VALG94" (PDF). valg.im (in Danish). Retrieved 2023-06-27.
- "VALG90" (PDF). valg.im (in Danish). Retrieved 2023-06-27.
- "Folketingsvalget den 10. maj 1988". valg.im (in Danish). Retrieved 2023-06-27.
- "Folketingsvalget den 8.september 1987". dst.dk (in Danish). Retrieved 2023-06-27.
- "Folketingsvalget den 10. januar 1984". dst.dk (in Danish). Retrieved 2023-06-27.
- "Folketingsvalget den 8. december 1981". dst.dk (in Danish). Retrieved 2023-06-27.
- "Folketingsvalget den 23. oktober 1979". dst.dk (in Danish). Retrieved 2023-06-27.
- "Folketingsvalget den 15. februar 1977". dst.dk (in Danish). Retrieved 2023-06-27.
- "Folketingsvalget den 9. januar 1975". dst.dk (in Danish). Retrieved 2023-06-27.
- "Folketingsvalget den 4. december 1973". dst.dk (in Danish). Retrieved 2023-06-27.
- "Folketingsvalget den 21. september 1971 samt folkeafstemningen". dst.dk (in Danish). Retrieved 2023-06-27.
- "Folketingsvalget den 23. januar 1968". dst.dk (in Danish). Retrieved 2023-06-27.
- "Folketingsvalget den 22. november 1966". dst.dk (in Danish). Retrieved 2023-06-27.
- "Folketingsvalget den 22. september 1964". dst.dk (in Danish). Retrieved 2023-06-27.
- "Folketingsvalget den 15. november 1960". dst.dk (in Danish). Retrieved 2023-06-27.
- "Folketingsvalget den 14. maj 1957". dst.dk (in Danish). Retrieved 2023-06-27.
- "Folketingsvalget den 22. september 1953". dst.dk (in Danish). Retrieved 2023-06-27.
- "Rigsdagsvalgene og folkeafstemningerne i april og maj 1953". dst.dk (in Danish). Retrieved 2023-06-27.
- "Folketingsvalget den 5. september 1950". dst.dk (in Danish). Retrieved 2023-06-27.
- "Folketingsvalget den 28. oktober 1947". dst.dk (in Danish). Retrieved 2023-06-27.
- "Rigsdagsvalgene i oktober og november 1945". dst.dk (in Danish). Retrieved 2023-06-27.
- "Rigsdagsvalgene i marts og april 1943". dst.dk (in Danish). Retrieved 2023-06-27.
- "Rigsdagsvalgene og Folkeafstemningen i april og maj 1939". dst.dk (in Danish). Retrieved 2023-06-27.
- "Folketingsvalget den 22. oktober 1935". dst.dk (in Danish). Retrieved 2023-06-27.
- "Folketingsvalget den 16. november 1932". dst.dk (in Danish). Retrieved 2023-06-27.
- "Folketingsvalget den 24. april 1929". dst.dk (in Danish). Retrieved 2023-06-27.
- "Folketingsvalget den 2. december 1926". dst.dk (in Danish). Retrieved 2023-06-27.
- "Folketingsvalget den 11. april 1924". dst.dk (in Danish). Retrieved 2023-06-27.
- "Rigsdagsvalgene september-oktober 1920". dst.dk (in Danish). Retrieved 2023-06-27.
- "Rigsdagsvalgene juli-august 1920". dst.dk (in Danish). Retrieved 2023-06-27.
- "Folketingsvalget den 26. april 1920". dst.dk (in Danish). Retrieved 2023-06-27.
- "EUROPA-PARLAMENTSVALG SØNDAG 26. MAJ 2019". dst.dk (in Danish). Retrieved 2023-07-01.
- "EUROPA-PARLAMENTSVALG SØNDAG 25. MAJ 2014". dst.dk (in Danish). Retrieved 2023-07-01.
- "EUROPA-PARLAMENTSVALG SØNDAG 7. JUNI 2009". dst.dk (in Danish). Retrieved 2023-07-01.
- "EUROPA-PARLAMENTSVALGET DEN 13. JUNI 2004" (PDF). im.dk (in Danish). Retrieved 2023-07-01.
- "VALGET TIL EUROPA-PARLAMENTET DEN 10. JUNI 1999" (PDF). im.dk (in Danish). Retrieved 2023-07-01.
- "VALGET TIL EUROPA-PARLAMENTET DEN 9. JUNI 1994" (PDF). im.dk (in Danish). Retrieved 2023-07-01.
- "Valget til Europa-parlamentet den 15. juni 1989". dst.dk (in Danish). Retrieved 2023-07-01.
- "Valget til Europa-Parlamentet den 14. juni 1984". dst.dk (in Danish). Retrieved 2023-07-01.
- "FOLKEAFSTEMNING ONSDAG 1. JUNI 2022". dst.dk (in Danish). Retrieved 2023-07-05.
- "FOLKEAFSTEMNING TORSDAG 3. DECEMBER 2015". dst.dk (in Danish). Retrieved 2023-07-05.
- "FOLKEAFSTEMNING SØNDAG 25. MAJ 2014". dst.dk (in Danish). Retrieved 2023-07-05.
- "FOLKEAFSTEMNING SØNDAG 7. JUNI 2009". dst.dk (in Danish). Retrieved 2023-07-05.
- "FOLKEAFSTEMNINGEN DEN 28. SEPTEMBER 2000 OM DANMARKS DELTAGELSE I DEN FÆLLES VALUTA" (PDF). valg.im (in Danish). Retrieved 2023-07-05.
- "FOLKEAFSTEMNINGEN DEN 28. MAJ 1998OM DANMARKS TILTRÆDELSE AF AMSTERDAMTRAKTATEN" (PDF). valg.im (in Danish). Retrieved 2023-07-05.
- "FOLKEAFSTEMNINGEN DEN 18. MAJ 1993 OM DANMARKS TILTRÆDELSE AF EDINBURGH-AFGØRELSEN OG MAASTRICHT-TRAKTATEN". dst.dk (in Danish). Retrieved 2023-07-05.
- "Folkeafstemningen den 1. juni 1992 om Danmarks tiltrædelse af traktaten om Den Europæiske Union". dst.dk (in Danish). Retrieved 2023-07-05.
- "Vejledende folkeafstemning torsdag den 27. februar 1986 om Danmarks tiltrædelse af EF- pakken". dst.dk (in Danish). Retrieved 2023-07-05.
- "Folkeafstemningen om Danmarks tiltrædelse af De europæiske Fælleskaber 2. oktober 1972". dst.dk (in Danish). Retrieved 2023-07-05.
- "Publikationsfortegnelse vedrørende Folkeafstemninger". dst.dk (in Danish). Retrieved 2023-07-05.
- "Publikationsfortegnelse vedrørende Folkeafstemninger". dst.dk (in Danish). Retrieved 2023-07-05.