Gladsaxe (nomination district)
Gladsaxe nominating district is one of the 92 nominating districts that exists for Danish elections following the 2007 municipal reform.[3][4][5] It consists of Gladsaxe Municipality.[6] It was created in 1950,[7] though its boundaries have been changed since then.
| Gladsaxe | |
|---|---|
| Gladsaxe | |
| Nomination district constituency for the Folketing | |
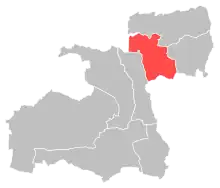 Location of Gladsaxe within Greater Copenhagen | |
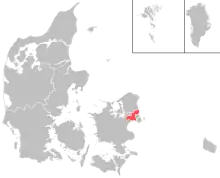 Location of Greater Copenhagen within Denmark | |
| Municipalities | Gladsaxe |
| Constituency | Greater Copenhagen |
| Electorate | 45,846 (2022)[1] |
| Current constituency | |
| Created | 1950[2] |
In general elections, the district is a very strong area for parties commonly associated with the red bloc.[8]
General elections results
General elections in the 2020s
| Parties | Vote | |||||
|---|---|---|---|---|---|---|
| Votes | % | + / - | ||||
| Social Democrats | 10,387 | 27.65 | +2.02 | |||
| Green Left | 4,372 | 11.64 | -0.14 | |||
| Moderates | 4,079 | 10.86 | New | |||
| Venstre | 3,570 | 9.50 | -6.58 | |||
| Liberal Alliance | 2,745 | 7.31 | +4.83 | |||
| Red–Green Alliance | 2,587 | 6.89 | -1.91 | |||
| Social Liberals | 2,418 | 6.44 | -6.07 | |||
| Conservatives | 1,805 | 4.80 | -1.73 | |||
| The Alternative | 1,466 | 3.90 | +0.46 | |||
| Danish People's Party | 1,205 | 3.21 | -3.95 | |||
| Denmark Democrats | 1,171 | 3.12 | New | |||
| New Right | 914 | 2.43 | +0.54 | |||
| Independent Greens | 668 | 1.78 | New | |||
| Christian Democrats | 130 | 0.35 | -0.56 | |||
| Jovan Tasevski | 42 | 0.11 | New | |||
| Henrik Vendelbo Petersen | 7 | 0.02 | New | |||
| Total | 37,566 | |||||
| Source[9] | ||||||
General elections in the 2010s
| Parties | Vote | |||||
|---|---|---|---|---|---|---|
| Votes | % | + / - | ||||
| Social Democrats | 9,977 | 25.63 | -4.14 | |||
| Venstre | 6,260 | 16.08 | +2.43 | |||
| Social Liberals | 4,869 | 12.51 | +5.77 | |||
| Green Left | 4,584 | 11.78 | +6.33 | |||
| Red–Green Alliance | 3,424 | 8.80 | -1.17 | |||
| Danish People's Party | 2,787 | 7.16 | -10.29 | |||
| Conservatives | 2,543 | 6.53 | +3.39 | |||
| The Alternative | 1,339 | 3.44 | -2.16 | |||
| Liberal Alliance | 965 | 2.48 | -5.19 | |||
| New Right | 737 | 1.89 | New | |||
| Stram Kurs | 653 | 1.68 | New | |||
| Christian Democrats | 354 | 0.91 | +0.43 | |||
| Klaus Riskær Pedersen Party | 336 | 0.86 | New | |||
| Mads Palsvig | 89 | 0.23 | New | |||
| Christian B. Olesen | 4 | 0.01 | New | |||
| Total | 38,921 | |||||
| Source[10] | ||||||
| Parties | Vote | |||||
|---|---|---|---|---|---|---|
| Votes | % | + / - | ||||
| Social Democrats | 11,629 | 29.77 | +3.82 | |||
| Danish People's Party | 6,817 | 17.45 | +5.87 | |||
| Venstre | 5,333 | 13.65 | -6.61 | |||
| Red–Green Alliance | 3,895 | 9.97 | +0.76 | |||
| Liberal Alliance | 2,997 | 7.67 | +2.92 | |||
| Social Liberals | 2,632 | 6.74 | -5.93 | |||
| The Alternative | 2,187 | 5.60 | New | |||
| Green Left | 2,127 | 5.45 | -4.24 | |||
| Conservatives | 1,225 | 3.14 | -2.29 | |||
| Christian Democrats | 186 | 0.48 | +0.11 | |||
| Asif Ahmad | 32 | 0.08 | New | |||
| Christian Olesen | 3 | 0.01 | New | |||
| Total | 39,063 | |||||
| Source[11] | ||||||
| Parties | Vote | |||||
|---|---|---|---|---|---|---|
| Votes | % | + / - | ||||
| Social Democrats | 10,329 | 25.95 | -1.76 | |||
| Venstre | 8,064 | 20.26 | +1.85 | |||
| Social Liberals | 5,043 | 12.67 | +5.93 | |||
| Danish People's Party | 4,609 | 11.58 | -1.76 | |||
| Green Left | 3,855 | 9.69 | -5.93 | |||
| Red–Green Alliance | 3,667 | 9.21 | +5.84 | |||
| Conservatives | 2,162 | 5.43 | -5.22 | |||
| Liberal Alliance | 1,890 | 4.75 | +1.10 | |||
| Christian Democrats | 148 | 0.37 | -0.13 | |||
| Christian H. Hansen | 30 | 0.08 | New | |||
| Total | 39,797 | |||||
| Source[12] | ||||||
General elections in the 2000s
| Parties | Vote | |||||
|---|---|---|---|---|---|---|
| Votes | % | + / - | ||||
| Social Democrats | 10,780 | 27.71 | +1.18 | |||
| Venstre | 7,164 | 18.41 | -2.78 | |||
| Green Left | 6,077 | 15.62 | +7.64 | |||
| Danish People's Party | 5,192 | 13.34 | -0.62 | |||
| Conservatives | 4,144 | 10.65 | +0.15 | |||
| Social Liberals | 2,622 | 6.74 | -4.67 | |||
| New Alliance | 1,420 | 3.65 | New | |||
| Red–Green Alliance | 1,312 | 3.37 | -1.74 | |||
| Christian Democrats | 196 | 0.50 | -0.56 | |||
| Feride Istogu Gillesberg | 1 | 0.00 | New | |||
| Janus Kramer Møller | 1 | 0.00 | New | |||
| Total | 38,909 | |||||
| Source[13] | ||||||
| Parties | Vote | |||||
|---|---|---|---|---|---|---|
| Votes | % | + / - | ||||
| Social Democrats | 10,079 | 26.53 | -3.80 | |||
| Venstre | 8,051 | 21.19 | -3.27 | |||
| Danish People's Party | 5,304 | 13.96 | +0.62 | |||
| Social Liberals | 4,335 | 11.41 | +5.19 | |||
| Conservatives | 3,989 | 10.50 | +2.75 | |||
| Green Left | 3,032 | 7.98 | -0.91 | |||
| Red–Green Alliance | 1,941 | 5.11 | +1.23 | |||
| Centre Democrats | 726 | 1.91 | -1.20 | |||
| Christian Democrats | 402 | 1.06 | -0.64 | |||
| Minority Party | 134 | 0.35 | New | |||
| Nahid Yazdanyar | 3 | 0.01 | New | |||
| Total | 37,996 | |||||
| Source[14] | ||||||
| Parties | Vote | |||||
|---|---|---|---|---|---|---|
| Votes | % | + / - | ||||
| Social Democrats | 12,023 | 30.33 | -6.84 | |||
| Venstre | 9,698 | 24.46 | +8.82 | |||
| Danish People's Party | 5,289 | 13.34 | +3.73 | |||
| Green Left | 3,523 | 8.89 | -0.98 | |||
| Conservatives | 3,071 | 7.75 | -0.43 | |||
| Social Liberals | 2,464 | 6.22 | +2.09 | |||
| Red–Green Alliance | 1,539 | 3.88 | -0.58 | |||
| Centre Democrats | 1,234 | 3.11 | -4.52 | |||
| Christian People's Party | 674 | 1.70 | +0.18 | |||
| Progress Party | 130 | 0.33 | -0.90 | |||
| Total | 39,645 | |||||
| Source[15] | ||||||
General elections in the 1990s
| Parties | Vote | |||||
|---|---|---|---|---|---|---|
| Votes | % | + / - | ||||
| Social Democrats | 14,747 | 37.17 | +2.99 | |||
| Venstre | 6,206 | 15.64 | +0.95 | |||
| Green Left | 3,914 | 9.87 | -0.03 | |||
| Danish People's Party | 3,814 | 9.61 | New | |||
| Conservatives | 3,247 | 8.18 | -8.36 | |||
| Centre Democrats | 3,028 | 7.63 | +1.28 | |||
| Red–Green Alliance | 1,769 | 4.46 | -0.13 | |||
| Social Liberals | 1,639 | 4.13 | -1.02 | |||
| Christian People's Party | 603 | 1.52 | +0.33 | |||
| Progress Party | 487 | 1.23 | -4.39 | |||
| Mogens Glistrup | 107 | 0.27 | -0.28 | |||
| Democratic Renewal | 105 | 0.26 | New | |||
| Poul Bregninge | 8 | 0.02 | New | |||
| Anders Kofoed | 1 | 0.00 | New | |||
| Total | 39,675 | |||||
| Source[16] | ||||||
| Parties | Vote | |||||
|---|---|---|---|---|---|---|
| Votes | % | + / - | ||||
| Social Democrats | 13,503 | 34.18 | -4.47 | |||
| Conservatives | 6,533 | 16.54 | +0.15 | |||
| Venstre | 5,803 | 14.69 | +6.74 | |||
| Green Left | 3,912 | 9.90 | -0.65 | |||
| Centre Democrats | 2,508 | 6.35 | -4.39 | |||
| Progress Party | 2,222 | 5.62 | +2.12 | |||
| Social Liberals | 2,034 | 5.15 | +1.05 | |||
| Red–Green Alliance | 1,814 | 4.59 | +1.95 | |||
| Christian People's Party | 472 | 1.19 | -0.03 | |||
| Niels I. Meyer | 353 | 0.89 | New | |||
| Mogens Glistrup | 219 | 0.55 | New | |||
| Preben Møller Hansen | 131 | 0.33 | New | |||
| Torben Faber | 4 | 0.01 | New | |||
| John Ziegler | 2 | 0.01 | New | |||
| Total | 39,510 | |||||
| Source[17] | ||||||
| Parties | Vote | |||||
|---|---|---|---|---|---|---|
| Votes | % | + / - | ||||
| Social Democrats | 15,065 | 38.65 | +8.96 | |||
| Conservatives | 6,387 | 16.39 | -2.24 | |||
| Centre Democrats | 4,187 | 10.74 | +1.00 | |||
| Green Left | 4,111 | 10.55 | -7.08 | |||
| Venstre | 3,098 | 7.95 | +3.83 | |||
| Social Liberals | 1,599 | 4.10 | -2.80 | |||
| Progress Party | 1,366 | 3.50 | -3.07 | |||
| Red–Green Alliance | 1,029 | 2.64 | New | |||
| Common Course | 1,023 | 2.62 | +0.47 | |||
| Christian People's Party | 474 | 1.22 | +0.10 | |||
| The Greens | 350 | 0.90 | -1.02 | |||
| Justice Party of Denmark | 267 | 0.69 | New | |||
| Humanist Party | 21 | 0.05 | New | |||
| Total | 38,977 | |||||
| Source[18] | ||||||
General elections in the 1980s
| Parties | Vote | |||||
|---|---|---|---|---|---|---|
| Votes | % | + / - | ||||
| Social Democrats | 12,188 | 29.69 | +2.12 | |||
| Conservatives | 7,648 | 18.63 | -0.14 | |||
| Green Left | 7,239 | 17.63 | -2.39 | |||
| Centre Democrats | 3,997 | 9.74 | -0.24 | |||
| Social Liberals | 2,833 | 6.90 | -0.68 | |||
| Progress Party | 2,697 | 6.57 | +2.77 | |||
| Venstre | 1,690 | 4.12 | +1.72 | |||
| Common Course | 882 | 2.15 | -0.52 | |||
| The Greens | 790 | 1.92 | +0.19 | |||
| Christian People's Party | 458 | 1.12 | -0.19 | |||
| Left Socialists | 360 | 0.88 | -1.14 | |||
| Communist Party of Denmark | 271 | 0.66 | -0.58 | |||
| Leif Hilt | 3 | 0.01 | New | |||
| Total | 41,056 | |||||
| Source[19] | ||||||
| Parties | Vote | |||||
|---|---|---|---|---|---|---|
| Votes | % | + / - | ||||
| Social Democrats | 11,599 | 27.57 | -4.21 | |||
| Green Left | 8,424 | 20.02 | +4.00 | |||
| Conservatives | 7,898 | 18.77 | -2.82 | |||
| Centre Democrats | 4,199 | 9.98 | +1.80 | |||
| Social Liberals | 3,189 | 7.58 | +1.15 | |||
| Progress Party | 1,598 | 3.80 | +0.93 | |||
| Common Course | 1,124 | 2.67 | New | |||
| Venstre | 1,011 | 2.40 | -1.51 | |||
| Left Socialists | 848 | 2.02 | -2.44 | |||
| The Greens | 726 | 1.73 | New | |||
| Christian People's Party | 551 | 1.31 | -0.28 | |||
| Communist Party of Denmark | 520 | 1.24 | +0.22 | |||
| Justice Party of Denmark | 246 | 0.58 | -1.46 | |||
| Humanist Party | 99 | 0.24 | New | |||
| Socialist Workers Party | 23 | 0.05 | -0.02 | |||
| Marxist–Leninists Party | 17 | 0.04 | +0.02 | |||
| Carsten Grøn-Nielsen | 2 | 0.00 | -0.01 | |||
| Per Hillersborg | 0 | 0.00 | New | |||
| Total | 42,074 | |||||
| Source[20] | ||||||
| Parties | Vote | |||||
|---|---|---|---|---|---|---|
| Votes | % | + / - | ||||
| Social Democrats | 13,707 | 31.78 | +0.02 | |||
| Conservatives | 9,310 | 21.59 | +6.30 | |||
| Green Left | 6,910 | 16.02 | +0.60 | |||
| Centre Democrats | 3,528 | 8.18 | -4.18 | |||
| Social Liberals | 2,773 | 6.43 | +0.86 | |||
| Left Socialists | 1,923 | 4.46 | -0.56 | |||
| Venstre | 1,686 | 3.91 | +1.32 | |||
| Progress Party | 1,238 | 2.87 | -4.11 | |||
| Justice Party of Denmark | 881 | 2.04 | +0.05 | |||
| Christian People's Party | 687 | 1.59 | +0.43 | |||
| Communist Party of Denmark | 438 | 1.02 | -0.58 | |||
| Socialist Workers Party | 29 | 0.07 | -0.01 | |||
| Marxist–Leninists Party | 10 | 0.02 | New | |||
| Carsten Grøn-Nielsen | 6 | 0.01 | New | |||
| Mogens Nebelong | 3 | 0.01 | 0.00 | |||
| Poul Rasmussen | 1 | 0.00 | New | |||
| Total | 43,130 | |||||
| Source[21] | ||||||
| Parties | Vote | |||||
|---|---|---|---|---|---|---|
| Votes | % | + / - | ||||
| Social Democrats | 13,022 | 31.76 | -7.30 | |||
| Green Left | 6,323 | 15.42 | +7.46 | |||
| Conservatives | 6,271 | 15.29 | +2.52 | |||
| Centre Democrats | 5,066 | 12.36 | +6.76 | |||
| Progress Party | 2,860 | 6.98 | -1.15 | |||
| Social Liberals | 2,285 | 5.57 | -1.18 | |||
| Left Socialists | 2,060 | 5.02 | -2.10 | |||
| Venstre | 1,060 | 2.59 | -1.89 | |||
| Justice Party of Denmark | 815 | 1.99 | -1.73 | |||
| Communist Party of Denmark | 655 | 1.60 | -0.94 | |||
| Christian People's Party | 475 | 1.16 | -0.06 | |||
| Communist Workers Party | 74 | 0.18 | -0.47 | |||
| Socialist Workers Party | 31 | 0.08 | New | |||
| Mogens Nebelong | 6 | 0.01 | New | |||
| Total | 41,003 | |||||
| Source[22] | ||||||
General elections in the 1970s
| Parties | Vote | |||||
|---|---|---|---|---|---|---|
| Votes | % | + / - | ||||
| Social Democrats | 16,470 | 39.06 | +1.82 | |||
| Conservatives | 5,384 | 12.77 | +4.78 | |||
| Progress Party | 3,427 | 8.13 | -3.70 | |||
| Green Left | 3,358 | 7.96 | +1.82 | |||
| Left Socialists | 3,002 | 7.12 | +1.95 | |||
| Social Liberals | 2,846 | 6.75 | +3.75 | |||
| Centre Democrats | 2,360 | 5.60 | -7.88 | |||
| Venstre | 1,888 | 4.48 | +1.22 | |||
| Justice Party of Denmark | 1,570 | 3.72 | -0.83 | |||
| Communist Party of Denmark | 1,070 | 2.54 | -2.40 | |||
| Christian People's Party | 516 | 1.22 | -0.31 | |||
| Communist Workers Party | 276 | 0.65 | New | |||
| Total | 42,167 | |||||
| Source[23] | ||||||
| Parties | Vote | |||||
|---|---|---|---|---|---|---|
| Votes | % | + / - | ||||
| Social Democrats | 15,854 | 37.24 | +9.98 | |||
| Centre Democrats | 5,738 | 13.48 | +5.51 | |||
| Progress Party | 5,035 | 11.83 | -1.58 | |||
| Conservatives | 3,402 | 7.99 | +1.59 | |||
| Green Left | 2,615 | 6.14 | -2.74 | |||
| Left Socialists | 2,202 | 5.17 | +1.05 | |||
| Communist Party of Denmark | 2,104 | 4.94 | -1.13 | |||
| Justice Party of Denmark | 1,936 | 4.55 | +2.15 | |||
| Venstre | 1,389 | 3.26 | -10.61 | |||
| Social Liberals | 1,275 | 3.00 | -3.37 | |||
| Christian People's Party | 651 | 1.53 | -1.70 | |||
| Pensioners' Party | 366 | 0.86 | New | |||
| Otto Jensen | 0 | 0.00 | New | |||
| Poul Rasmussen | 0 | 0.00 | New | |||
| Total | 42,567 | |||||
| Source[24] | ||||||
| Parties | Vote | |||||
|---|---|---|---|---|---|---|
| Votes | % | + / - | ||||
| Social Democrats | 11,617 | 27.26 | +8.83 | |||
| Venstre | 5,910 | 13.87 | +9.30 | |||
| Progress Party | 5,713 | 13.41 | -0.37 | |||
| Green Left | 3,783 | 8.88 | -0.66 | |||
| Centre Democrats | 3,396 | 7.97 | -15.36 | |||
| Conservatives | 2,729 | 6.40 | -2.42 | |||
| Social Liberals | 2,714 | 6.37 | -0.94 | |||
| Communist Party of Denmark | 2,587 | 6.07 | +0.39 | |||
| Left Socialists | 1,755 | 4.12 | +1.16 | |||
| Christian People's Party | 1,378 | 3.23 | +1.19 | |||
| Justice Party of Denmark | 1,022 | 2.40 | -1.13 | |||
| J. G. Amdrejcak | 4 | 0.01 | New | |||
| Kai Clemmensen | 1 | 0.00 | New | |||
| Poul Friborg | 0 | 0.00 | New | |||
| Henning Glahn | 0 | 0.00 | New | |||
| Total | 42,609 | |||||
| Source[25] | ||||||
| Parties | Vote | |||||
|---|---|---|---|---|---|---|
| Votes | % | + / - | ||||
| Centre Democrats | 10,252 | 23.33 | New | |||
| Social Democrats | 8,101 | 18.43 | -20.61 | |||
| Progress Party | 6,057 | 13.78 | New | |||
| Green Left | 4,193 | 9.54 | -4.29 | |||
| Conservatives | 3,877 | 8.82 | -12.38 | |||
| Social Liberals | 3,211 | 7.31 | -5.46 | |||
| Communist Party of Denmark | 2,497 | 5.68 | +3.66 | |||
| Venstre | 2,008 | 4.57 | -0.43 | |||
| Justice Party of Denmark | 1,551 | 3.53 | +1.60 | |||
| Left Socialists | 1,300 | 2.96 | -0.21 | |||
| Christian People's Party | 896 | 2.04 | +1.21 | |||
| Erik Dissing | 6 | 0.01 | New | |||
| Total | 43,949 | |||||
| Source[26] | ||||||
| Parties | Vote | |||||
|---|---|---|---|---|---|---|
| Votes | % | + / - | ||||
| Social Democrats | 16,826 | 39.04 | +5.61 | |||
| Conservatives | 9,136 | 21.20 | -7.38 | |||
| Green Left | 5,958 | 13.83 | +5.92 | |||
| Social Liberals | 5,502 | 12.77 | -4.28 | |||
| Venstre | 2,155 | 5.00 | +0.58 | |||
| Left Socialists | 1,367 | 3.17 | -0.61 | |||
| Communist Party of Denmark | 869 | 2.02 | +0.57 | |||
| Justice Party of Denmark | 832 | 1.93 | +1.43 | |||
| Christian People's Party | 356 | 0.83 | New | |||
| Henning Berthelsen | 94 | 0.22 | New | |||
| Total | 43,095 | |||||
| Source[27] | ||||||
General elections in the 1960s
| Parties | Vote | |||||
|---|---|---|---|---|---|---|
| Votes | % | + / - | ||||
| Social Democrats | 14,383 | 33.43 | -2.87 | |||
| Conservatives | 12,296 | 28.58 | +1.53 | |||
| Social Liberals | 7,337 | 17.05 | +9.32 | |||
| Green Left | 3,402 | 7.91 | -7.67 | |||
| Venstre | 1,903 | 4.42 | -1.46 | |||
| Left Socialists | 1,625 | 3.78 | New | |||
| Liberal Centre | 1,155 | 2.68 | -2.31 | |||
| Communist Party of Denmark | 623 | 1.45 | +0.34 | |||
| Justice Party of Denmark | 213 | 0.50 | +0.06 | |||
| Independent Party | 88 | 0.20 | -0.70 | |||
| H. Søndersted Andersen | 0 | 0.00 | New | |||
| Kirsten Lonning | 0 | 0.00 | New | |||
| Thode karlsen | 0 | 0.00 | -0.01 | |||
| Total | 43,025 | |||||
| Source[28] | ||||||
| Parties | Vote | |||||
|---|---|---|---|---|---|---|
| Votes | % | + / - | ||||
| Social Democrats | 15,380 | 36.30 | -7.68 | |||
| Conservatives | 11,461 | 27.05 | -0.46 | |||
| Green Left | 6,602 | 15.58 | +6.11 | |||
| Social Liberals | 3,275 | 7.73 | +3.52 | |||
| Venstre | 2,492 | 5.88 | -3.30 | |||
| Liberal Centre | 2,114 | 4.99 | New | |||
| Communist Party of Denmark | 469 | 1.11 | -0.81 | |||
| Independent Party | 380 | 0.90 | -0.98 | |||
| Justice Party of Denmark | 188 | 0.44 | -0.52 | |||
| Thode Karlsen | 5 | 0.01 | New | |||
| Total | 42,366 | |||||
| Source[29] | ||||||
| Parties | Vote | |||||
|---|---|---|---|---|---|---|
| Votes | % | + / - | ||||
| Social Democrats | 35,216 | 43.98 | -2.79 | |||
| Conservatives | 22,022 | 27.51 | +2.61 | |||
| Green Left | 7,580 | 9.47 | -0.99 | |||
| Venstre | 7,351 | 9.18 | +1.15 | |||
| Social Liberals | 3,369 | 4.21 | +0.09 | |||
| Communist Party of Denmark | 1,535 | 1.92 | +0.20 | |||
| Independent Party | 1,508 | 1.88 | -0.31 | |||
| Justice Party of Denmark | 766 | 0.96 | -0.86 | |||
| Peace Politics People's Party | 402 | 0.50 | New | |||
| Danish Unity | 282 | 0.35 | New | |||
| Elin Høgsbro Appel | 33 | 0.04 | New | |||
| Total | 80,064 | |||||
| Source[30] | ||||||
| Parties | Vote | |||||
|---|---|---|---|---|---|---|
| Votes | % | + / - | ||||
| Social Democrats | 33,272 | 46.77 | +1.93 | |||
| Conservatives | 17,714 | 24.90 | +1.86 | |||
| Green Left | 7,438 | 10.46 | New | |||
| Venstre | 5,710 | 8.03 | -2.97 | |||
| Social Liberals | 2,933 | 4.12 | -3.24 | |||
| Independent Party | 1,555 | 2.19 | +0.59 | |||
| Justice Party of Denmark | 1,294 | 1.82 | -4.80 | |||
| Communist Party of Denmark | 1,220 | 1.72 | -3.81 | |||
| Total | 71,136 | |||||
| Source[31] | ||||||
General elections in the 1950s
| Parties | Vote | |||||
|---|---|---|---|---|---|---|
| Votes | % | + / - | ||||
| Social Democrats | 26,055 | 44.84 | -3.03 | |||
| Conservatives | 13,390 | 23.04 | +0.49 | |||
| Venstre | 6,394 | 11.00 | +2.20 | |||
| Social Liberals | 4,279 | 7.36 | +0.30 | |||
| Justice Party of Denmark | 3,849 | 6.62 | +2.70 | |||
| Communist Party of Denmark | 3,213 | 5.53 | -2.45 | |||
| Independent Party | 929 | 1.60 | -0.20 | |||
| Total | 58,109 | |||||
| Source[32] | ||||||
September 1953 Danish Folketing election
| Parties | Vote | |||||
|---|---|---|---|---|---|---|
| Votes | % | + / - | ||||
| Social Democrats | 21,435 | 47.87 | +0.99 | |||
| Conservatives | 10,097 | 22.55 | +0.32 | |||
| Venstre | 3,942 | 8.80 | +2.30 | |||
| Communist Party of Denmark | 3,573 | 7.98 | -0.37 | |||
| Social Liberals | 3,163 | 7.06 | -0.92 | |||
| Justice Party of Denmark | 1,756 | 3.92 | -2.87 | |||
| Independent Party | 808 | 1.80 | New | |||
| Total | 44,774 | |||||
| Source[33] | ||||||
April 1953 Danish Folketing election
| Parties | Vote | |||||
|---|---|---|---|---|---|---|
| Votes | % | + / - | ||||
| Social Democrats | 19,519 | 46.88 | -0.61 | |||
| Conservatives | 9,256 | 22.23 | +0.73 | |||
| Communist Party of Denmark | 3,476 | 8.35 | -0.38 | |||
| Social Liberals | 3,324 | 7.98 | +1.18 | |||
| Justice Party of Denmark | 2,829 | 6.79 | -4.18 | |||
| Venstre | 2,705 | 6.50 | +2.00 | |||
| Danish Unity | 528 | 1.27 | New | |||
| Total | 41,637 | |||||
| Source[34] | ||||||
1950 Danish Folketing election
| Parties | Vote | |||||
|---|---|---|---|---|---|---|
| Votes | % | + / - | ||||
| Social Democrats | 15,860 | 47.49 | ||||
| Conservatives | 7,181 | 21.50 | ||||
| Justice Party of Denmark | 3,662 | 10.97 | ||||
| Communist Party of Denmark | 2,915 | 8.73 | ||||
| Social Liberals | 2,272 | 6.80 | ||||
| Venstre | 1,503 | 4.50 | ||||
| Total | 33,393 | |||||
| Source[35] | ||||||
European Parliament elections results
2019 European Parliament election in Denmark
| Parties | Vote | |||||
|---|---|---|---|---|---|---|
| Votes | % | + / - | ||||
| Social Democrats | 6,854 | 21.86 | +0.15 | |||
| Green Left | 5,563 | 17.74 | +4.04 | |||
| Venstre | 4,799 | 15.31 | +4.22 | |||
| Social Liberals | 4,260 | 13.59 | +4.60 | |||
| Danish People's Party | 2,667 | 8.51 | -14.74 | |||
| Red–Green Alliance | 2,083 | 6.64 | New | |||
| Conservatives | 1,908 | 6.09 | -1.14 | |||
| People's Movement against the EU | 1,444 | 4.61 | -6.44 | |||
| The Alternative | 1,160 | 3.70 | New | |||
| Liberal Alliance | 612 | 1.95 | -1.02 | |||
| Total | 31,350 | |||||
| Source[36] | ||||||
2014 European Parliament election in Denmark
| Parties | Vote | |||||
|---|---|---|---|---|---|---|
| Votes | % | + / - | ||||
| Danish People's Party | 6,338 | 23.25 | +8.51 | |||
| Social Democrats | 5,918 | 21.71 | +0.63 | |||
| Green Left | 3,736 | 13.70 | -4.34 | |||
| Venstre | 3,024 | 11.09 | -2.24 | |||
| People's Movement against the EU | 3,013 | 11.05 | -2.97 | |||
| Social Liberals | 2,452 | 8.99 | +3.14 | |||
| Conservatives | 1,970 | 7.23 | -2.91 | |||
| Liberal Alliance | 810 | 2.97 | +2.29 | |||
| Total | 27,261 | |||||
| Source[37] | ||||||
2009 European Parliament election in Denmark
| Parties | Vote | |||||
|---|---|---|---|---|---|---|
| Votes | % | + / - | ||||
| Social Democrats | 5,880 | 21.08 | -10.51 | |||
| Green Left | 5,032 | 18.04 | +7.38 | |||
| Danish People's Party | 4,112 | 14.74 | +7.27 | |||
| People's Movement against the EU | 3,912 | 14.02 | +4.65 | |||
| Venstre | 3,720 | 13.33 | +1.33 | |||
| Conservatives | 2,828 | 10.14 | -1.02 | |||
| Social Liberals | 1,633 | 5.85 | -1.66 | |||
| June Movement | 592 | 2.12 | -7.23 | |||
| Liberal Alliance | 191 | 0.68 | New | |||
| Total | 27,900 | |||||
| Source[38] | ||||||
2004 European Parliament election in Denmark
| Parties | Vote | |||||
|---|---|---|---|---|---|---|
| Votes | % | + / - | ||||
| Social Democrats | 7,481 | 31.59 | +15.92 | |||
| Venstre | 2,841 | 12.00 | -2.67 | |||
| Conservatives | 2,643 | 11.16 | +3.25 | |||
| Green Left | 2,525 | 10.66 | +0.68 | |||
| People's Movement against the EU | 2,219 | 9.37 | +0.24 | |||
| June Movement | 2,214 | 9.35 | -8.90 | |||
| Social Liberals | 1,779 | 7.51 | -2.44 | |||
| Danish People's Party | 1,770 | 7.47 | -0.29 | |||
| Christian Democrats | 207 | 0.87 | -0.41 | |||
| Total | 23,679 | |||||
| Source[39] | ||||||
1999 European Parliament election in Denmark
| Parties | Vote | |||||
|---|---|---|---|---|---|---|
| Votes | % | + / - | ||||
| June Movement | 4,613 | 18.25 | -0.32 | |||
| Social Democrats | 3,960 | 15.67 | +0.96 | |||
| Venstre | 3,709 | 14.67 | +4.73 | |||
| Green Left | 2,522 | 9.98 | -2.10 | |||
| Social Liberals | 2,515 | 9.95 | -0.33 | |||
| People's Movement against the EU | 2,307 | 9.13 | -3.36 | |||
| Conservatives | 2,000 | 7.91 | -8.97 | |||
| Danish People's Party | 1,962 | 7.76 | New | |||
| Centre Democrats | 1,366 | 5.40 | +3.65 | |||
| Christian Democrats | 323 | 1.28 | +0.58 | |||
| Progress Party | 103 | 0.41 | -2.19 | |||
| Total | 25,277 | |||||
| Source[40] | ||||||
1994 European Parliament election in Denmark
| Parties | Vote | |||||
|---|---|---|---|---|---|---|
| Votes | % | + / - | ||||
| June Movement | 5,032 | 18.57 | New | |||
| Conservatives | 4,576 | 16.88 | +4.70 | |||
| Social Democrats | 3,986 | 14.71 | -6.70 | |||
| People's Movement against the EU | 3,384 | 12.49 | -13.64 | |||
| Green Left | 3,273 | 12.08 | +0.19 | |||
| Social Liberals | 2,787 | 10.28 | +7.67 | |||
| Venstre | 2,695 | 9.94 | +3.02 | |||
| Progress Party | 704 | 2.60 | -1.18 | |||
| Centre Democrats | 473 | 1.75 | -11.88 | |||
| Christian Democrats | 191 | 0.70 | -0.76 | |||
| Total | 27,101 | |||||
| Source[41] | ||||||
1989 European Parliament election in Denmark
| Parties | Vote | |||||
|---|---|---|---|---|---|---|
| Votes | % | + / - | ||||
| People's Movement against the EU | 6,522 | 26.13 | -3.49 | |||
| Social Democrats | 5,344 | 21.41 | +3.68 | |||
| Centre Democrats | 3,402 | 13.63 | +2.69 | |||
| Conservatives | 3,040 | 12.18 | -5.11 | |||
| Green Left | 2,969 | 11.89 | -0.84 | |||
| Venstre | 1,728 | 6.92 | +4.37 | |||
| Progress Party | 943 | 3.78 | +0.86 | |||
| Social Liberals | 651 | 2.61 | -0.37 | |||
| Christian Democrats | 365 | 1.46 | -0.13 | |||
| Total | 24,964 | |||||
| Source[42] | ||||||
1984 European Parliament election in Denmark
| Parties | Vote | |||||
|---|---|---|---|---|---|---|
| Votes | % | |||||
| People's Movement against the EU | 8,132 | 29.62 | ||||
| Social Democrats | 4,867 | 17.73 | ||||
| Conservatives | 4,747 | 17.29 | ||||
| Green Left | 3,494 | 12.73 | ||||
| Centre Democrats | 3,004 | 10.94 | ||||
| Social Liberals | 817 | 2.98 | ||||
| Progress Party | 802 | 2.92 | ||||
| Venstre | 699 | 2.55 | ||||
| Left Socialists | 459 | 1.67 | ||||
| Christian Democrats | 436 | 1.59 | ||||
| Total | 27,457 | |||||
| Source[43] | ||||||
Referendums
2022 Danish European Union opt-out referendum[44]
| Option | Votes | % |
|---|---|---|
| ✓ YES | 20,642 | 69.07 |
| X NO | 9,244 | 30.93 |
2015 Danish European Union opt-out referendum[45]
| Option | Votes | % |
|---|---|---|
| X NO | 16,589 | 51.05 |
| ✓ YES | 15,905 | 48.95 |
2014 Danish Unified Patent Court membership referendum[46]
| Option | Votes | % |
|---|---|---|
| ✓ YES | 16,400 | 61.34 |
| X NO | 10,338 | 38.66 |
2009 Danish Act of Succession referendum[47]
| Option | Votes | % |
|---|---|---|
| ✓ YES | 20,916 | 84.26 |
| X NO | 3,907 | 15.74 |
2000 Danish euro referendum[48]
| Option | Votes | % |
|---|---|---|
| X NO | 22,229 | 55.60 |
| ✓ YES | 17,751 | 44.40 |
1998 Danish Amsterdam Treaty referendum[49]
| Option | Votes | % |
|---|---|---|
| ✓ YES | 18,445 | 51.53 |
| X NO | 17,349 | 48.47 |
1993 Danish Maastricht Treaty referendum[50]
| Option | Votes | % |
|---|---|---|
| ✓ YES | 21,417 | 52.16 |
| X NO | 19,641 | 47.84 |
1992 Danish Maastricht Treaty referendum[51]
| Option | Votes | % |
|---|---|---|
| X NO | 22,006 | 55.04 |
| ✓ YES | 17,975 | 44.96 |
1986 Danish Single European Act referendum[52]
| Option | Votes | % |
|---|---|---|
| X NO | 20,297 | 54.24 |
| ✓ YES | 17,123 | 45.76 |
1972 Danish European Communities membership referendum[53]
| Option | Votes | % |
|---|---|---|
| ✓ YES | 24,736 | 54.10 |
| X NO | 20,986 | 45.90 |
1953 Danish constitutional and electoral age referendum[54]
| Option | Votes | % |
|---|---|---|
| ✓ YES | 23,270 | 74.05 |
| X NO | 8,156 | 25.95 |
| 21 years | 16,758 | 50.79 |
| 23 years | 16,235 | 49.21 |
References
- "Gladsaxekredsen". kmdvalg.dk (in Danish). Retrieved 2023-06-08.
- "Forslag til Lov om Valg til Rigsdagen". Rigsdagstidende. 1947–48: Tillæg C, spalte 1777 ff.
- "Nye valgkredse fordeler stemmerne anderledes". dr.dk (in Danish). Retrieved 2023-06-08.
- "Beretning om nye valgkredse som følge af kommunalreformen" (in Danish). Retrieved 2023-06-08.
- "Det danske valgsystem: Valg til Folketinget". valg.im (in Danish). Retrieved 2023-06-08.
- "15 Gladsaxe". dataforsyningen.dk (in Danish). Retrieved 2023-06-08.
- "Forslag til Lov om Valg til Rigsdagen". Rigsdagstidende. 1947–48: Tillæg C, spalte 1777 ff.
- "Valgresultater fra tidligere valg:". kmdvalg (in Danish). Retrieved 2023-06-08.
- "FOLKETINGSVALG TIRSDAG 1. NOVEMBER 2022". valg.im (in Danish). Retrieved 2023-06-27.
- "FOLKETINGSVALG ONSDAG 5. JUNI 2019". valg.im (in Danish). Retrieved 2023-06-27.
- "FOLKETINGSVALG TORSDAG 18. JUNI 2015". valg.im (in Danish). Retrieved 2023-06-27.
- "FOLKETINGSVALG TORSDAG 15. SEPTEMBER 2011". valg.im (in Danish). Retrieved 2023-06-27.
- "Folketingsvalget den 13. november 2007". valg.im (in Danish). Retrieved 2023-06-27.
- "valg2005.book" (PDF). valg.im (in Danish). Retrieved 2023-06-27.
- "BMTABEL" (PDF). valg.im (in Danish). Retrieved 2023-06-27.
- "VALG98" (PDF). valg.im (in Danish). Retrieved 2023-06-27.
- "VALG94" (PDF). valg.im (in Danish). Retrieved 2023-06-27.
- "VALG90" (PDF). valg.im (in Danish). Retrieved 2023-06-27.
- "Folketingsvalget den 10. maj 1988". valg.im (in Danish). Retrieved 2023-06-27.
- "Folketingsvalget den 8.september 1987". dst.dk (in Danish). Retrieved 2023-06-27.
- "Folketingsvalget den 10. januar 1984". dst.dk (in Danish). Retrieved 2023-06-27.
- "Folketingsvalget den 8. december 1981". dst.dk (in Danish). Retrieved 2023-06-27.
- "Folketingsvalget den 23. oktober 1979". dst.dk (in Danish). Retrieved 2023-06-27.
- "Folketingsvalget den 15. februar 1977". dst.dk (in Danish). Retrieved 2023-06-27.
- "Folketingsvalget den 9. januar 1975". dst.dk (in Danish). Retrieved 2023-06-27.
- "Folketingsvalget den 4. december 1973". dst.dk (in Danish). Retrieved 2023-06-27.
- "Folketingsvalget den 21. september 1971 samt folkeafstemningen". dst.dk (in Danish). Retrieved 2023-06-27.
- "Folketingsvalget den 23. januar 1968". dst.dk (in Danish). Retrieved 2023-06-27.
- "Folketingsvalget den 22. november 1966". dst.dk (in Danish). Retrieved 2023-06-27.
- "Folketingsvalget den 22. september 1964". dst.dk (in Danish). Retrieved 2023-06-27.
- "Folketingsvalget den 15. november 1960". dst.dk (in Danish). Retrieved 2023-06-27.
- "Folketingsvalget den 14. maj 1957". dst.dk (in Danish). Retrieved 2023-06-27.
- "Folketingsvalget den 22. september 1953". dst.dk (in Danish). Retrieved 2023-06-27.
- "Rigsdagsvalgene og folkeafstemningerne i april og maj 1953". dst.dk (in Danish). Retrieved 2023-06-27.
- "Folketingsvalget den 5. september 1950". dst.dk (in Danish). Retrieved 2023-06-27.
- "EUROPA-PARLAMENTSVALG SØNDAG 26. MAJ 2019". dst.dk (in Danish). Retrieved 2023-07-01.
- "EUROPA-PARLAMENTSVALG SØNDAG 25. MAJ 2014". dst.dk (in Danish). Retrieved 2023-07-01.
- "EUROPA-PARLAMENTSVALG SØNDAG 7. JUNI 2009". dst.dk (in Danish). Retrieved 2023-07-01.
- "EUROPA-PARLAMENTSVALGET DEN 13. JUNI 2004" (PDF). im.dk (in Danish). Retrieved 2023-07-01.
- "VALGET TIL EUROPA-PARLAMENTET DEN 10. JUNI 1999" (PDF). im.dk (in Danish). Retrieved 2023-07-01.
- "VALGET TIL EUROPA-PARLAMENTET DEN 9. JUNI 1994" (PDF). im.dk (in Danish). Retrieved 2023-07-01.
- "Valget til Europa-parlamentet den 15. juni 1989". dst.dk (in Danish). Retrieved 2023-07-01.
- "Valget til Europa-Parlamentet den 14. juni 1984". dst.dk (in Danish). Retrieved 2023-07-01.
- "FOLKEAFSTEMNING ONSDAG 1. JUNI 2022". dst.dk (in Danish). Retrieved 2023-07-05.
- "FOLKEAFSTEMNING TORSDAG 3. DECEMBER 2015". dst.dk (in Danish). Retrieved 2023-07-05.
- "FOLKEAFSTEMNING SØNDAG 25. MAJ 2014". dst.dk (in Danish). Retrieved 2023-07-05.
- "FOLKEAFSTEMNING SØNDAG 7. JUNI 2009". dst.dk (in Danish). Retrieved 2023-07-05.
- "FOLKEAFSTEMNINGEN DEN 28. SEPTEMBER 2000 OM DANMARKS DELTAGELSE I DEN FÆLLES VALUTA" (PDF). valg.im (in Danish). Retrieved 2023-07-05.
- "FOLKEAFSTEMNINGEN DEN 28. MAJ 1998OM DANMARKS TILTRÆDELSE AF AMSTERDAMTRAKTATEN" (PDF). valg.im (in Danish). Retrieved 2023-07-05.
- "FOLKEAFSTEMNINGEN DEN 18. MAJ 1993 OM DANMARKS TILTRÆDELSE AF EDINBURGH-AFGØRELSEN OG MAASTRICHT-TRAKTATEN". dst.dk (in Danish). Retrieved 2023-07-05.
- "Folkeafstemningen den 1. juni 1992 om Danmarks tiltrædelse af traktaten om Den Europæiske Union". dst.dk (in Danish). Retrieved 2023-07-05.
- "Vejledende folkeafstemning torsdag den 27. februar 1986 om Danmarks tiltrædelse af EF- pakken". dst.dk (in Danish). Retrieved 2023-07-05.
- "Folkeafstemningen om Danmarks tiltrædelse af De europæiske Fælleskaber 2. oktober 1972". dst.dk (in Danish). Retrieved 2023-07-05.
- "Publikationsfortegnelse vedrørende Folkeafstemninger". dst.dk (in Danish). Retrieved 2023-07-05.