Hasse diagram
In order theory, a Hasse diagram (/ˈhæsə/; German: [ˈhasə]) is a type of mathematical diagram used to represent a finite partially ordered set, in the form of a drawing of its transitive reduction. Concretely, for a partially ordered set one represents each element of as a vertex in the plane and draws a line segment or curve that goes upward from one vertex to another vertex whenever covers (that is, whenever , and there is no distinct from and with ). These curves may cross each other but must not touch any vertices other than their endpoints. Such a diagram, with labeled vertices, uniquely determines its partial order.
Hasse diagrams are named after Helmut Hasse (1898–1979); according to Garrett Birkhoff, they are so called because of the effective use Hasse made of them.[1] However, Hasse was not the first to use these diagrams. One example that predates Hasse can be found in Henri Gustave Vogt (1895).[2] Although Hasse diagrams were originally devised as a technique for making drawings of partially ordered sets by hand, they have more recently been created automatically using graph drawing techniques.[3]
The phrase "Hasse diagram" may also refer to the transitive reduction as an abstract directed acyclic graph, independently of any drawing of that graph, but this usage is eschewed here.[4]
Diagram design
Although Hasse diagrams are simple, as well as intuitive, tools for dealing with finite posets, it turns out to be rather difficult to draw "good" diagrams. The reason is that, in general, there are many different possible ways to draw a Hasse diagram for a given poset. The simple technique of just starting with the minimal elements of an order and then drawing greater elements incrementally often produces quite poor results: symmetries and internal structure of the order are easily lost.
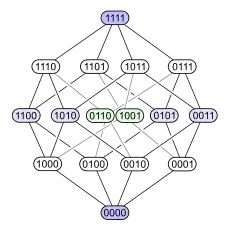
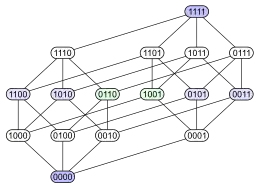
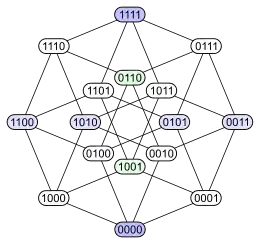
The following example demonstrates the issue. Consider the power set of a 4-element set ordered by inclusion . Below are four different Hasse diagrams for this partial order. Each subset has a node labelled with a binary encoding that shows whether a certain element is in the subset (1) or not (0):
 |  | |
 |
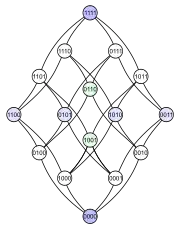 |
The first diagram makes clear that the power set is a graded poset. The second diagram has the same graded structure, but by making some edges longer than others, it emphasizes that the 4-dimensional cube is a combinatorial union of two 3-dimensional cubes, and that a tetrahedron (abstract 3-polytope) likewise merges two triangles (abstract 2-polytopes). The third diagram shows some of the internal symmetry of the structure. In the fourth diagram the vertices are arranged in a 4×4 grid.
Upward planarity
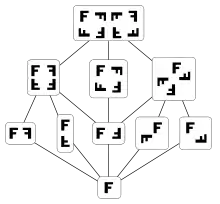
If a partial order can be drawn as a Hasse diagram in which no two edges cross, its covering graph is said to be upward planar. A number of results on upward planarity and on crossing-free Hasse diagram construction are known:
- If the partial order to be drawn is a lattice, then it can be drawn without crossings if and only if it has order dimension at most two.[5] In this case, a non-crossing drawing may be found by deriving Cartesian coordinates for the elements from their positions in the two linear orders realizing the order dimension, and then rotating the drawing counterclockwise by a 45-degree angle.
- If the partial order has at most one minimal element, or it has at most one maximal element, then it may be tested in linear time whether it has a non-crossing Hasse diagram.[6]
- It is NP-complete to determine whether a partial order with multiple sources and sinks can be drawn as a crossing-free Hasse diagram.[7] However, finding a crossing-free Hasse diagram is fixed-parameter tractable when parametrized by the number of articulation points and triconnected components of the transitive reduction of the partial order.[8]
- If the y-coordinates of the elements of a partial order are specified, then a crossing-free Hasse diagram respecting those coordinate assignments can be found in linear time, if such a diagram exists.[9] In particular, if the input poset is a graded poset, it is possible to determine in linear time whether there is a crossing-free Hasse diagram in which the height of each vertex is proportional to its rank.
UML notation
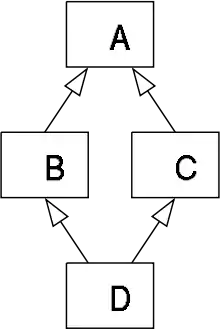
In software engineering, the classes of a software system and the inheritance relation between these classes is often depicted using a class diagram, a form of Hasse diagram in which the edges connecting classes are drawn as solid line segments with an open triangle at the superclass end.
Notes
- Birkhoff (1948).
- Rival (1985), p. 110.
- E.g., see Di Battista & Tamassia (1988) and Freese (2004).
- For examples of this alternative meaning of Hasse diagrams, see Christofides (1975, pp. 170–174); Thulasiraman & Swamy (1992); Bang-Jensen (2008)
- Garg & Tamassia (1995a), Theorem 9, p. 118; Baker, Fishburn & Roberts (1971), theorem 4.1, page 18.
- Garg & Tamassia (1995a), Theorem 15, p. 125; Bertolazzi et al. (1993).
- Garg & Tamassia (1995a), Corollary 1, p. 132; Garg & Tamassia (1995b).
- Chan (2004).
- Jünger & Leipert (1999).
References
- Baker, Kirby A.; Fishburn, Peter C.; Roberts, Fred S. (1971), "Partial orders of dimension 2", Networks, 2 (1): 11–28, doi:10.1002/net.3230020103
- Bang-Jensen, Jørgen (2008), "2.1 Acyclic Digraphs", Digraphs: Theory, Algorithms and Applications, Springer Monographs in Mathematics (2nd ed.), Springer-Verlag, pp. 32–34, ISBN 978-1-84800-997-4
- Bertolazzi, R; Di Battista, G.; Mannino, C.; Tamassia, R. (1993), "Optimal upward planarity testing of single-source digraphs" (PDF), Proc. 1st European Symposium on Algorithms (ESA '93), Lecture Notes in Computer Science, vol. 726, Springer-Verlag, pp. 37–48, doi:10.1007/3-540-57273-2_42, ISBN 978-3-540-57273-2
- Birkhoff, Garrett (1948), Lattice Theory (Revised ed.), American Mathematical Society
- Chan, Hubert (2004), "A parameterized algorithm for upward planarity testing", Proc. 12th European Symposium on Algorithms (ESA '04), Lecture Notes in Computer Science, vol. 3221, Springer-Verlag, pp. 157–168, doi:10.1007/978-3-540-30140-0_16
- Christofides, Nicos (1975), Graph theory: an algorithmic approach, Academic Press, pp. 170–174
- Di Battista, G.; Tamassia, R. (1988), "Algorithms for plane representation of acyclic digraphs", Theoretical Computer Science, 61 (2–3): 175–178, doi:10.1016/0304-3975(88)90123-5
- Freese, Ralph (2004), "Automated lattice drawing", Concept Lattices (PDF), Lecture Notes in Computer Science, vol. 2961, Springer-Verlag, pp. 589–590
- Garg, Ashim; Tamassia, Roberto (1995a), "Upward planarity testing", Order, 12 (2): 109–133, doi:10.1007/BF01108622, S2CID 14183717
- Garg, Ashim; Tamassia, Roberto (1995b), "On the computational complexity of upward and rectilinear planarity testing", Graph Drawing (Proc. GD '94), LectureNotes in Computer Science, vol. 894, Springer-Verlag, pp. 286–297, doi:10.1007/3-540-58950-3_384, ISBN 978-3-540-58950-1
- Jünger, Michael; Leipert, Sebastian (1999), "Level planar embedding in linear time", Graph Drawing (Proc. GD '99), Lecture Notes in Computer Science, vol. 1731, pp. 72–81, doi:10.1007/3-540-46648-7_7, ISBN 978-3-540-66904-3
- Rival, Ivan (1985), "The diagram", in Rival, Ivan (ed.), Graphs and Order: The Role of Graphs in the Theory of Ordered Sets and Its Applications, Proceedings of the NATO Advanced Study Institute held in Banff, May 18–31, 1984, NATO Advanced Science Institutes Series C: Mathematical and Physical Sciences, vol. 147, Reidel, Dordrecht, pp. 103–133, MR 0818494
- Thulasiraman, K.; Swamy, M. N. S. (1992), "5.7 Acyclic Directed Graphs", Graphs: Theory and Algorithms, John Wiley and Son, p. 118, ISBN 978-0-471-51356-8
- Vogt, Henri Gustave (1895), Leçons sur la résolution algébrique des équations, Nony, p. 91
External links
 Related media at Wikimedia Commons:
- Hasse diagram (Gallery)
- Hasse diagrams (Category)
- Weisstein, Eric W., "Hasse Diagram", MathWorld
