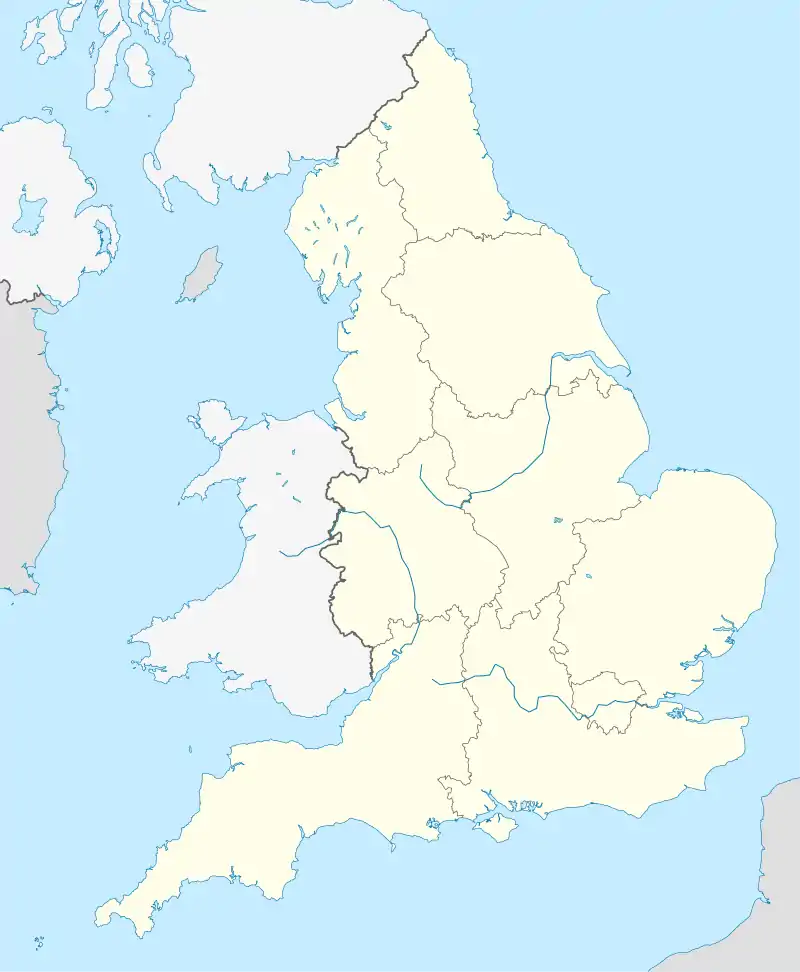
Health in England
Health in England refers to the overall health of the population of England. Despite overall increases in life expectancy in England, the most deprived areas continue to see no change or a decrease in life expectancy.[1] The Blair Government instituted a comprehensive programme to reduce health inequalities in England between 1997 and 2010 focused on reducing geographical inequalities in life expectancy. It was targeted at the Spearhead areas - the 20% of local authorities with the worst health and deprivation indicators. This led to more NHS resources being directed to the most deprived areas. The strategy was associated with a decline in geographical inequalities in life expectancy, reversing a trend which had increased over a long period.[2] However, health inequalities still remain. In 2014 to 2016, the difference in life expectancy between the most and least deprived areas of England was 9.3 years for males and 7.3 years for females.[3]
Life expectancy
A North-South divide in life expectancy continues to be apparent. In 2016 to 2018, this geographical divide can be seen across regions of England. The life expectancy at birth of males and females in the regions of London, the South East, South West and East of England were all significantly higher than the national average. Whereas, life expectancy was lowest in the North East, North West and Yorkshire and the Humber.

On average, there have been reductions in the number of years lived in poorer states of health for both men and women at age 65 in England. As of 2018, Richmond-upon-Thames had the highest male healthy life expectancy at birth in the UK of 71.9 years, 18.6 years longer than males in Blackpool where it was only 53.3 years. For females, the lowest healthy life expectancy at birth was found in Nottingham at 54.2 years, and the highest was in Wokingham at 72.2 years, a gap of 18 years.[4]
| Male | Female | |
|---|---|---|
| England | 79.6 | 83.2 |
| North East | 77.9 | 81.7 |
| North West | 78.3 | 81.9 |
| Yorkshire and the Humber | 78.7 | 82.4 |
| East Midlands | 79.4 | 82.9 |
| West Midlands | 78.9 | 82.7 |
| East | 80.3 | 83.7 |
| London | 80.7 | 84.5 |
| South East | 80.7 | 84.1 |
| South West | 80.2 | 83.8 |
The ten leading causes of death for men in England are heart disease, dementia and Alzheimer's disease, lung cancer, chronic lower respiratory diseases, stroke, influenza and pneumonia, prostate cancer, colorectal cancer, leukemia and diseases of the liver, respectively. In females, the leading cause of death is dementia and Alzheimer's disease followed by heart disease, stroke, chronic lower respiratory diseases, influenza and pneumonia, lung cancer, breast cancer, colorectal cancer, leukemia and kidney disease. Higher mortality rates for heart disease, lung cancer, and chronic lower respiratory diseases in the most deprived areas contribute the most to the life expectancy gap. Smoking and obesity are the main risk factors for these diseases.[6]
People in the most deprived areas are more than twice as likely to die prematurely from cancer, and there has been no significant change in this level of inequality since 2010 to 2012. Similarly, people in the most deprived areas are almost four times as likely to die prematurely from cardiovascular disease compared with those in the least deprived areas, and this inequality has also significantly widened since 2010 to 2012.[7]
Risk factors
The prevalence of many risk factors, including smoking, drug use, high blood pressure and high cholesterol have declined. The prevalence of smoking has declined from 19.9% to 14.9% in the last 7 years and if this trend continues, it will reduce to between 8.5% and 11.7% by 2023. However, there has been an increase in the prevalence of obesity. In England, in 2016, 26.2% of adults were obese and it is forecast that levels of obesity will increase by 2023.
A study by Public Health England in 2017 found that 41% of the 15.3 million English adults aged 40 to 60 do not walk for as much as 10 minutes continuously each month at a brisk pace. A quarter of the English population was found to be “inactive” – doing less than 30 minutes of activity per week.[8]
The heaviest-drinking 20% of the population drink almost two thirds of all alcohol consumed.[9]
See also
- National Health Service (England)
- Healthcare in England
- Health in the United Kingdom
- Health in Wales
- Health in Scotland
- Health in Northern Ireland
- Category:Drugs in England
- Category:Mental health in England
References
- "Health state life expectancies by national deprivation deciles, England: 2016 to 2018". Office for National Statistics. 27 March 2020. Retrieved 1 October 2020.
- Barr, Ben; Higgerson, James; Whitehead, Margaret (5 July 2017). "Investigating the impact of the English health inequalities strategy: time trend analysis". British Medical Journal. 358: j3310. doi:10.1136/bmj.j3310. PMC 5527348. PMID 28747304. Retrieved 24 August 2017.
- "Health Profile for England:2018". Public Health England. 11 September 2018. Retrieved 1 October 2020.
- "Health state life expectancies, UK: 2016 to 2018". Office for National Statistics. 11 December 2019. Retrieved 1 October 2020.
- "Health state life expectancies, UK: 2016 to 2018". Office for National Statistics. 11 December 2019. Retrieved 1 October 2020.
- "Health Profile for England:2018". Public Health England. 11 September 2018. Retrieved 1 October 2020.
- "Health Profile for England:2018". Public Health England. 11 September 2018. Retrieved 1 October 2020.
- "Six million adults fail to walk briskly for 10 minutes each month". Belfast Telegraph. 24 August 2017. Retrieved 24 August 2017.
- "Health at a Glance 2015 How does the United Kingdom compare?" (PDF). OECD. 2015. Retrieved 24 August 2017.