Helsingør (nomination district)
Helsingør nominating district is one of the 92 nominating districts that exists for Danish elections following the 2007 municipal reform.[3][4][5] It consists of Helsingør Municipality.[6] It was created in 1849[7] as a constituency, and has been a nomination district since 1920. It is the only current nomination district whose boundaries have been unchanged since 1849.
| Helsingør | |
|---|---|
| Helsingør | |
| Nomination district constituency for the Folketing | |
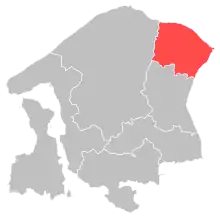 Location of Helsingør within North Zealand | |
 Location of North Zealand within Denmark | |
| Municipalities | Helsingør |
| Constituency | North Zealand |
| Electorate | 46,889 (2022)[1] |
| Current constituency | |
| Created | 1849 (as constituency)[2] 1920 (as nomination district) |
In general elections, the district tends to vote close to the national result when looking at the voter split between the two blocs.[8]
General elections results
General elections in the 2020s
| Parties | Vote | |||||
|---|---|---|---|---|---|---|
| Votes | % | + / - | ||||
| Social Democrats | 10,702 | 27.76 | +3.01 | |||
| Moderates | 4,200 | 10.89 | New | |||
| Venstre | 4,131 | 10.71 | -6.19 | |||
| Liberal Alliance | 3,254 | 8.44 | +5.51 | |||
| Green Left | 2,976 | 7.72 | +0.53 | |||
| Conservatives | 2,905 | 7.53 | -3.49 | |||
| Red–Green Alliance | 2,036 | 5.28 | -2.21 | |||
| Denmark Democrats | 1,816 | 4.71 | New | |||
| Social Liberals | 1,801 | 4.67 | -6.30 | |||
| The Alternative | 1,663 | 4.31 | +1.11 | |||
| New Right | 1,543 | 4.00 | +0.22 | |||
| Danish People's Party | 964 | 2.50 | -5.63 | |||
| Independent Greens | 422 | 1.09 | New | |||
| Christian Democrats | 96 | 0.25 | -0.52 | |||
| Jayseth Lotus Arrose Simoysano | 37 | 0.10 | New | |||
| Katjalivah Elleyhansen | 8 | 0.02 | New | |||
| Total | 38,554 | |||||
| Source[9] | ||||||
General elections in the 2010s
| Parties | Vote | |||||
|---|---|---|---|---|---|---|
| Votes | % | + / - | ||||
| Social Democrats | 9,520 | 24.75 | -0.57 | |||
| Venstre | 6,500 | 16.90 | +2.39 | |||
| Conservatives | 4,237 | 11.02 | +4.78 | |||
| Social Liberals | 4,219 | 10.97 | +5.65 | |||
| Danish People's Party | 3,127 | 8.13 | -12.82 | |||
| Red–Green Alliance | 2,881 | 7.49 | -0.67 | |||
| Green Left | 2,766 | 7.19 | +3.18 | |||
| New Right | 1,453 | 3.78 | New | |||
| The Alternative | 1,229 | 3.20 | -2.24 | |||
| Liberal Alliance | 1,126 | 2.93 | -6.71 | |||
| Stram Kurs | 672 | 1.75 | New | |||
| Klaus Riskær Pedersen Party | 405 | 1.05 | New | |||
| Christian Democrats | 297 | 0.77 | +0.39 | |||
| Gert Lassen | 26 | 0.07 | +0.06 | |||
| Hans Frederik Brobjerg | 5 | 0.01 | New | |||
| Total | 38,463 | |||||
| Source[10] | ||||||
| Parties | Vote | |||||
|---|---|---|---|---|---|---|
| Votes | % | + / - | ||||
| Social Democrats | 9,688 | 25.32 | +1.67 | |||
| Danish People's Party | 8,019 | 20.95 | +9.20 | |||
| Venstre | 5,552 | 14.51 | -11.38 | |||
| Liberal Alliance | 3,690 | 9.64 | +3.54 | |||
| Red–Green Alliance | 3,124 | 8.16 | +1.74 | |||
| Conservatives | 2,388 | 6.24 | -0.10 | |||
| The Alternative | 2,081 | 5.44 | New | |||
| Social Liberals | 2,036 | 5.32 | -5.70 | |||
| Green Left | 1,536 | 4.01 | -4.55 | |||
| Christian Democrats | 144 | 0.38 | +0.13 | |||
| Aleks Jensen | 9 | 0.02 | New | |||
| Gert Lassen | 2 | 0.01 | New | |||
| Total | 38,269 | |||||
| Source[11] | ||||||
| Parties | Vote | |||||
|---|---|---|---|---|---|---|
| Votes | % | + / - | ||||
| Venstre | 9,953 | 25.89 | +3.31 | |||
| Social Democrats | 9,092 | 23.65 | -1.61 | |||
| Danish People's Party | 4,519 | 11.75 | -1.95 | |||
| Social Liberals | 4,237 | 11.02 | +4.15 | |||
| Green Left | 3,289 | 8.56 | -4.29 | |||
| Red–Green Alliance | 2,469 | 6.42 | +3.90 | |||
| Conservatives | 2,436 | 6.34 | -5.40 | |||
| Liberal Alliance | 2,344 | 6.10 | +2.03 | |||
| Christian Democrats | 95 | 0.25 | -0.16 | |||
| Bjarne Holm | 11 | 0.03 | New | |||
| Total | 38,445 | |||||
| Source[12] | ||||||
General elections in the 2000s
| Parties | Vote | |||||
|---|---|---|---|---|---|---|
| Votes | % | + / - | ||||
| Social Democrats | 9,523 | 25.26 | +0.58 | |||
| Venstre | 8,511 | 22.58 | -2.77 | |||
| Danish People's Party | 5,163 | 13.70 | -0.33 | |||
| Green Left | 4,844 | 12.85 | +7.15 | |||
| Conservatives | 4,425 | 11.74 | +0.15 | |||
| Social Liberals | 2,590 | 6.87 | -5.36 | |||
| New Alliance | 1,535 | 4.07 | New | |||
| Red–Green Alliance | 949 | 2.52 | -1.11 | |||
| Christian Democrats | 156 | 0.41 | -0.52 | |||
| Total | 37,696 | |||||
| Source[13] | ||||||
| Parties | Vote | |||||
|---|---|---|---|---|---|---|
| Votes | % | + / - | ||||
| Venstre | 9,296 | 25.35 | -1.59 | |||
| Social Democrats | 9,051 | 24.68 | -4.83 | |||
| Danish People's Party | 5,145 | 14.03 | +1.93 | |||
| Social Liberals | 4,486 | 12.23 | +5.92 | |||
| Conservatives | 4,360 | 11.89 | +0.23 | |||
| Green Left | 2,091 | 5.70 | -1.38 | |||
| Red–Green Alliance | 1,332 | 3.63 | +1.20 | |||
| Centre Democrats | 477 | 1.30 | -0.83 | |||
| Christian Democrats | 342 | 0.93 | -0.49 | |||
| Minority Party | 87 | 0.24 | New | |||
| Total | 36,667 | |||||
| Source[14] | ||||||
| Parties | Vote | |||||
|---|---|---|---|---|---|---|
| Votes | % | + / - | ||||
| Social Democrats | 11,139 | 29.51 | -6.97 | |||
| Venstre | 10,169 | 26.94 | +10.27 | |||
| Danish People's Party | 4,569 | 12.10 | +4.03 | |||
| Conservatives | 4,403 | 11.66 | -5.48 | |||
| Green Left | 2,673 | 7.08 | -1.21 | |||
| Social Liberals | 2,382 | 6.31 | +2.91 | |||
| Red–Green Alliance | 917 | 2.43 | -0.33 | |||
| Centre Democrats | 804 | 2.13 | -2.16 | |||
| Christian People's Party | 535 | 1.42 | +0.14 | |||
| Progress Party | 160 | 0.42 | -0.98 | |||
| Total | 37,751 | |||||
| Source[15] | ||||||
General elections in the 1990s
| Parties | Vote | |||||
|---|---|---|---|---|---|---|
| Votes | % | + / - | ||||
| Social Democrats | 13,352 | 36.48 | +1.81 | |||
| Conservatives | 6,275 | 17.14 | -6.54 | |||
| Venstre | 6,100 | 16.67 | +1.52 | |||
| Green Left | 3,035 | 8.29 | -0.44 | |||
| Danish People's Party | 2,954 | 8.07 | New | |||
| Centre Democrats | 1,570 | 4.29 | +1.32 | |||
| Social Liberals | 1,245 | 3.40 | -1.00 | |||
| Red–Green Alliance | 1,011 | 2.76 | -1.07 | |||
| Progress Party | 511 | 1.40 | -3.99 | |||
| Christian People's Party | 468 | 1.28 | +0.19 | |||
| Democratic Renewal | 72 | 0.20 | New | |||
| Sabina Schilliing Nybo Rasmussen | 10 | 0.03 | New | |||
| Total | 36,603 | |||||
| Source[16] | ||||||
| Parties | Vote | |||||
|---|---|---|---|---|---|---|
| Votes | % | + / - | ||||
| Social Democrats | 12,262 | 34.67 | -4.24 | |||
| Conservatives | 8,375 | 23.68 | +0.58 | |||
| Venstre | 5,358 | 15.15 | +5.83 | |||
| Green Left | 3,087 | 8.73 | -0.46 | |||
| Progress Party | 1,907 | 5.39 | +1.10 | |||
| Social Liberals | 1,556 | 4.40 | +1.34 | |||
| Red–Green Alliance | 1,356 | 3.83 | +1.74 | |||
| Centre Democrats | 1,050 | 2.97 | -2.44 | |||
| Christian People's Party | 385 | 1.09 | -0.05 | |||
| Jørgen Ruberg | 32 | 0.09 | New | |||
| Total | 35,368 | |||||
| Source[17] | ||||||
| Parties | Vote | |||||
|---|---|---|---|---|---|---|
| Votes | % | + / - | ||||
| Social Democrats | 13,323 | 38.91 | +6.29 | |||
| Conservatives | 7,910 | 23.10 | -0.48 | |||
| Venstre | 3,192 | 9.32 | +3.17 | |||
| Green Left | 3,148 | 9.19 | -5.54 | |||
| Centre Democrats | 1,852 | 5.41 | +0.40 | |||
| Progress Party | 1,468 | 4.29 | -2.31 | |||
| Social Liberals | 1,048 | 3.06 | -2.77 | |||
| Red–Green Alliance | 715 | 2.09 | New | |||
| Common Course | 642 | 1.87 | -0.95 | |||
| Christian People's Party | 392 | 1.14 | +0.13 | |||
| The Greens | 354 | 1.03 | +0.77 | |||
| Justice Party of Denmark | 184 | 0.54 | New | |||
| Humanist Party | 14 | 0.04 | New | |||
| Total | 34,242 | |||||
| Source[18] | ||||||
General elections in the 1980s
| Parties | Vote | |||||
|---|---|---|---|---|---|---|
| Votes | % | + / - | ||||
| Social Democrats | 11,482 | 32.62 | +2.37 | |||
| Conservatives | 8,299 | 23.58 | -1.18 | |||
| Green Left | 5,183 | 14.73 | -2.18 | |||
| Progress Party | 2,323 | 6.60 | +3.54 | |||
| Venstre | 2,166 | 6.15 | +1.91 | |||
| Social Liberals | 2,053 | 5.83 | -0.87 | |||
| Centre Democrats | 1,762 | 5.01 | -0.03 | |||
| Common Course | 992 | 2.82 | -0.03 | |||
| Christian People's Party | 356 | 1.01 | -0.23 | |||
| Communist Party of Denmark | 326 | 0.93 | -0.10 | |||
| Left Socialists | 155 | 0.44 | -0.75 | |||
| The Greens | 90 | 0.26 | -1.66 | |||
| Lars Kristensen | 11 | 0.03 | +0.02 | |||
| Total | 35,198 | |||||
| Source[19] | ||||||
| Parties | Vote | |||||
|---|---|---|---|---|---|---|
| Votes | % | + / - | ||||
| Social Democrats | 11,041 | 30.25 | -4.67 | |||
| Conservatives | 9,037 | 24.76 | -1.35 | |||
| Green Left | 6,172 | 16.91 | +3.16 | |||
| Social Liberals | 2,446 | 6.70 | +1.08 | |||
| Centre Democrats | 1,840 | 5.04 | +1.65 | |||
| Venstre | 1,549 | 4.24 | -2.88 | |||
| Progress Party | 1,118 | 3.06 | +0.62 | |||
| Common Course | 1,042 | 2.85 | New | |||
| The Greens | 699 | 1.92 | New | |||
| Christian People's Party | 451 | 1.24 | -0.09 | |||
| Left Socialists | 435 | 1.19 | -1.65 | |||
| Communist Party of Denmark | 377 | 1.03 | +0.22 | |||
| Justice Party of Denmark | 153 | 0.42 | -1.11 | |||
| Humanist Party | 86 | 0.24 | New | |||
| Marxist–Leninists Party | 28 | 0.08 | -0.01 | |||
| Socialist Workers Party | 20 | 0.05 | 0.00 | |||
| Lars Kristensen | 5 | 0.01 | +0.01 | |||
| Total | 36,499 | |||||
| Source[20] | ||||||
| Parties | Vote | |||||
|---|---|---|---|---|---|---|
| Votes | % | + / - | ||||
| Social Democrats | 12,612 | 34.92 | -1.85 | |||
| Conservatives | 9,430 | 26.11 | +8.25 | |||
| Green Left | 4,968 | 13.75 | +0.18 | |||
| Venstre | 2,570 | 7.12 | +1.35 | |||
| Social Liberals | 2,031 | 5.62 | +0.69 | |||
| Centre Democrats | 1,223 | 3.39 | -4.01 | |||
| Left Socialists | 1,025 | 2.84 | +0.10 | |||
| Progress Party | 881 | 2.44 | -4.84 | |||
| Justice Party of Denmark | 552 | 1.53 | +0.13 | |||
| Christian People's Party | 479 | 1.33 | +0.53 | |||
| Communist Party of Denmark | 291 | 0.81 | -0.46 | |||
| Marxist–Leninists Party | 31 | 0.09 | New | |||
| Socialist Workers Party | 19 | 0.05 | -0.01 | |||
| Lars Bjørnbak Hallstein | 3 | 0.01 | New | |||
| Leni Thomsen | 3 | 0.01 | New | |||
| Lars Kristensen | 0 | 0.00 | New | |||
| Total | 36,118 | |||||
| Source[21] | ||||||
| Parties | Vote | |||||
|---|---|---|---|---|---|---|
| Votes | % | + / - | ||||
| Social Democrats | 12,425 | 36.77 | -6.43 | |||
| Conservatives | 6,035 | 17.86 | +3.59 | |||
| Green Left | 4,587 | 13.57 | +6.74 | |||
| Centre Democrats | 2,502 | 7.40 | +4.54 | |||
| Progress Party | 2,460 | 7.28 | -1.40 | |||
| Venstre | 1,949 | 5.77 | -2.17 | |||
| Social Liberals | 1,667 | 4.93 | -0.20 | |||
| Left Socialists | 925 | 2.74 | -1.66 | |||
| Justice Party of Denmark | 472 | 1.40 | -1.37 | |||
| Communist Party of Denmark | 428 | 1.27 | -1.08 | |||
| Christian People's Party | 270 | 0.80 | -0.32 | |||
| Communist Workers Party | 56 | 0.17 | -0.27 | |||
| Socialist Workers Party | 19 | 0.06 | New | |||
| Total | 33,795 | |||||
| Source[22] | ||||||
General elections in the 1970s
| Parties | Vote | |||||
|---|---|---|---|---|---|---|
| Votes | % | + / - | ||||
| Social Democrats | 14,713 | 43.20 | +1.55 | |||
| Conservatives | 4,861 | 14.27 | +5.32 | |||
| Progress Party | 2,957 | 8.68 | -4.06 | |||
| Venstre | 2,705 | 7.94 | +0.18 | |||
| Green Left | 2,326 | 6.83 | +2.55 | |||
| Social Liberals | 1,747 | 5.13 | +1.91 | |||
| Left Socialists | 1,497 | 4.40 | +1.34 | |||
| Centre Democrats | 974 | 2.86 | -3.64 | |||
| Justice Party of Denmark | 942 | 2.77 | -0.87 | |||
| Communist Party of Denmark | 801 | 2.35 | -3.44 | |||
| Christian People's Party | 383 | 1.12 | -0.54 | |||
| Communist Workers Party | 149 | 0.44 | New | |||
| Total | 34,055 | |||||
| Source[23] | ||||||
| Parties | Vote | |||||
|---|---|---|---|---|---|---|
| Votes | % | + / - | ||||
| Social Democrats | 13,949 | 41.65 | -6.36 | |||
| Progress Party | 4,267 | 12.74 | +3.09 | |||
| Conservatives | 2,996 | 8.95 | +4.67 | |||
| Venstre | 2,600 | 7.76 | -7.84 | |||
| Centre Democrats | 2,176 | 6.50 | +5.07 | |||
| Communist Party of Denmark | 1,938 | 5.79 | +0.55 | |||
| Green Left | 1,433 | 4.28 | -0.43 | |||
| Justice Party of Denmark | 1,218 | 3.64 | +2.17 | |||
| Social Liberals | 1,077 | 3.22 | -1.91 | |||
| Left Socialists | 1,025 | 3.06 | +1.18 | |||
| Christian People's Party | 556 | 1.66 | -0.91 | |||
| Pensioners' Party | 245 | 0.73 | New | |||
| Kaj Boriths-Sørensen | 13 | 0.04 | New | |||
| Total | 33,493 | |||||
| Source[24] | ||||||
| Parties | Vote | |||||
|---|---|---|---|---|---|---|
| Votes | % | + / - | ||||
| Social Democrats | 19,785 | 48.01 | +19.17 | |||
| Venstre | 6,429 | 15.60 | +7.18 | |||
| Progress Party | 3,977 | 9.65 | -4.85 | |||
| Communist Party of Denmark | 2,159 | 5.24 | -0.41 | |||
| Social Liberals | 2,116 | 5.13 | -4.71 | |||
| Green Left | 1,939 | 4.71 | -2.45 | |||
| Conservatives | 1,764 | 4.28 | -4.88 | |||
| Christian People's Party | 1,059 | 2.57 | +0.13 | |||
| Left Socialists | 776 | 1.88 | +0.02 | |||
| Justice Party of Denmark | 604 | 1.47 | -1.57 | |||
| Centre Democrats | 589 | 1.43 | -7.67 | |||
| H. Lindholt | 12 | 0.03 | New | |||
| Total | 41,209 | |||||
| Source[25] | ||||||
| Parties | Vote | |||||
|---|---|---|---|---|---|---|
| Votes | % | + / - | ||||
| Social Democrats | 9,293 | 28.84 | -9.56 | |||
| Progress Party | 4,672 | 14.50 | New | |||
| Social Liberals | 3,172 | 9.84 | -4.18 | |||
| Conservatives | 2,952 | 9.16 | -8.35 | |||
| Centre Democrats | 2,932 | 9.10 | New | |||
| Venstre | 2,713 | 8.42 | -1.06 | |||
| Green Left | 2,309 | 7.16 | -5.94 | |||
| Communist Party of Denmark | 1,820 | 5.65 | +3.02 | |||
| Justice Party of Denmark | 981 | 3.04 | +1.10 | |||
| Christian People's Party | 786 | 2.44 | +1.32 | |||
| Left Socialists | 598 | 1.86 | +0.04 | |||
| Total | 32,228 | |||||
| Source[26] | ||||||
| Parties | Vote | |||||
|---|---|---|---|---|---|---|
| Votes | % | + / - | ||||
| Social Democrats | 11,544 | 38.40 | +3.31 | |||
| Conservatives | 5,264 | 17.51 | -2.68 | |||
| Social Liberals | 4,214 | 14.02 | -1.06 | |||
| Green Left | 3,938 | 13.10 | +3.73 | |||
| Venstre | 2,849 | 9.48 | -2.89 | |||
| Communist Party of Denmark | 792 | 2.63 | +0.39 | |||
| Justice Party of Denmark | 583 | 1.94 | +1.44 | |||
| Left Socialists | 546 | 1.82 | -1.44 | |||
| Christian People's Party | 336 | 1.12 | New | |||
| Total | 30,066 | |||||
| Source[27] | ||||||
General elections in the 1960s
| Parties | Vote | |||||
|---|---|---|---|---|---|---|
| Votes | % | + / - | ||||
| Social Democrats | 10,139 | 35.09 | -3.94 | |||
| Conservatives | 5,833 | 20.19 | +2.60 | |||
| Social Liberals | 4,356 | 15.08 | +8.59 | |||
| Venstre | 3,575 | 12.37 | -1.20 | |||
| Green Left | 2,708 | 9.37 | -7.89 | |||
| Left Socialists | 942 | 3.26 | New | |||
| Communist Party of Denmark | 646 | 2.24 | +0.61 | |||
| Liberal Centre | 472 | 1.63 | -1.37 | |||
| Justice Party of Denmark | 145 | 0.50 | -0.01 | |||
| Independent Party | 78 | 0.27 | -0.63 | |||
| Total | 28,894 | |||||
| Source[28] | ||||||
| Parties | Vote | |||||
|---|---|---|---|---|---|---|
| Votes | % | + / - | ||||
| Social Democrats | 10,892 | 39.03 | -7.57 | |||
| Conservatives | 4,910 | 17.59 | +0.42 | |||
| Green Left | 4,817 | 17.26 | +7.87 | |||
| Venstre | 3,788 | 13.57 | -3.13 | |||
| Social Liberals | 1,810 | 6.49 | +2.09 | |||
| Liberal Centre | 836 | 3.00 | New | |||
| Communist Party of Denmark | 455 | 1.63 | -1.11 | |||
| Independent Party | 250 | 0.90 | -0.58 | |||
| Justice Party of Denmark | 141 | 0.51 | -0.55 | |||
| Erik Hoffmeyer | 4 | 0.01 | New | |||
| P. Lüchow | 2 | 0.01 | +0.01 | |||
| Carl Møller | 1 | 0.00 | -0.04 | |||
| Total | 27,906 | |||||
| Source[29] | ||||||
| Parties | Vote | |||||
|---|---|---|---|---|---|---|
| Votes | % | + / - | ||||
| Social Democrats | 11,569 | 46.60 | -3.50 | |||
| Conservatives | 4,263 | 17.17 | +2.14 | |||
| Venstre | 4,146 | 16.70 | +2.64 | |||
| Green Left | 2,331 | 9.39 | -0.48 | |||
| Social Liberals | 1,092 | 4.40 | -0.28 | |||
| Communist Party of Denmark | 681 | 2.74 | +0.45 | |||
| Independent Party | 368 | 1.48 | -0.91 | |||
| Justice Party of Denmark | 262 | 1.06 | -0.53 | |||
| Danish Unity | 101 | 0.41 | New | |||
| Carl Møller | 11 | 0.04 | New | |||
| P. Lüchow | 1 | 0.00 | New | |||
| Total | 24,825 | |||||
| Source[30] | ||||||
| Parties | Vote | |||||
|---|---|---|---|---|---|---|
| Votes | % | + / - | ||||
| Social Democrats | 11,130 | 50.10 | +1.24 | |||
| Conservatives | 3,339 | 15.03 | +0.24 | |||
| Venstre | 3,124 | 14.06 | -2.55 | |||
| Green Left | 2,192 | 9.87 | New | |||
| Social Liberals | 1,039 | 4.68 | -3.57 | |||
| Independent Party | 530 | 2.39 | +1.04 | |||
| Communist Party of Denmark | 509 | 2.29 | -2.89 | |||
| Justice Party of Denmark | 354 | 1.59 | -3.37 | |||
| Total | 22,217 | |||||
| Source[31] | ||||||
General elections in the 1950s
| Parties | Vote | |||||
|---|---|---|---|---|---|---|
| Votes | % | + / - | ||||
| Social Democrats | 9,650 | 48.86 | -2.85 | |||
| Venstre | 3,281 | 16.61 | +3.42 | |||
| Conservatives | 2,921 | 14.79 | -0.04 | |||
| Social Liberals | 1,630 | 8.25 | -0.71 | |||
| Communist Party of Denmark | 1,023 | 5.18 | -2.02 | |||
| Justice Party of Denmark | 979 | 4.96 | +2.25 | |||
| Independent Party | 267 | 1.35 | -0.06 | |||
| Total | 19,751 | |||||
| Source[32] | ||||||
September 1953 Danish Folketing election
| Parties | Vote | |||||
|---|---|---|---|---|---|---|
| Votes | % | + / - | ||||
| Social Democrats | 9,273 | 51.71 | +2.35 | |||
| Conservatives | 2,659 | 14.83 | -0.37 | |||
| Venstre | 2,365 | 13.19 | +1.43 | |||
| Social Liberals | 1,606 | 8.96 | -2.30 | |||
| Communist Party of Denmark | 1,292 | 7.20 | -0.72 | |||
| Justice Party of Denmark | 486 | 2.71 | -0.98 | |||
| Independent Party | 252 | 1.41 | New | |||
| Total | 17,933 | |||||
| Source[33] | ||||||
April 1953 Danish Folketing election
| Parties | Vote | |||||
|---|---|---|---|---|---|---|
| Votes | % | + / - | ||||
| Social Democrats | 8,435 | 49.36 | -0.94 | |||
| Conservatives | 2,597 | 15.20 | -1.25 | |||
| Venstre | 2,010 | 11.76 | +1.73 | |||
| Social Liberals | 1,924 | 11.26 | -0.07 | |||
| Communist Party of Denmark | 1,354 | 7.92 | +0.29 | |||
| Justice Party of Denmark | 631 | 3.69 | -0.57 | |||
| Danish Unity | 139 | 0.81 | New | |||
| Total | 17,090 | |||||
| Source[34] | ||||||
1950 Danish Folketing election
| Parties | Vote | |||||
|---|---|---|---|---|---|---|
| Votes | % | + / - | ||||
| Social Democrats | 8,327 | 50.30 | -1.21 | |||
| Conservatives | 2,723 | 16.45 | +4.09 | |||
| Social Liberals | 1,876 | 11.33 | +4.20 | |||
| Venstre | 1,660 | 10.03 | -4.38 | |||
| Communist Party of Denmark | 1,263 | 7.63 | -3.98 | |||
| Justice Party of Denmark | 705 | 4.26 | +2.43 | |||
| Total | 16,554 | |||||
| Source[35] | ||||||
General elections in the 1940s
1947 Danish Folketing election
| Parties | Vote | |||||
|---|---|---|---|---|---|---|
| Votes | % | + / - | ||||
| Social Democrats | 8,318 | 51.51 | +12.46 | |||
| Venstre | 2,327 | 14.41 | +4.77 | |||
| Conservatives | 1,995 | 12.36 | -4.90 | |||
| Communist Party of Denmark | 1,874 | 11.61 | -8.35 | |||
| Social Liberals | 1,152 | 7.13 | -2.78 | |||
| Justice Party of Denmark | 296 | 1.83 | +1.30 | |||
| Danish Unity | 185 | 1.15 | -2.50 | |||
| Total | 16,147 | |||||
| Source[36] | ||||||
1945 Danish Folketing election
| Parties | Vote | |||||
|---|---|---|---|---|---|---|
| Votes | % | + / - | ||||
| Social Democrats | 6,173 | 39.05 | -17.19 | |||
| Communist Party of Denmark | 3,155 | 19.96 | New | |||
| Conservatives | 2,729 | 17.26 | -4.36 | |||
| Social Liberals | 1,566 | 9.91 | -0.22 | |||
| Venstre | 1,524 | 9.64 | +4.22 | |||
| Danish Unity | 577 | 3.65 | -0.57 | |||
| Justice Party of Denmark | 84 | 0.53 | -0.07 | |||
| Total | 15,808 | |||||
| Source[37] | ||||||
1943 Danish Folketing election
| Parties | Vote | |||||
|---|---|---|---|---|---|---|
| Votes | % | + / - | ||||
| Social Democrats | 8,683 | 56.24 | -0.12 | |||
| Conservatives | 3,337 | 21.62 | +2.06 | |||
| Social Liberals | 1,564 | 10.13 | -1.93 | |||
| Venstre | 836 | 5.42 | +0.26 | |||
| Danish Unity | 651 | 4.22 | +4.04 | |||
| National Socialist Workers' Party of Denmark | 245 | 1.59 | +0.36 | |||
| Justice Party of Denmark | 92 | 0.60 | -0.24 | |||
| Farmers' Party | 30 | 0.19 | -0.65 | |||
| Total | 15,438 | |||||
| Source[38] | ||||||
General elections in the 1930s
1939 Danish Folketing election
| Parties | Vote | |||||
|---|---|---|---|---|---|---|
| Votes | % | + / - | ||||
| Social Democrats | 7,691 | 56.36 | -4.67 | |||
| Conservatives | 2,669 | 19.56 | -1.23 | |||
| Social Liberals | 1,646 | 12.06 | +3.17 | |||
| Venstre | 704 | 5.16 | -0.07 | |||
| Communist Party of Denmark | 419 | 3.07 | +0.80 | |||
| National Socialist Workers' Party of Denmark | 168 | 1.23 | +0.76 | |||
| Farmers' Party | 115 | 0.84 | +0.39 | |||
| Justice Party of Denmark | 115 | 0.84 | -0.03 | |||
| National Cooperation | 94 | 0.69 | New | |||
| Danish Unity | 24 | 0.18 | New | |||
| Total | 13,645 | |||||
| Source[39] | ||||||
1935 Danish Folketing election
| Parties | Vote | |||||
|---|---|---|---|---|---|---|
| Votes | % | + / - | ||||
| Social Democrats | 7,835 | 61.03 | +4.54 | |||
| Conservatives | 2,669 | 20.79 | +0.15 | |||
| Social Liberals | 1,141 | 8.89 | -0.66 | |||
| Venstre | 672 | 5.23 | -4.99 | |||
| Communist Party of Denmark | 292 | 2.27 | 0.00 | |||
| Justice Party of Denmark | 112 | 0.87 | +0.04 | |||
| National Socialist Workers' Party of Denmark | 60 | 0.47 | New | |||
| Independent People's Party | 58 | 0.45 | New | |||
| Total | 12,839 | |||||
| Source[40] | ||||||
1932 Danish Folketing election
| Parties | Vote | |||||
|---|---|---|---|---|---|---|
| Votes | % | + / - | ||||
| Social Democrats | 6,722 | 56.49 | +0.08 | |||
| Conservatives | 2,456 | 20.64 | -0.33 | |||
| Venstre | 1,216 | 10.22 | -1.46 | |||
| Social Liberals | 1,137 | 9.55 | -0.81 | |||
| Communist Party of Denmark | 270 | 2.27 | New | |||
| Justice Party of Denmark | 99 | 0.83 | +0.25 | |||
| Total | 11,900 | |||||
| Source[41] | ||||||
General elections in the 1920s
1929 Danish Folketing election
| Parties | Vote | |||||
|---|---|---|---|---|---|---|
| Votes | % | + / - | ||||
| Social Democrats | 6,276 | 56.41 | +6.90 | |||
| Conservatives | 2,333 | 20.97 | -5.87 | |||
| Venstre | 1,299 | 11.68 | +0.90 | |||
| Social Liberals | 1,152 | 10.36 | -2.28 | |||
| Justice Party of Denmark | 65 | 0.58 | +0.36 | |||
| Total | 11,125 | |||||
| Source[42] | ||||||
1926 Danish Folketing election
| Parties | Vote | |||||
|---|---|---|---|---|---|---|
| Votes | % | + / - | ||||
| Social Democrats | 5,097 | 49.51 | +2.97 | |||
| Conservatives | 2,763 | 26.84 | +0.58 | |||
| Social Liberals | 1,301 | 12.64 | -2.97 | |||
| Venstre | 1,110 | 10.78 | +0.17 | |||
| Justice Party of Denmark | 23 | 0.22 | New | |||
| Independence Party | 0 | 0.00 | New | |||
| Total | 10,294 | |||||
| Source[43] | ||||||
1924 Danish Folketing election
| Parties | Vote | |||||
|---|---|---|---|---|---|---|
| Votes | % | + / - | ||||
| Social Democrats | 4,660 | 46.54 | +2.63 | |||
| Conservatives | 2,629 | 26.26 | -1.07 | |||
| Social Liberals | 1,563 | 15.61 | +2.67 | |||
| Venstre | 1,062 | 10.61 | -1.56 | |||
| Farmer Party | 54 | 0.54 | New | |||
| Communist Party of Denmark | 44 | 0.44 | New | |||
| Total | 10,012 | |||||
| Source[44] | ||||||
September 1920 Danish Folketing election
| Parties | Vote | |||||
|---|---|---|---|---|---|---|
| Votes | % | + / - | ||||
| Social Democrats | 4,059 | 43.91 | +1.92 | |||
| Conservatives | 2,526 | 27.33 | -4.11 | |||
| Social Liberals | 1,196 | 12.94 | +2.25 | |||
| Venstre | 1,125 | 12.17 | -0.89 | |||
| Danish Left Socialist Party | 166 | 1.80 | New | |||
| Industry Party | 131 | 1.42 | -0.26 | |||
| Total | 9,244 | |||||
| Source[45] | ||||||
July 1920 Danish Folketing election
| Parties | Vote | |||||
|---|---|---|---|---|---|---|
| Votes | % | + / - | ||||
| Social Democrats | 3,308 | 41.99 | +2.05 | |||
| Conservatives | 2,477 | 31.44 | -0.82 | |||
| Venstre | 1,029 | 13.06 | +1.08 | |||
| Social Liberals | 842 | 10.69 | -2.04 | |||
| Industry Party | 132 | 1.68 | 0.00 | |||
| S. J. Petersen | 89 | 1.13 | New | |||
| Total | 7,878 | |||||
| Source[46] | ||||||
April 1920 Danish Folketing election
| Parties | Vote | |||||
|---|---|---|---|---|---|---|
| Votes | % | |||||
| Social Democrats | 3,280 | 39.94 | ||||
| Conservatives | 2,649 | 32.26 | ||||
| Social Liberals | 1,045 | 12.73 | ||||
| Venstre | 984 | 11.98 | ||||
| Industry Party | 138 | 1.68 | ||||
| Elias S. Nielsen | 116 | 1.41 | ||||
| Total | 8,212 | |||||
| Source[47] | ||||||
European Parliament elections results
2019 European Parliament election in Denmark
| Parties | Vote | |||||
|---|---|---|---|---|---|---|
| Votes | % | + / - | ||||
| Social Democrats | 6,105 | 19.86 | +1.69 | |||
| Venstre | 5,437 | 17.69 | +5.42 | |||
| Green Left | 4,263 | 13.87 | +2.21 | |||
| Social Liberals | 3,722 | 12.11 | +4.38 | |||
| Danish People's Party | 3,205 | 10.43 | -17.11 | |||
| Conservatives | 3,035 | 9.87 | -0.86 | |||
| Red–Green Alliance | 1,892 | 6.16 | New | |||
| People's Movement against the EU | 1,305 | 4.25 | -4.11 | |||
| The Alternative | 1,125 | 3.66 | New | |||
| Liberal Alliance | 650 | 2.11 | -1.43 | |||
| Total | 30,739 | |||||
| Source[48] | ||||||
2014 European Parliament election in Denmark
| Parties | Vote | |||||
|---|---|---|---|---|---|---|
| Votes | % | + / - | ||||
| Danish People's Party | 7,013 | 27.54 | +11.95 | |||
| Social Democrats | 4,627 | 18.17 | -1.55 | |||
| Venstre | 3,125 | 12.27 | -4.04 | |||
| Green Left | 2,970 | 11.66 | -5.67 | |||
| Conservatives | 2,733 | 10.73 | -3.37 | |||
| People's Movement against the EU | 2,129 | 8.36 | -0.28 | |||
| Social Liberals | 1,968 | 7.73 | +2.52 | |||
| Liberal Alliance | 901 | 3.54 | +2.83 | |||
| Total | 25,466 | |||||
| Source[49] | ||||||
2009 European Parliament election in Denmark
| Parties | Vote | |||||
|---|---|---|---|---|---|---|
| Votes | % | + / - | ||||
| Social Democrats | 5,078 | 19.72 | -12.41 | |||
| Green Left | 4,464 | 17.33 | +9.17 | |||
| Venstre | 4,200 | 16.31 | +4.28 | |||
| Danish People's Party | 4,016 | 15.59 | +8.53 | |||
| Conservatives | 3,630 | 14.10 | -2.36 | |||
| People's Movement against the EU | 2,224 | 8.64 | +0.54 | |||
| Social Liberals | 1,342 | 5.21 | -1.33 | |||
| June Movement | 615 | 2.39 | -6.59 | |||
| Liberal Alliance | 183 | 0.71 | New | |||
| Total | 25,752 | |||||
| Source[50] | ||||||
2004 European Parliament election in Denmark
| Parties | Vote | |||||
|---|---|---|---|---|---|---|
| Votes | % | + / - | ||||
| Social Democrats | 6,956 | 32.13 | +17.28 | |||
| Conservatives | 3,563 | 16.46 | +6.28 | |||
| Venstre | 2,604 | 12.03 | -6.39 | |||
| June Movement | 1,945 | 8.98 | -6.58 | |||
| Green Left | 1,767 | 8.16 | +1.18 | |||
| People's Movement against the EU | 1,754 | 8.10 | -4.54 | |||
| Danish People's Party | 1,528 | 7.06 | +0.88 | |||
| Social Liberals | 1,416 | 6.54 | -3.17 | |||
| Christian Democrats | 117 | 0.54 | -0.62 | |||
| Total | 21,650 | |||||
| Source[51] | ||||||
1999 European Parliament election in Denmark
| Parties | Vote | |||||
|---|---|---|---|---|---|---|
| Votes | % | + / - | ||||
| Venstre | 3,996 | 18.42 | +6.46 | |||
| June Movement | 3,375 | 15.56 | +0.88 | |||
| Social Democrats | 3,221 | 14.85 | -1.57 | |||
| People's Movement against the EU | 2,741 | 12.64 | -1.10 | |||
| Conservatives | 2,209 | 10.18 | -11.74 | |||
| Social Liberals | 2,107 | 9.71 | +0.69 | |||
| Green Left | 1,515 | 6.98 | -1.84 | |||
| Danish People's Party | 1,341 | 6.18 | New | |||
| Centre Democrats | 934 | 4.31 | +3.58 | |||
| Christian Democrats | 252 | 1.16 | +0.64 | |||
| Progress Party | 100 | 0.46 | -1.73 | |||
| Total | 21,691 | |||||
| Source[52] | ||||||
1994 European Parliament election in Denmark
| Parties | Vote | |||||
|---|---|---|---|---|---|---|
| Votes | % | + / - | ||||
| Conservatives | 5,039 | 21.92 | +6.14 | |||
| Social Democrats | 3,773 | 16.42 | -8.54 | |||
| June Movement | 3,374 | 14.68 | New | |||
| People's Movement against the EU | 3,158 | 13.74 | -8.73 | |||
| Venstre | 2,748 | 11.96 | +1.57 | |||
| Social Liberals | 2,074 | 9.02 | +6.28 | |||
| Green Left | 2,027 | 8.82 | -1.25 | |||
| Progress Party | 504 | 2.19 | -1.83 | |||
| Centre Democrats | 168 | 0.73 | -7.35 | |||
| Christian Democrats | 120 | 0.52 | -0.97 | |||
| Total | 22,985 | |||||
| Source[53] | ||||||
1989 European Parliament election in Denmark
| Parties | Vote | |||||
|---|---|---|---|---|---|---|
| Votes | % | + / - | ||||
| Social Democrats | 4,995 | 24.96 | +6.48 | |||
| People's Movement against the EU | 4,497 | 22.47 | -6.15 | |||
| Conservatives | 3,158 | 15.78 | -6.70 | |||
| Venstre | 2,080 | 10.39 | +4.83 | |||
| Green Left | 2,015 | 10.07 | -0.80 | |||
| Centre Democrats | 1,617 | 8.08 | +2.53 | |||
| Progress Party | 804 | 4.02 | +1.03 | |||
| Social Liberals | 549 | 2.74 | -0.11 | |||
| Christian Democrats | 299 | 1.49 | 0.00 | |||
| Total | 20,014 | |||||
| Source[54] | ||||||
1984 European Parliament election in Denmark
| Parties | Vote | |||||
|---|---|---|---|---|---|---|
| Votes | % | |||||
| People's Movement against the EU | 6,375 | 28.62 | ||||
| Conservatives | 5,007 | 22.48 | ||||
| Social Democrats | 4,118 | 18.48 | ||||
| Green Left | 2,422 | 10.87 | ||||
| Venstre | 1,239 | 5.56 | ||||
| Centre Democrats | 1,236 | 5.55 | ||||
| Progress Party | 667 | 2.99 | ||||
| Social Liberals | 635 | 2.85 | ||||
| Christian Democrats | 331 | 1.49 | ||||
| Left Socialists | 248 | 1.11 | ||||
| Total | 22,278 | |||||
| Source[55] | ||||||
Referendums
2022 Danish European Union opt-out referendum[56]
| Option | Votes | % |
|---|---|---|
| ✓ YES | 21,396 | 69.28 |
| X NO | 9,488 | 30.72 |
2015 Danish European Union opt-out referendum[57]
| Option | Votes | % |
|---|---|---|
| X NO | 16,814 | 52.13 |
| ✓ YES | 15,438 | 47.87 |
2014 Danish Unified Patent Court membership referendum[58]
| Option | Votes | % |
|---|---|---|
| ✓ YES | 15,733 | 63.06 |
| X NO | 9,218 | 36.94 |
2009 Danish Act of Succession referendum[59]
| Option | Votes | % |
|---|---|---|
| ✓ YES | 19,819 | 84.35 |
| X NO | 3,676 | 15.65 |
2000 Danish euro referendum[60]
| Option | Votes | % |
|---|---|---|
| X NO | 20,270 | 53.44 |
| ✓ YES | 17,658 | 46.56 |
1998 Danish Amsterdam Treaty referendum[61]
| Option | Votes | % |
|---|---|---|
| ✓ YES | 17,100 | 52.19 |
| X NO | 15,664 | 47.81 |
1993 Danish Maastricht Treaty referendum[62]
| Option | Votes | % |
|---|---|---|
| ✓ YES | 19,568 | 53.23 |
| X NO | 17,193 | 46.77 |
1992 Danish Maastricht Treaty referendum[63]
| Option | Votes | % |
|---|---|---|
| X NO | 18,815 | 53.08 |
| ✓ YES | 16,633 | 46.92 |
1986 Danish Single European Act referendum[64]
| Option | Votes | % |
|---|---|---|
| X NO | 16,393 | 52.11 |
| ✓ YES | 15,063 | 47.89 |
1972 Danish European Communities membership referendum[65]
| Option | Votes | % |
|---|---|---|
| ✓ YES | 17,753 | 54.33 |
| X NO | 14,924 | 45.67 |
1953 Danish constitutional and electoral age referendum[66]
| Option | Votes | % |
|---|---|---|
| ✓ YES | 10,417 | 76.89 |
| X NO | 3,131 | 23.11 |
| 21 years | 7,559 | 53.67 |
| 23 years | 6,526 | 46.33 |
1939 Danish constitutional referendum[67]
| Option | Votes | % |
|---|---|---|
| ✓ YES | 10,532 | 94.32 |
| X NO | 634 | 5.68 |
References
- "Helsingørkredsen". kmdvalg.dk (in Danish). Retrieved 2023-06-08.
- "Beretning om Forhandlingerne paa Rigsdagen". Rigsdagstidende. II: Spalte 3892 ff.
- "Nye valgkredse fordeler stemmerne anderledes". dr.dk (in Danish). Retrieved 2023-06-08.
- "Beretning om nye valgkredse som følge af kommunalreformen" (in Danish). Retrieved 2023-06-08.
- "Det danske valgsystem: Valg til Folketinget". valg.im (in Danish). Retrieved 2023-06-08.
- "21 Helsingør". dataforsyningen.dk (in Danish). Retrieved 2023-06-08.
- "Beretning om Forhandlingerne paa Rigsdagen". Rigsdagstidende. II: Spalte 3892 ff.
- "Valgresultater fra tidligere valg:". kmdvalg (in Danish). Retrieved 2023-06-08.
- "FOLKETINGSVALG TIRSDAG 1. NOVEMBER 2022". valg.im (in Danish). Retrieved 2023-06-27.
- "FOLKETINGSVALG ONSDAG 5. JUNI 2019". valg.im (in Danish). Retrieved 2023-06-27.
- "FOLKETINGSVALG TORSDAG 18. JUNI 2015". valg.im (in Danish). Retrieved 2023-06-27.
- "FOLKETINGSVALG TORSDAG 15. SEPTEMBER 2011". valg.im (in Danish). Retrieved 2023-06-27.
- "Folketingsvalget den 13. november 2007". valg.im (in Danish). Retrieved 2023-06-27.
- "valg2005.book" (PDF). valg.im (in Danish). Retrieved 2023-06-27.
- "BMTABEL" (PDF). valg.im (in Danish). Retrieved 2023-06-27.
- "VALG98" (PDF). valg.im (in Danish). Retrieved 2023-06-27.
- "VALG94" (PDF). valg.im (in Danish). Retrieved 2023-06-27.
- "VALG90" (PDF). valg.im (in Danish). Retrieved 2023-06-27.
- "Folketingsvalget den 10. maj 1988". valg.im (in Danish). Retrieved 2023-06-27.
- "Folketingsvalget den 8.september 1987". dst.dk (in Danish). Retrieved 2023-06-27.
- "Folketingsvalget den 10. januar 1984". dst.dk (in Danish). Retrieved 2023-06-27.
- "Folketingsvalget den 8. december 1981". dst.dk (in Danish). Retrieved 2023-06-27.
- "Folketingsvalget den 23. oktober 1979". dst.dk (in Danish). Retrieved 2023-06-27.
- "Folketingsvalget den 15. februar 1977". dst.dk (in Danish). Retrieved 2023-06-27.
- "Folketingsvalget den 9. januar 1975". dst.dk (in Danish). Retrieved 2023-06-27.
- "Folketingsvalget den 4. december 1973". dst.dk (in Danish). Retrieved 2023-06-27.
- "Folketingsvalget den 21. september 1971 samt folkeafstemningen". dst.dk (in Danish). Retrieved 2023-06-27.
- "Folketingsvalget den 23. januar 1968". dst.dk (in Danish). Retrieved 2023-06-27.
- "Folketingsvalget den 22. november 1966". dst.dk (in Danish). Retrieved 2023-06-27.
- "Folketingsvalget den 22. september 1964". dst.dk (in Danish). Retrieved 2023-06-27.
- "Folketingsvalget den 15. november 1960". dst.dk (in Danish). Retrieved 2023-06-27.
- "Folketingsvalget den 14. maj 1957". dst.dk (in Danish). Retrieved 2023-06-27.
- "Folketingsvalget den 22. september 1953". dst.dk (in Danish). Retrieved 2023-06-27.
- "Rigsdagsvalgene og folkeafstemningerne i april og maj 1953". dst.dk (in Danish). Retrieved 2023-06-27.
- "Folketingsvalget den 5. september 1950". dst.dk (in Danish). Retrieved 2023-06-27.
- "Folketingsvalget den 28. oktober 1947". dst.dk (in Danish). Retrieved 2023-06-27.
- "Rigsdagsvalgene i oktober og november 1945". dst.dk (in Danish). Retrieved 2023-06-27.
- "Rigsdagsvalgene i marts og april 1943". dst.dk (in Danish). Retrieved 2023-06-27.
- "Rigsdagsvalgene og Folkeafstemningen i april og maj 1939". dst.dk (in Danish). Retrieved 2023-06-27.
- "Folketingsvalget den 22. oktober 1935". dst.dk (in Danish). Retrieved 2023-06-27.
- "Folketingsvalget den 16. november 1932". dst.dk (in Danish). Retrieved 2023-06-27.
- "Folketingsvalget den 24. april 1929". dst.dk (in Danish). Retrieved 2023-06-27.
- "Folketingsvalget den 2. december 1926". dst.dk (in Danish). Retrieved 2023-06-27.
- "Folketingsvalget den 11. april 1924". dst.dk (in Danish). Retrieved 2023-06-27.
- "Rigsdagsvalgene september-oktober 1920". dst.dk (in Danish). Retrieved 2023-06-27.
- "Rigsdagsvalgene juli-august 1920". dst.dk (in Danish). Retrieved 2023-06-27.
- "Folketingsvalget den 26. april 1920". dst.dk (in Danish). Retrieved 2023-06-27.
- "EUROPA-PARLAMENTSVALG SØNDAG 26. MAJ 2019". dst.dk (in Danish). Retrieved 2023-07-01.
- "EUROPA-PARLAMENTSVALG SØNDAG 25. MAJ 2014". dst.dk (in Danish). Retrieved 2023-07-01.
- "EUROPA-PARLAMENTSVALG SØNDAG 7. JUNI 2009". dst.dk (in Danish). Retrieved 2023-07-01.
- "EUROPA-PARLAMENTSVALGET DEN 13. JUNI 2004" (PDF). im.dk (in Danish). Retrieved 2023-07-01.
- "VALGET TIL EUROPA-PARLAMENTET DEN 10. JUNI 1999" (PDF). im.dk (in Danish). Retrieved 2023-07-01.
- "VALGET TIL EUROPA-PARLAMENTET DEN 9. JUNI 1994" (PDF). im.dk (in Danish). Retrieved 2023-07-01.
- "Valget til Europa-parlamentet den 15. juni 1989". dst.dk (in Danish). Retrieved 2023-07-01.
- "Valget til Europa-Parlamentet den 14. juni 1984". dst.dk (in Danish). Retrieved 2023-07-01.
- "FOLKEAFSTEMNING ONSDAG 1. JUNI 2022". dst.dk (in Danish). Retrieved 2023-07-05.
- "FOLKEAFSTEMNING TORSDAG 3. DECEMBER 2015". dst.dk (in Danish). Retrieved 2023-07-05.
- "FOLKEAFSTEMNING SØNDAG 25. MAJ 2014". dst.dk (in Danish). Retrieved 2023-07-05.
- "FOLKEAFSTEMNING SØNDAG 7. JUNI 2009". dst.dk (in Danish). Retrieved 2023-07-05.
- "FOLKEAFSTEMNINGEN DEN 28. SEPTEMBER 2000 OM DANMARKS DELTAGELSE I DEN FÆLLES VALUTA" (PDF). valg.im (in Danish). Retrieved 2023-07-05.
- "FOLKEAFSTEMNINGEN DEN 28. MAJ 1998OM DANMARKS TILTRÆDELSE AF AMSTERDAMTRAKTATEN" (PDF). valg.im (in Danish). Retrieved 2023-07-05.
- "FOLKEAFSTEMNINGEN DEN 18. MAJ 1993 OM DANMARKS TILTRÆDELSE AF EDINBURGH-AFGØRELSEN OG MAASTRICHT-TRAKTATEN". dst.dk (in Danish). Retrieved 2023-07-05.
- "Folkeafstemningen den 1. juni 1992 om Danmarks tiltrædelse af traktaten om Den Europæiske Union". dst.dk (in Danish). Retrieved 2023-07-05.
- "Vejledende folkeafstemning torsdag den 27. februar 1986 om Danmarks tiltrædelse af EF- pakken". dst.dk (in Danish). Retrieved 2023-07-05.
- "Folkeafstemningen om Danmarks tiltrædelse af De europæiske Fælleskaber 2. oktober 1972". dst.dk (in Danish). Retrieved 2023-07-05.
- "Publikationsfortegnelse vedrørende Folkeafstemninger". dst.dk (in Danish). Retrieved 2023-07-05.
- "Publikationsfortegnelse vedrørende Folkeafstemninger". dst.dk (in Danish). Retrieved 2023-07-05.