Hillerød (nomination district)
Hillerød nominating district is one of the 92 nominating districts that was created for Danish elections following the 2007 municipal reform.[3][4][5] It consists of Gribskov and Hillerød municipality.[6] It was created in 1849 as a constituency,[7] and has been a nomination district since 1920, though its boundaries have been changed since then.
| Hillerød | |
|---|---|
| Hillerød | |
| Nomination district constituency for the Folketing | |
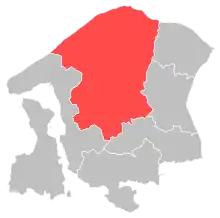 Location of Hillerød within North Zealand | |
 Location of North Zealand within Denmark | |
| Municipalities | Gribskov Hillerød |
| Constituency | North Zealand |
| Electorate | 70,397 (2022)[1] |
| Current constituency | |
| Created | 1849 (as constituency)[2] 1920 (as nomination district) |
In general elections, the district tends to vote a bit more for parties commonly associated with the blue bloc.[8]
General elections results
General elections in the 2020s
| Parties | Vote | |||||
|---|---|---|---|---|---|---|
| Votes | % | + / - | ||||
| Social Democrats | 14,270 | 24.06 | +1.44 | |||
| Venstre | 8,108 | 13.67 | -10.44 | |||
| Moderates | 7,698 | 12.98 | New | |||
| Green Left | 4,875 | 8.22 | +1.30 | |||
| Liberal Alliance | 4,866 | 8.20 | +5.48 | |||
| Conservatives | 3,661 | 6.17 | -2.07 | |||
| Denmark Democrats | 3,592 | 6.06 | New | |||
| New Right | 2,814 | 4.74 | +1.09 | |||
| Red–Green Alliance | 2,641 | 4.45 | -1.48 | |||
| Social Liberals | 2,293 | 3.87 | -5.37 | |||
| The Alternative | 2,064 | 3.48 | +0.44 | |||
| Danish People's Party | 1,733 | 2.92 | -5.47 | |||
| Christian Democrats | 338 | 0.57 | -1.64 | |||
| Independent Greens | 284 | 0.48 | New | |||
| Jayseth Lotus Arrose Simoysano | 54 | 0.09 | New | |||
| Katjalivah Elleyhansen | 16 | 0.03 | New | |||
| Total | 59,307 | |||||
| Source[9] | ||||||
General elections in the 2010s
| Parties | Vote | |||||
|---|---|---|---|---|---|---|
| Votes | % | + / - | ||||
| Venstre | 13,996 | 24.11 | +2.70 | |||
| Social Democrats | 13,131 | 22.62 | +0.29 | |||
| Social Liberals | 5,362 | 9.24 | +4.23 | |||
| Danish People's Party | 4,869 | 8.39 | -12.81 | |||
| Conservatives | 4,786 | 8.24 | +4.72 | |||
| Green Left | 4,015 | 6.92 | +2.82 | |||
| Red–Green Alliance | 3,441 | 5.93 | -0.83 | |||
| New Right | 2,118 | 3.65 | New | |||
| The Alternative | 1,765 | 3.04 | -1.88 | |||
| Liberal Alliance | 1,580 | 2.72 | -6.57 | |||
| Christian Democrats | 1,283 | 2.21 | +0.79 | |||
| Stram Kurs | 1,048 | 1.81 | New | |||
| Klaus Riskær Pedersen Party | 566 | 0.97 | New | |||
| Gert Lassen | 86 | 0.15 | +0.14 | |||
| Hans Frederik Brobjerg | 8 | 0.01 | New | |||
| Total | 58,054 | |||||
| Source[10] | ||||||
| Parties | Vote | |||||
|---|---|---|---|---|---|---|
| Votes | % | + / - | ||||
| Social Democrats | 12,889 | 22.33 | +3.26 | |||
| Venstre | 12,358 | 21.41 | -12.49 | |||
| Danish People's Party | 12,234 | 21.20 | +9.88 | |||
| Liberal Alliance | 5,362 | 9.29 | +3.50 | |||
| Red–Green Alliance | 3,902 | 6.76 | +0.99 | |||
| Social Liberals | 2,893 | 5.01 | -5.63 | |||
| The Alternative | 2,840 | 4.92 | New | |||
| Green Left | 2,366 | 4.10 | -3.39 | |||
| Conservatives | 2,030 | 3.52 | -1.57 | |||
| Christian Democrats | 819 | 1.42 | +0.53 | |||
| Aleks Jensen | 11 | 0.02 | New | |||
| Gert Lassen | 6 | 0.01 | New | |||
| Total | 57,710 | |||||
| Source[11] | ||||||
| Parties | Vote | |||||
|---|---|---|---|---|---|---|
| Votes | % | + / - | ||||
| Venstre | 19,535 | 33.90 | +5.41 | |||
| Social Democrats | 10,989 | 19.07 | -3.04 | |||
| Danish People's Party | 6,526 | 11.32 | -2.31 | |||
| Social Liberals | 6,133 | 10.64 | +4.34 | |||
| Green Left | 4,319 | 7.49 | -3.71 | |||
| Liberal Alliance | 3,335 | 5.79 | +2.01 | |||
| Red–Green Alliance | 3,324 | 5.77 | +3.56 | |||
| Conservatives | 2,936 | 5.09 | -6.14 | |||
| Christian Democrats | 515 | 0.89 | -0.15 | |||
| Bjarne Holm | 21 | 0.04 | New | |||
| Total | 57,633 | |||||
| Source[12] | ||||||
General elections in the 2000s
| Parties | Vote | |||||
|---|---|---|---|---|---|---|
| Votes | % | + / - | ||||
| Venstre | 15,797 | 28.49 | -3.83 | |||
| Social Democrats | 12,261 | 22.11 | +1.99 | |||
| Danish People's Party | 7,559 | 13.63 | +1.64 | |||
| Conservatives | 6,228 | 11.23 | -1.23 | |||
| Green Left | 6,208 | 11.20 | +5.20 | |||
| Social Liberals | 3,495 | 6.30 | -5.86 | |||
| New Alliance | 2,095 | 3.78 | New | |||
| Red–Green Alliance | 1,227 | 2.21 | -0.97 | |||
| Christian Democrats | 577 | 1.04 | -0.57 | |||
| Total | 55,447 | |||||
| Source[13] | ||||||
| Parties | Vote | |||||
|---|---|---|---|---|---|---|
| Votes | % | + / - | ||||
| Venstre | 23,570 | 32.32 | -4.59 | |||
| Social Democrats | 13,939 | 19.12 | -4.24 | |||
| Conservatives | 9,086 | 12.46 | +3.36 | |||
| Social Liberals | 8,870 | 12.16 | +5.82 | |||
| Danish People's Party | 8,742 | 11.99 | +1.93 | |||
| Green Left | 4,230 | 5.80 | -1.26 | |||
| Red–Green Alliance | 2,321 | 3.18 | +0.99 | |||
| Christian Democrats | 1,172 | 1.61 | -0.61 | |||
| Centre Democrats | 842 | 1.15 | -1.29 | |||
| Minority Party | 146 | 0.20 | New | |||
| Total | 72,918 | |||||
| Source[14] | ||||||
| Parties | Vote | |||||
|---|---|---|---|---|---|---|
| Votes | % | + / - | ||||
| Venstre | 27,487 | 36.91 | +11.83 | |||
| Social Democrats | 17,401 | 23.36 | -5.36 | |||
| Danish People's Party | 7,489 | 10.06 | +2.90 | |||
| Conservatives | 6,779 | 9.10 | -5.49 | |||
| Green Left | 5,259 | 7.06 | -1.43 | |||
| Social Liberals | 4,725 | 6.34 | +2.28 | |||
| Centre Democrats | 1,814 | 2.44 | -3.32 | |||
| Christian People's Party | 1,650 | 2.22 | +0.13 | |||
| Red–Green Alliance | 1,632 | 2.19 | -0.41 | |||
| Progress Party | 239 | 0.32 | -0.82 | |||
| Total | 74,475 | |||||
| Source[15] | ||||||
General elections in the 1990s
| Parties | Vote | |||||
|---|---|---|---|---|---|---|
| Votes | % | + / - | ||||
| Social Democrats | 20,774 | 28.72 | +2.42 | |||
| Venstre | 18,141 | 25.08 | -0.27 | |||
| Conservatives | 10,555 | 14.59 | -6.27 | |||
| Green Left | 6,139 | 8.49 | +0.16 | |||
| Danish People's Party | 5,180 | 7.16 | New | |||
| Centre Democrats | 4,167 | 5.76 | +1.55 | |||
| Social Liberals | 2,939 | 4.06 | -1.19 | |||
| Red–Green Alliance | 1,883 | 2.60 | -0.79 | |||
| Christian People's Party | 1,513 | 2.09 | +0.54 | |||
| Progress Party | 824 | 1.14 | -3.57 | |||
| Democratic Renewal | 180 | 0.25 | New | |||
| Sabina Schilliing Nybo Rasmussen | 39 | 0.05 | New | |||
| Total | 72,334 | |||||
| Source[16] | ||||||
| Parties | Vote | |||||
|---|---|---|---|---|---|---|
| Votes | % | + / - | ||||
| Social Democrats | 18,442 | 26.30 | -2.22 | |||
| Venstre | 17,778 | 25.35 | +7.15 | |||
| Conservatives | 14,626 | 20.86 | +0.63 | |||
| Green Left | 5,842 | 8.33 | -0.44 | |||
| Social Liberals | 3,684 | 5.25 | +1.12 | |||
| Progress Party | 3,301 | 4.71 | +0.15 | |||
| Centre Democrats | 2,952 | 4.21 | -4.18 | |||
| Red–Green Alliance | 2,377 | 3.39 | +0.87 | |||
| Christian People's Party | 1,086 | 1.55 | -0.17 | |||
| Jørgen Ruberg | 38 | 0.05 | New | |||
| Total | 70,126 | |||||
| Source[17] | ||||||
| Parties | Vote | |||||
|---|---|---|---|---|---|---|
| Votes | % | + / - | ||||
| Social Democrats | 18,839 | 28.52 | +6.50 | |||
| Conservatives | 13,361 | 20.23 | -5.19 | |||
| Venstre | 12,021 | 18.20 | +7.79 | |||
| Green Left | 5,794 | 8.77 | -4.93 | |||
| Centre Democrats | 5,544 | 8.39 | +0.80 | |||
| Progress Party | 3,015 | 4.56 | -2.92 | |||
| Social Liberals | 2,728 | 4.13 | -2.93 | |||
| Red–Green Alliance | 1,662 | 2.52 | New | |||
| Christian People's Party | 1,137 | 1.72 | +0.14 | |||
| Common Course | 882 | 1.34 | -0.12 | |||
| The Greens | 709 | 1.07 | -0.81 | |||
| Justice Party of Denmark | 342 | 0.52 | New | |||
| Humanist Party | 22 | 0.03 | New | |||
| Total | 66,056 | |||||
| Source[18] | ||||||
General elections in the 1980s
| Parties | Vote | |||||
|---|---|---|---|---|---|---|
| Votes | % | + / - | ||||
| Conservatives | 17,010 | 25.42 | -1.89 | |||
| Social Democrats | 14,734 | 22.02 | +1.25 | |||
| Green Left | 9,167 | 13.70 | -1.68 | |||
| Venstre | 6,964 | 10.41 | +1.96 | |||
| Centre Democrats | 5,081 | 7.59 | -0.26 | |||
| Progress Party | 5,006 | 7.48 | +3.98 | |||
| Social Liberals | 4,727 | 7.06 | -1.21 | |||
| The Greens | 1,260 | 1.88 | -0.14 | |||
| Christian People's Party | 1,057 | 1.58 | -0.16 | |||
| Common Course | 979 | 1.46 | -0.27 | |||
| Communist Party of Denmark | 596 | 0.89 | -0.04 | |||
| Left Socialists | 330 | 0.49 | -0.83 | |||
| Lars Kristensen | 14 | 0.02 | -0.01 | |||
| Total | 66,925 | |||||
| Source[19] | ||||||
| Parties | Vote | |||||
|---|---|---|---|---|---|---|
| Votes | % | + / - | ||||
| Conservatives | 18,472 | 27.31 | -2.29 | |||
| Social Democrats | 14,045 | 20.77 | -3.15 | |||
| Green Left | 10,402 | 15.38 | +3.12 | |||
| Venstre | 5,713 | 8.45 | -3.92 | |||
| Social Liberals | 5,592 | 8.27 | +1.29 | |||
| Centre Democrats | 5,307 | 7.85 | +2.86 | |||
| Progress Party | 2,367 | 3.50 | +0.80 | |||
| The Greens | 1,364 | 2.02 | New | |||
| Christian People's Party | 1,175 | 1.74 | -0.09 | |||
| Common Course | 1,167 | 1.73 | New | |||
| Left Socialists | 891 | 1.32 | -1.61 | |||
| Communist Party of Denmark | 626 | 0.93 | +0.11 | |||
| Justice Party of Denmark | 317 | 0.47 | -1.04 | |||
| Humanist Party | 129 | 0.19 | New | |||
| Socialist Workers Party | 33 | 0.05 | +0.01 | |||
| Lars Kristensen | 23 | 0.03 | +0.02 | |||
| Marxist–Leninists Party | 13 | 0.02 | -0.01 | |||
| Total | 67,636 | |||||
| Source[20] | ||||||
| Parties | Vote | |||||
|---|---|---|---|---|---|---|
| Votes | % | + / - | ||||
| Conservatives | 19,431 | 29.60 | +9.64 | |||
| Social Democrats | 15,697 | 23.92 | -1.65 | |||
| Venstre | 8,117 | 12.37 | +1.80 | |||
| Green Left | 8,050 | 12.26 | -0.14 | |||
| Social Liberals | 4,583 | 6.98 | +0.97 | |||
| Centre Democrats | 3,274 | 4.99 | -5.29 | |||
| Left Socialists | 1,922 | 2.93 | +0.09 | |||
| Progress Party | 1,771 | 2.70 | -5.32 | |||
| Christian People's Party | 1,202 | 1.83 | +0.29 | |||
| Justice Party of Denmark | 994 | 1.51 | +0.05 | |||
| Communist Party of Denmark | 539 | 0.82 | -0.30 | |||
| Socialist Workers Party | 24 | 0.04 | 0.00 | |||
| Marxist–Leninists Party | 17 | 0.03 | New | |||
| Lars Kristensen | 8 | 0.01 | New | |||
| Leni Thomsen | 5 | 0.01 | New | |||
| Lars Bjørnbak Hallstein | 1 | 0.00 | New | |||
| Total | 65,635 | |||||
| Source[21] | ||||||
| Parties | Vote | |||||
|---|---|---|---|---|---|---|
| Votes | % | + / - | ||||
| Social Democrats | 15,533 | 25.57 | -6.56 | |||
| Conservatives | 12,128 | 19.96 | +3.02 | |||
| Green Left | 7,533 | 12.40 | +6.09 | |||
| Venstre | 6,420 | 10.57 | -2.30 | |||
| Centre Democrats | 6,246 | 10.28 | +5.85 | |||
| Progress Party | 4,872 | 8.02 | -1.88 | |||
| Social Liberals | 3,651 | 6.01 | -0.37 | |||
| Left Socialists | 1,723 | 2.84 | -1.49 | |||
| Christian People's Party | 935 | 1.54 | -0.19 | |||
| Justice Party of Denmark | 884 | 1.46 | -1.26 | |||
| Communist Party of Denmark | 681 | 1.12 | -0.65 | |||
| Communist Workers Party | 127 | 0.21 | -0.28 | |||
| Socialist Workers Party | 22 | 0.04 | New | |||
| Total | 60,755 | |||||
| Source[22] | ||||||
General elections in the 1970s
| Parties | Vote | |||||
|---|---|---|---|---|---|---|
| Votes | % | + / - | ||||
| Social Democrats | 19,433 | 32.13 | +1.62 | |||
| Conservatives | 10,247 | 16.94 | +6.77 | |||
| Venstre | 7,781 | 12.87 | +0.26 | |||
| Progress Party | 5,986 | 9.90 | -5.06 | |||
| Social Liberals | 3,859 | 6.38 | +2.44 | |||
| Green Left | 3,814 | 6.31 | +1.92 | |||
| Centre Democrats | 2,681 | 4.43 | -5.95 | |||
| Left Socialists | 2,617 | 4.33 | +0.68 | |||
| Justice Party of Denmark | 1,646 | 2.72 | -0.76 | |||
| Communist Party of Denmark | 1,072 | 1.77 | -1.18 | |||
| Christian People's Party | 1,047 | 1.73 | -0.70 | |||
| Communist Workers Party | 296 | 0.49 | New | |||
| Total | 60,479 | |||||
| Source[23] | ||||||
| Parties | Vote | |||||
|---|---|---|---|---|---|---|
| Votes | % | + / - | ||||
| Social Democrats | 17,265 | 30.51 | +9.01 | |||
| Progress Party | 8,467 | 14.96 | +0.98 | |||
| Venstre | 7,137 | 12.61 | -15.34 | |||
| Centre Democrats | 5,873 | 10.38 | +6.95 | |||
| Conservatives | 5,756 | 10.17 | +3.17 | |||
| Green Left | 2,483 | 4.39 | -0.99 | |||
| Social Liberals | 2,229 | 3.94 | -4.22 | |||
| Left Socialists | 2,066 | 3.65 | +0.68 | |||
| Justice Party of Denmark | 1,968 | 3.48 | +1.22 | |||
| Communist Party of Denmark | 1,667 | 2.95 | -0.25 | |||
| Christian People's Party | 1,374 | 2.43 | -1.68 | |||
| Pensioners' Party | 305 | 0.54 | New | |||
| Kaj Boriths-Sørensen | 2 | 0.00 | New | |||
| Total | 56,592 | |||||
| Source[24] | ||||||
| Parties | Vote | |||||
|---|---|---|---|---|---|---|
| Votes | % | + / - | ||||
| Venstre | 14,656 | 27.95 | +14.62 | |||
| Social Democrats | 11,275 | 21.50 | +4.65 | |||
| Progress Party | 7,330 | 13.98 | -3.41 | |||
| Social Liberals | 4,281 | 8.16 | -3.56 | |||
| Conservatives | 3,668 | 7.00 | -4.50 | |||
| Green Left | 2,820 | 5.38 | -0.51 | |||
| Christian People's Party | 2,153 | 4.11 | +1.27 | |||
| Centre Democrats | 1,799 | 3.43 | -9.27 | |||
| Communist Party of Denmark | 1,677 | 3.20 | +0.34 | |||
| Left Socialists | 1,556 | 2.97 | +1.13 | |||
| Justice Party of Denmark | 1,184 | 2.26 | -0.81 | |||
| H. Lindholt | 36 | 0.07 | New | |||
| Total | 52,435 | |||||
| Source[25] | ||||||
| Parties | Vote | |||||
|---|---|---|---|---|---|---|
| Votes | % | + / - | ||||
| Progress Party | 8,811 | 17.39 | New | |||
| Social Democrats | 8,539 | 16.85 | -13.08 | |||
| Venstre | 6,755 | 13.33 | -4.56 | |||
| Centre Democrats | 6,433 | 12.70 | New | |||
| Social Liberals | 5,938 | 11.72 | -4.05 | |||
| Conservatives | 5,826 | 11.50 | -10.61 | |||
| Green Left | 2,985 | 5.89 | -2.52 | |||
| Justice Party of Denmark | 1,553 | 3.07 | +1.36 | |||
| Communist Party of Denmark | 1,449 | 2.86 | +1.77 | |||
| Christian People's Party | 1,440 | 2.84 | +1.53 | |||
| Left Socialists | 934 | 1.84 | +0.06 | |||
| Total | 50,663 | |||||
| Source[26] | ||||||
| Parties | Vote | |||||
|---|---|---|---|---|---|---|
| Votes | % | + / - | ||||
| Social Democrats | 12,862 | 29.93 | +1.35 | |||
| Conservatives | 9,503 | 22.11 | -0.98 | |||
| Venstre | 7,688 | 17.89 | -5.30 | |||
| Social Liberals | 6,776 | 15.77 | +0.99 | |||
| Green Left | 3,616 | 8.41 | +3.53 | |||
| Left Socialists | 767 | 1.78 | -0.10 | |||
| Justice Party of Denmark | 735 | 1.71 | +1.24 | |||
| Christian People's Party | 562 | 1.31 | New | |||
| Communist Party of Denmark | 467 | 1.09 | +0.15 | |||
| Total | 42,976 | |||||
| Source[27] | ||||||
General elections in the 1960s
| Parties | Vote | |||||
|---|---|---|---|---|---|---|
| Votes | % | + / - | ||||
| Social Democrats | 11,636 | 28.58 | -5.26 | |||
| Venstre | 9,443 | 23.19 | -1.83 | |||
| Conservatives | 9,400 | 23.09 | +2.62 | |||
| Social Liberals | 6,017 | 14.78 | +8.09 | |||
| Green Left | 1,989 | 4.88 | -3.61 | |||
| Liberal Centre | 779 | 1.91 | -1.44 | |||
| Left Socialists | 766 | 1.88 | New | |||
| Communist Party of Denmark | 381 | 0.94 | +0.35 | |||
| Justice Party of Denmark | 190 | 0.47 | +0.06 | |||
| Independent Party | 117 | 0.29 | -0.85 | |||
| Total | 40,718 | |||||
| Source[28] | ||||||
| Parties | Vote | |||||
|---|---|---|---|---|---|---|
| Votes | % | + / - | ||||
| Social Democrats | 12,543 | 33.84 | -3.51 | |||
| Venstre | 9,275 | 25.02 | -4.50 | |||
| Conservatives | 7,587 | 20.47 | +0.69 | |||
| Green Left | 3,146 | 8.49 | +3.91 | |||
| Social Liberals | 2,480 | 6.69 | +1.94 | |||
| Liberal Centre | 1,241 | 3.35 | New | |||
| Independent Party | 421 | 1.14 | -0.62 | |||
| Communist Party of Denmark | 217 | 0.59 | -0.33 | |||
| Justice Party of Denmark | 151 | 0.41 | -0.54 | |||
| Carl Møller | 5 | 0.01 | -0.02 | |||
| Erik Hoffmeyer | 4 | 0.01 | New | |||
| P. Lüchow | 0 | 0.00 | -0.02 | |||
| Total | 37,070 | |||||
| Source[29] | ||||||
| Parties | Vote | |||||
|---|---|---|---|---|---|---|
| Votes | % | + / - | ||||
| Social Democrats | 12,035 | 37.35 | -1.39 | |||
| Venstre | 9,512 | 29.52 | -1.17 | |||
| Conservatives | 6,372 | 19.78 | +4.96 | |||
| Social Liberals | 1,531 | 4.75 | -0.90 | |||
| Green Left | 1,477 | 4.58 | -0.55 | |||
| Independent Party | 567 | 1.76 | -0.70 | |||
| Justice Party of Denmark | 307 | 0.95 | -0.60 | |||
| Communist Party of Denmark | 296 | 0.92 | -0.03 | |||
| Danish Unity | 108 | 0.34 | New | |||
| Carl Møller | 9 | 0.03 | New | |||
| P. Lüchow | 7 | 0.02 | New | |||
| Total | 32,221 | |||||
| Source[30] | ||||||
| Parties | Vote | |||||
|---|---|---|---|---|---|---|
| Votes | % | + / - | ||||
| Social Democrats | 10,234 | 38.74 | +2.65 | |||
| Venstre | 8,106 | 30.69 | -3.62 | |||
| Conservatives | 3,915 | 14.82 | +1.09 | |||
| Social Liberals | 1,493 | 5.65 | -2.19 | |||
| Green Left | 1,355 | 5.13 | New | |||
| Independent Party | 651 | 2.46 | +1.17 | |||
| Justice Party of Denmark | 409 | 1.55 | -2.85 | |||
| Communist Party of Denmark | 251 | 0.95 | -1.39 | |||
| Total | 26,414 | |||||
| Source[31] | ||||||
General elections in the 1950s
| Parties | Vote | |||||
|---|---|---|---|---|---|---|
| Votes | % | + / - | ||||
| Social Democrats | 8,556 | 36.09 | -2.22 | |||
| Venstre | 8,135 | 34.31 | +2.23 | |||
| Conservatives | 3,255 | 13.73 | -0.68 | |||
| Social Liberals | 1,859 | 7.84 | -0.17 | |||
| Justice Party of Denmark | 1,042 | 4.40 | +1.90 | |||
| Communist Party of Denmark | 554 | 2.34 | -0.78 | |||
| Independent Party | 307 | 1.29 | -0.27 | |||
| Total | 23,708 | |||||
| Source[32] | ||||||
September 1953 Danish Folketing election
| Parties | Vote | |||||
|---|---|---|---|---|---|---|
| Votes | % | + / - | ||||
| Social Democrats | 8,230 | 38.31 | +1.28 | |||
| Venstre | 6,892 | 32.08 | +2.66 | |||
| Conservatives | 3,096 | 14.41 | -1.63 | |||
| Social Liberals | 1,720 | 8.01 | -1.07 | |||
| Communist Party of Denmark | 670 | 3.12 | -0.31 | |||
| Justice Party of Denmark | 538 | 2.50 | -2.02 | |||
| Independent Party | 335 | 1.56 | New | |||
| Total | 21,481 | |||||
| Source[33] | ||||||
April 1953 Danish Folketing election
| Parties | Vote | |||||
|---|---|---|---|---|---|---|
| Votes | % | + / - | ||||
| Social Democrats | 7,440 | 37.03 | -1.17 | |||
| Venstre | 5,910 | 29.42 | +0.47 | |||
| Conservatives | 3,223 | 16.04 | +0.07 | |||
| Social Liberals | 1,825 | 9.08 | +0.13 | |||
| Justice Party of Denmark | 909 | 4.52 | -0.54 | |||
| Communist Party of Denmark | 689 | 3.43 | +0.56 | |||
| Danish Unity | 94 | 0.47 | New | |||
| Total | 20,090 | |||||
| Source[34] | ||||||
1950 Danish Folketing election
| Parties | Vote | |||||
|---|---|---|---|---|---|---|
| Votes | % | + / - | ||||
| Social Democrats | 7,510 | 38.20 | -0.41 | |||
| Venstre | 5,691 | 28.95 | -5.40 | |||
| Conservatives | 3,140 | 15.97 | +4.78 | |||
| Social Liberals | 1,760 | 8.95 | +1.44 | |||
| Justice Party of Denmark | 994 | 5.06 | +2.28 | |||
| Communist Party of Denmark | 565 | 2.87 | -2.03 | |||
| Total | 19,660 | |||||
| Source[35] | ||||||
General elections in the 1940s
1947 Danish Folketing election
| Parties | Vote | |||||
|---|---|---|---|---|---|---|
| Votes | % | + / - | ||||
| Social Democrats | 7,545 | 38.61 | +5.98 | |||
| Venstre | 6,713 | 34.35 | +6.06 | |||
| Conservatives | 2,186 | 11.19 | -4.53 | |||
| Social Liberals | 1,467 | 7.51 | -4.05 | |||
| Communist Party of Denmark | 958 | 4.90 | -4.02 | |||
| Justice Party of Denmark | 543 | 2.78 | +1.76 | |||
| Danish Unity | 129 | 0.66 | -1.21 | |||
| Total | 19,541 | |||||
| Source[36] | ||||||
1945 Danish Folketing election
| Parties | Vote | |||||
|---|---|---|---|---|---|---|
| Votes | % | + / - | ||||
| Social Democrats | 6,226 | 32.63 | -8.88 | |||
| Venstre | 5,397 | 28.29 | +7.99 | |||
| Conservatives | 2,999 | 15.72 | -4.65 | |||
| Social Liberals | 2,206 | 11.56 | -0.94 | |||
| Communist Party of Denmark | 1,702 | 8.92 | New | |||
| Danish Unity | 356 | 1.87 | +0.10 | |||
| Justice Party of Denmark | 194 | 1.02 | -0.11 | |||
| Total | 19,080 | |||||
| Source[37] | ||||||
1943 Danish Folketing election
| Parties | Vote | |||||
|---|---|---|---|---|---|---|
| Votes | % | + / - | ||||
| Social Democrats | 7,645 | 41.51 | +2.03 | |||
| Conservatives | 3,751 | 20.37 | +2.17 | |||
| Venstre | 3,738 | 20.30 | -1.28 | |||
| Social Liberals | 2,302 | 12.50 | -1.12 | |||
| National Socialist Workers' Party of Denmark | 342 | 1.86 | +0.08 | |||
| Danish Unity | 326 | 1.77 | +1.51 | |||
| Justice Party of Denmark | 209 | 1.13 | -0.67 | |||
| Farmers' Party | 103 | 0.56 | -1.01 | |||
| Total | 18,416 | |||||
| Source[38] | ||||||
General elections in the 1930s
1939 Danish Folketing election
| Parties | Vote | |||||
|---|---|---|---|---|---|---|
| Votes | % | + / - | ||||
| Social Democrats | 6,200 | 39.48 | -4.06 | |||
| Venstre | 3,389 | 21.58 | +1.83 | |||
| Conservatives | 2,859 | 18.20 | -1.59 | |||
| Social Liberals | 2,139 | 13.62 | +2.15 | |||
| Justice Party of Denmark | 283 | 1.80 | -0.69 | |||
| National Socialist Workers' Party of Denmark | 279 | 1.78 | +1.27 | |||
| Farmers' Party | 246 | 1.57 | -0.15 | |||
| Communist Party of Denmark | 193 | 1.23 | +0.49 | |||
| National Cooperation | 77 | 0.49 | New | |||
| Danish Unity | 41 | 0.26 | New | |||
| Total | 15,706 | |||||
| Source[39] | ||||||
1935 Danish Folketing election
| Parties | Vote | |||||
|---|---|---|---|---|---|---|
| Votes | % | + / - | ||||
| Social Democrats | 6,454 | 43.54 | +3.20 | |||
| Conservatives | 2,934 | 19.79 | +0.67 | |||
| Venstre | 2,927 | 19.75 | -8.74 | |||
| Social Liberals | 1,700 | 11.47 | +1.48 | |||
| Justice Party of Denmark | 369 | 2.49 | +0.86 | |||
| Independent People's Party | 255 | 1.72 | New | |||
| Communist Party of Denmark | 109 | 0.74 | +0.31 | |||
| National Socialist Workers' Party of Denmark | 76 | 0.51 | New | |||
| Total | 14,824 | |||||
| Source[40] | ||||||
1932 Danish Folketing election
| Parties | Vote | |||||
|---|---|---|---|---|---|---|
| Votes | % | + / - | ||||
| Social Democrats | 5,575 | 40.34 | +3.28 | |||
| Venstre | 3,937 | 28.49 | -3.14 | |||
| Conservatives | 2,643 | 19.12 | +2.32 | |||
| Social Liberals | 1,380 | 9.99 | -3.63 | |||
| Justice Party of Denmark | 225 | 1.63 | +0.74 | |||
| Communist Party of Denmark | 60 | 0.43 | New | |||
| Total | 13,820 | |||||
| Source[41] | ||||||
General elections in the 1920s
1929 Danish Folketing election
| Parties | Vote | |||||
|---|---|---|---|---|---|---|
| Votes | % | + / - | ||||
| Social Democrats | 4,818 | 37.06 | +10.13 | |||
| Venstre | 4,112 | 31.63 | +6.44 | |||
| Conservatives | 2,184 | 16.80 | -1.33 | |||
| Social Liberals | 1,771 | 13.62 | -4.51 | |||
| Justice Party of Denmark | 116 | 0.89 | +0.24 | |||
| Total | 13,001 | |||||
| Source[42] | ||||||
1926 Danish Folketing election
| Parties | Vote | |||||
|---|---|---|---|---|---|---|
| Votes | % | + / - | ||||
| Social Democrats | 3,959 | 26.93 | -6.99 | |||
| Social Liberals | 2,665 | 18.13 | +3.34 | |||
| Conservatives | 2,665 | 18.13 | -0.64 | |||
| Conservatives | 2,665 | 18.13 | -0.64 | |||
| Independence Party | 1,611 | 10.96 | New | |||
| Justice Party of Denmark | 96 | 0.65 | New | |||
| Total | 14,699 | |||||
| Source[43] | ||||||
1924 Danish Folketing election
| Parties | Vote | |||||
|---|---|---|---|---|---|---|
| Votes | % | + / - | ||||
| Social Democrats | 3,860 | 33.92 | +3.11 | |||
| Venstre | 3,437 | 30.20 | -8.04 | |||
| Conservatives | 2,136 | 18.77 | +2.68 | |||
| Social Liberals | 1,683 | 14.79 | +2.82 | |||
| Farmer Party | 214 | 1.88 | New | |||
| Communist Party of Denmark | 51 | 0.45 | New | |||
| Total | 11,381 | |||||
| Source[44] | ||||||
September 1920 Danish Folketing election
| Parties | Vote | |||||
|---|---|---|---|---|---|---|
| Votes | % | + / - | ||||
| Venstre | 4,065 | 38.24 | -3.93 | |||
| Social Democrats | 3,275 | 30.81 | +2.81 | |||
| Conservatives | 1,711 | 16.09 | -0.88 | |||
| Social Liberals | 1,272 | 11.97 | +1.54 | |||
| Industry Party | 179 | 1.68 | +0.11 | |||
| Danish Left Socialist Party | 66 | 0.62 | New | |||
| Total | 10,631 | |||||
| Source[45] | ||||||
July 1920 Danish Folketing election
| Parties | Vote | |||||
|---|---|---|---|---|---|---|
| Votes | % | + / - | ||||
| Venstre | 3,832 | 42.17 | +2.75 | |||
| Social Democrats | 2,545 | 28.00 | -0.43 | |||
| Conservatives | 1,542 | 16.97 | -1.39 | |||
| Social Liberals | 948 | 10.43 | -2.08 | |||
| Industry Party | 143 | 1.57 | +0.60 | |||
| Daniel Nielsen | 62 | 0.68 | New | |||
| Total | 9,088 | |||||
| Source[46] | ||||||
April 1920 Danish Folketing election
| Parties | Vote | |||||
|---|---|---|---|---|---|---|
| Votes | % | |||||
| Venstre | 3,760 | 39.42 | ||||
| Social Democrats | 2,712 | 28.43 | ||||
| Conservatives | 1,751 | 18.36 | ||||
| Social Liberals | 1,193 | 12.51 | ||||
| Industry Party | 93 | 0.97 | ||||
| Elias S. Nielsen | 30 | 0.31 | ||||
| Total | 9,539 | |||||
| Source[47] | ||||||
European Parliament elections results
2019 European Parliament election in Denmark
| Parties | Vote | |||||
|---|---|---|---|---|---|---|
| Votes | % | + / - | ||||
| Venstre | 11,500 | 24.50 | +6.13 | |||
| Social Democrats | 8,698 | 18.53 | +2.08 | |||
| Green Left | 6,305 | 13.43 | +2.03 | |||
| Danish People's Party | 5,068 | 10.80 | -16.18 | |||
| Social Liberals | 5,029 | 10.72 | +3.79 | |||
| Conservatives | 3,635 | 7.75 | -1.09 | |||
| Red–Green Alliance | 2,339 | 4.98 | New | |||
| People's Movement against the EU | 1,835 | 3.91 | -3.72 | |||
| The Alternative | 1,538 | 3.28 | New | |||
| Liberal Alliance | 986 | 2.10 | -1.31 | |||
| Total | 46,933 | |||||
| Source[48] | ||||||
2014 European Parliament election in Denmark
| Parties | Vote | |||||
|---|---|---|---|---|---|---|
| Votes | % | + / - | ||||
| Danish People's Party | 10,584 | 26.98 | +11.67 | |||
| Venstre | 7,204 | 18.37 | -3.39 | |||
| Social Democrats | 6,452 | 16.45 | -1.61 | |||
| Green Left | 4,470 | 11.40 | -4.65 | |||
| Conservatives | 3,466 | 8.84 | -4.44 | |||
| People's Movement against the EU | 2,993 | 7.63 | -0.51 | |||
| Social Liberals | 2,719 | 6.93 | +2.47 | |||
| Liberal Alliance | 1,337 | 3.41 | +2.79 | |||
| Total | 39,225 | |||||
| Source[49] | ||||||
2009 European Parliament election in Denmark
| Parties | Vote | |||||
|---|---|---|---|---|---|---|
| Votes | % | + / - | ||||
| Venstre | 8,633 | 21.76 | +3.80 | |||
| Social Democrats | 7,164 | 18.06 | -9.19 | |||
| Green Left | 6,366 | 16.05 | +6.62 | |||
| Danish People's Party | 6,074 | 15.31 | +9.07 | |||
| Conservatives | 5,268 | 13.28 | -2.66 | |||
| People's Movement against the EU | 3,230 | 8.14 | +2.58 | |||
| Social Liberals | 1,769 | 4.46 | -3.30 | |||
| June Movement | 920 | 2.32 | -6.39 | |||
| Liberal Alliance | 246 | 0.62 | New | |||
| Total | 39,670 | |||||
| Source[50] | ||||||
2004 European Parliament election in Denmark
| Parties | Vote | |||||
|---|---|---|---|---|---|---|
| Votes | % | + / - | ||||
| Social Democrats | 12,263 | 27.25 | +15.96 | |||
| Venstre | 8,082 | 17.96 | -7.44 | |||
| Conservatives | 7,175 | 15.94 | +5.49 | |||
| Green Left | 4,242 | 9.43 | +0.82 | |||
| June Movement | 3,921 | 8.71 | -6.61 | |||
| Social Liberals | 3,494 | 7.76 | -2.40 | |||
| Danish People's Party | 2,807 | 6.24 | +1.16 | |||
| People's Movement against the EU | 2,503 | 5.56 | -2.20 | |||
| Christian Democrats | 512 | 1.14 | -0.49 | |||
| Total | 44,999 | |||||
| Source[51] | ||||||
1999 European Parliament election in Denmark
| Parties | Vote | |||||
|---|---|---|---|---|---|---|
| Votes | % | + / - | ||||
| Venstre | 11,608 | 25.40 | +6.61 | |||
| June Movement | 7,002 | 15.32 | +0.28 | |||
| Social Democrats | 5,159 | 11.29 | -0.25 | |||
| Conservatives | 4,776 | 10.45 | -10.84 | |||
| Social Liberals | 4,645 | 10.16 | -0.34 | |||
| Green Left | 3,934 | 8.61 | -0.87 | |||
| People's Movement against the EU | 3,547 | 7.76 | -1.26 | |||
| Danish People's Party | 2,322 | 5.08 | New | |||
| Centre Democrats | 1,968 | 4.31 | +3.09 | |||
| Christian Democrats | 743 | 1.63 | +0.69 | |||
| Progress Party | 148 | 0.32 | -1.85 | |||
| Total | 45,704 | |||||
| Source[52] | ||||||
1994 European Parliament election in Denmark
| Parties | Vote | |||||
|---|---|---|---|---|---|---|
| Votes | % | + / - | ||||
| Conservatives | 10,029 | 21.29 | +4.30 | |||
| Venstre | 8,848 | 18.79 | +2.52 | |||
| June Movement | 7,085 | 15.04 | New | |||
| Social Democrats | 5,435 | 11.54 | -6.04 | |||
| Social Liberals | 4,944 | 10.50 | +7.43 | |||
| Green Left | 4,463 | 9.48 | +0.08 | |||
| People's Movement against the EU | 4,250 | 9.02 | -11.02 | |||
| Progress Party | 1,022 | 2.17 | -1.86 | |||
| Centre Democrats | 576 | 1.22 | -9.42 | |||
| Christian Democrats | 445 | 0.94 | -1.05 | |||
| Total | 47,097 | |||||
| Source[53] | ||||||
1989 European Parliament election in Denmark
| Parties | Vote | |||||
|---|---|---|---|---|---|---|
| Votes | % | + / - | ||||
| People's Movement against the EU | 7,575 | 20.04 | -3.19 | |||
| Social Democrats | 6,647 | 17.58 | +3.54 | |||
| Conservatives | 6,423 | 16.99 | -9.47 | |||
| Venstre | 6,152 | 16.27 | +6.31 | |||
| Centre Democrats | 4,022 | 10.64 | +2.87 | |||
| Green Left | 3,555 | 9.40 | +0.36 | |||
| Progress Party | 1,522 | 4.03 | +1.15 | |||
| Social Liberals | 1,159 | 3.07 | -0.38 | |||
| Christian Democrats | 751 | 1.99 | -0.01 | |||
| Total | 37,806 | |||||
| Source[54] | ||||||
1984 European Parliament election in Denmark
| Parties | Vote | |||||
|---|---|---|---|---|---|---|
| Votes | % | |||||
| Conservatives | 10,662 | 26.46 | ||||
| People's Movement against the EU | 9,362 | 23.23 | ||||
| Social Democrats | 5,657 | 14.04 | ||||
| Venstre | 4,015 | 9.96 | ||||
| Green Left | 3,644 | 9.04 | ||||
| Centre Democrats | 3,130 | 7.77 | ||||
| Social Liberals | 1,389 | 3.45 | ||||
| Progress Party | 1,161 | 2.88 | ||||
| Christian Democrats | 806 | 2.00 | ||||
| Left Socialists | 473 | 1.17 | ||||
| Total | 40,299 | |||||
| Source[55] | ||||||
Referendums
2022 Danish European Union opt-out referendum[56]
| Option | Votes | % |
|---|---|---|
| ✓ YES | 32,921 | 68.22 |
| X NO | 15,334 | 31.78 |
2015 Danish European Union opt-out referendum[57]
| Option | Votes | % |
|---|---|---|
| X NO | 24,883 | 50.64 |
| ✓ YES | 24,256 | 49.36 |
2014 Danish Unified Patent Court membership referendum[58]
| Option | Votes | % |
|---|---|---|
| ✓ YES | 25,032 | 65.26 |
| X NO | 13,327 | 34.74 |
2009 Danish Act of Succession referendum[59]
| Option | Votes | % |
|---|---|---|
| ✓ YES | 31,431 | 85.73 |
| X NO | 5,230 | 14.27 |
2000 Danish euro referendum[60]
| Option | Votes | % |
|---|---|---|
| ✓ YES | 39,240 | 52.95 |
| X NO | 34,865 | 47.05 |
1998 Danish Amsterdam Treaty referendum[61]
| Option | Votes | % |
|---|---|---|
| ✓ YES | 39,021 | 59.72 |
| X NO | 26,315 | 40.28 |
1993 Danish Maastricht Treaty referendum[62]
| Option | Votes | % |
|---|---|---|
| ✓ YES | 43,720 | 61.64 |
| X NO | 27,211 | 38.36 |
1992 Danish Maastricht Treaty referendum[63]
| Option | Votes | % |
|---|---|---|
| ✓ YES | 37,642 | 55.14 |
| X NO | 30,628 | 44.86 |
1986 Danish Single European Act referendum[64]
| Option | Votes | % |
|---|---|---|
| ✓ YES | 34,591 | 58.71 |
| X NO | 24,324 | 41.29 |
1972 Danish European Communities membership referendum[65]
| Option | Votes | % |
|---|---|---|
| ✓ YES | 48,000 | 60.05 |
| X NO | 31,931 | 39.95 |
1953 Danish constitutional and electoral age referendum[66]
| Option | Votes | % |
|---|---|---|
| ✓ YES | 12,662 | 81.82 |
| X NO | 2,814 | 18.18 |
| 23 years | 9,603 | 59.69 |
| 21 years | 6,485 | 40.31 |
1939 Danish constitutional referendum[67]
| Option | Votes | % |
|---|---|---|
| ✓ YES | 7,891 | 90.67 |
| X NO | 812 | 9.33 |
References
- "Hillerødkredsen". kmdvalg.dk (in Danish). Retrieved 2023-06-08.
- "Beretning om Forhandlingerne paa Rigsdagen". Rigsdagstidende. II: Spalte 3892 ff.
- "Nye valgkredse fordeler stemmerne anderledes". dr.dk (in Danish). Retrieved 2023-06-08.
- "Beretning om nye valgkredse som følge af kommunalreformen" (in Danish). Retrieved 2023-06-08.
- "Det danske valgsystem: Valg til Folketinget". valg.im (in Danish). Retrieved 2023-06-08.
- "23 Hillerød". dataforsyningen.dk (in Danish). Retrieved 2023-06-08.
- "Beretning om Forhandlingerne paa Rigsdagen". Rigsdagstidende. II: Spalte 3892 ff.
- "Valgresultater fra tidligere valg:". kmdvalg (in Danish). Retrieved 2023-06-08.
- "FOLKETINGSVALG TIRSDAG 1. NOVEMBER 2022". valg.im (in Danish). Retrieved 2023-06-27.
- "FOLKETINGSVALG ONSDAG 5. JUNI 2019". valg.im (in Danish). Retrieved 2023-06-27.
- "FOLKETINGSVALG TORSDAG 18. JUNI 2015". valg.im (in Danish). Retrieved 2023-06-27.
- "FOLKETINGSVALG TORSDAG 15. SEPTEMBER 2011". valg.im (in Danish). Retrieved 2023-06-27.
- "Folketingsvalget den 13. november 2007". valg.im (in Danish). Retrieved 2023-06-27.
- "valg2005.book" (PDF). valg.im (in Danish). Retrieved 2023-06-27.
- "BMTABEL" (PDF). valg.im (in Danish). Retrieved 2023-06-27.
- "VALG98" (PDF). valg.im (in Danish). Retrieved 2023-06-27.
- "VALG94" (PDF). valg.im (in Danish). Retrieved 2023-06-27.
- "VALG90" (PDF). valg.im (in Danish). Retrieved 2023-06-27.
- "Folketingsvalget den 10. maj 1988". valg.im (in Danish). Retrieved 2023-06-27.
- "Folketingsvalget den 8.september 1987". dst.dk (in Danish). Retrieved 2023-06-27.
- "Folketingsvalget den 10. januar 1984". dst.dk (in Danish). Retrieved 2023-06-27.
- "Folketingsvalget den 8. december 1981". dst.dk (in Danish). Retrieved 2023-06-27.
- "Folketingsvalget den 23. oktober 1979". dst.dk (in Danish). Retrieved 2023-06-27.
- "Folketingsvalget den 15. februar 1977". dst.dk (in Danish). Retrieved 2023-06-27.
- "Folketingsvalget den 9. januar 1975". dst.dk (in Danish). Retrieved 2023-06-27.
- "Folketingsvalget den 4. december 1973". dst.dk (in Danish). Retrieved 2023-06-27.
- "Folketingsvalget den 21. september 1971 samt folkeafstemningen". dst.dk (in Danish). Retrieved 2023-06-27.
- "Folketingsvalget den 23. januar 1968". dst.dk (in Danish). Retrieved 2023-06-27.
- "Folketingsvalget den 22. november 1966". dst.dk (in Danish). Retrieved 2023-06-27.
- "Folketingsvalget den 22. september 1964". dst.dk (in Danish). Retrieved 2023-06-27.
- "Folketingsvalget den 15. november 1960". dst.dk (in Danish). Retrieved 2023-06-27.
- "Folketingsvalget den 14. maj 1957". dst.dk (in Danish). Retrieved 2023-06-27.
- "Folketingsvalget den 22. september 1953". dst.dk (in Danish). Retrieved 2023-06-27.
- "Rigsdagsvalgene og folkeafstemningerne i april og maj 1953". dst.dk (in Danish). Retrieved 2023-06-27.
- "Folketingsvalget den 5. september 1950". dst.dk (in Danish). Retrieved 2023-06-27.
- "Folketingsvalget den 28. oktober 1947". dst.dk (in Danish). Retrieved 2023-06-27.
- "Rigsdagsvalgene i oktober og november 1945". dst.dk (in Danish). Retrieved 2023-06-27.
- "Rigsdagsvalgene i marts og april 1943". dst.dk (in Danish). Retrieved 2023-06-27.
- "Rigsdagsvalgene og Folkeafstemningen i april og maj 1939". dst.dk (in Danish). Retrieved 2023-06-27.
- "Folketingsvalget den 22. oktober 1935". dst.dk (in Danish). Retrieved 2023-06-27.
- "Folketingsvalget den 16. november 1932". dst.dk (in Danish). Retrieved 2023-06-27.
- "Folketingsvalget den 24. april 1929". dst.dk (in Danish). Retrieved 2023-06-27.
- "Folketingsvalget den 2. december 1926". dst.dk (in Danish). Retrieved 2023-06-27.
- "Folketingsvalget den 11. april 1924". dst.dk (in Danish). Retrieved 2023-06-27.
- "Rigsdagsvalgene september-oktober 1920". dst.dk (in Danish). Retrieved 2023-06-27.
- "Rigsdagsvalgene juli-august 1920". dst.dk (in Danish). Retrieved 2023-06-27.
- "Folketingsvalget den 26. april 1920". dst.dk (in Danish). Retrieved 2023-06-27.
- "EUROPA-PARLAMENTSVALG SØNDAG 26. MAJ 2019". dst.dk (in Danish). Retrieved 2023-07-01.
- "EUROPA-PARLAMENTSVALG SØNDAG 25. MAJ 2014". dst.dk (in Danish). Retrieved 2023-07-01.
- "EUROPA-PARLAMENTSVALG SØNDAG 7. JUNI 2009". dst.dk (in Danish). Retrieved 2023-07-01.
- "EUROPA-PARLAMENTSVALGET DEN 13. JUNI 2004" (PDF). im.dk (in Danish). Retrieved 2023-07-01.
- "VALGET TIL EUROPA-PARLAMENTET DEN 10. JUNI 1999" (PDF). im.dk (in Danish). Retrieved 2023-07-01.
- "VALGET TIL EUROPA-PARLAMENTET DEN 9. JUNI 1994" (PDF). im.dk (in Danish). Retrieved 2023-07-01.
- "Valget til Europa-parlamentet den 15. juni 1989". dst.dk (in Danish). Retrieved 2023-07-01.
- "Valget til Europa-Parlamentet den 14. juni 1984". dst.dk (in Danish). Retrieved 2023-07-01.
- "FOLKEAFSTEMNING ONSDAG 1. JUNI 2022". dst.dk (in Danish). Retrieved 2023-07-05.
- "FOLKEAFSTEMNING TORSDAG 3. DECEMBER 2015". dst.dk (in Danish). Retrieved 2023-07-05.
- "FOLKEAFSTEMNING SØNDAG 25. MAJ 2014". dst.dk (in Danish). Retrieved 2023-07-05.
- "FOLKEAFSTEMNING SØNDAG 7. JUNI 2009". dst.dk (in Danish). Retrieved 2023-07-05.
- "FOLKEAFSTEMNINGEN DEN 28. SEPTEMBER 2000 OM DANMARKS DELTAGELSE I DEN FÆLLES VALUTA" (PDF). valg.im (in Danish). Retrieved 2023-07-05.
- "FOLKEAFSTEMNINGEN DEN 28. MAJ 1998OM DANMARKS TILTRÆDELSE AF AMSTERDAMTRAKTATEN" (PDF). valg.im (in Danish). Retrieved 2023-07-05.
- "FOLKEAFSTEMNINGEN DEN 18. MAJ 1993 OM DANMARKS TILTRÆDELSE AF EDINBURGH-AFGØRELSEN OG MAASTRICHT-TRAKTATEN". dst.dk (in Danish). Retrieved 2023-07-05.
- "Folkeafstemningen den 1. juni 1992 om Danmarks tiltrædelse af traktaten om Den Europæiske Union". dst.dk (in Danish). Retrieved 2023-07-05.
- "Vejledende folkeafstemning torsdag den 27. februar 1986 om Danmarks tiltrædelse af EF- pakken". dst.dk (in Danish). Retrieved 2023-07-05.
- "Folkeafstemningen om Danmarks tiltrædelse af De europæiske Fælleskaber 2. oktober 1972". dst.dk (in Danish). Retrieved 2023-07-05.
- "Publikationsfortegnelse vedrørende Folkeafstemninger". dst.dk (in Danish). Retrieved 2023-07-05.
- "Publikationsfortegnelse vedrørende Folkeafstemninger". dst.dk (in Danish). Retrieved 2023-07-05.