Hitchin (UK Parliament constituency)
Hitchin was a parliamentary constituency in Hertfordshire which returned one Member of Parliament (MP) to the House of Commons of the Parliament of the United Kingdom from 1885 until it was abolished for the 1983 general election.
| Hitchin | |
|---|---|
| Former County constituency for the House of Commons | |
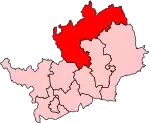
 Hitchin in Hertfordshire, showing boundaries used from 1974-1983 | |
| 1885–1983 | |
| Seats | one |
| Created from | Hertfordshire |
| Replaced by | North Hertfordshire, Stevenage[1] |
Further to the completion of the 2023 Periodic Review of Westminster constituencies, the seat will be re-established for the next general election.[2]
Contents of re-established seat
The re-established constituency will comprise the following areas:
- The parts of the, to be abolished, constituency of Hitchin and Harpenden in the District of North Hertfordshire, including the town of Hitchin
- The Central Bedfordshire wards of Arlesey, Shefford, and Stotfold and Langford, transferred partly from North East Bedfordshire and partly from Mid Bedforshire
Boundaries and boundary changes
1885–1918
- The Sessional Divisions of Aldbury (except the parishes of Great Hadham and Little Hadham), Buntingford, Hitchin, Odsey, Stevenage, and Welwyn; and
- The parish of Braughing.[3]
The constituency was established by the Redistribution of Seats Act 1885 (which followed on from the Third Reform Act) as one of four Divisions of the abolished three-member Parliamentary County of Hertfordshire, and was formally named as the Northern or Hitchin Division of Hertfordshire. It included the towns/villages of Hitchin, Stevenage, Welwyn, Baldock and Royston.
1918–1945
- The Urban Districts of Baldock, Hitchin, Royston, and Stevenage;
- The Rural Districts of Ashwell, Buntingford, Hitchin, and Welwyn; and
- The Rural District of Hertford parishes of Aston, Bennington, Datchworth, Sacombe, Walkern, and Watton-at-Stone.[4]
Minor changes only to reflect local authority boundaries.
1945–1950
- The Urban Districts of Baldock, Hitchin, Letchworth, Royston, and Stevenage;
- The Rural Districts of Hitchin, and Welwyn; and
- Parts of the Rural Districts of Braughing and Hertford.[5]
The constituency had included a part of the Urban District of Welwyn Garden City, which had been formed as a separate local authority in 1927, and this was now transferred to St Albans. Other nominal changes as a result of the reorganisation of local authorities.
1950–1955
- The Urban Districts of Baldock, Hitchin, Letchworth, Royston, and Stevenage;
- The Rural District of Hitchin:
- The Rural District of Braughing parishes of Anstey, Ardeley, Aspenden, Broadfield, Buckland, Buntingford, Cottered, Hormead, Meesden, Throcking, Westmilll, and Wyddiall; and
- The Rural District of Hertford parishes of Aston, Bennington, Datchworth, Sacombe, Walkern, and Watton-at-Stone.[6]
The Rural District of Welwyn was transferred to St Albans.
1955–1974
- The Urban Districts of Baldock, Hitchin, Letchworth, Royston, and Stevenage; and
- The Rural District of Hitchin.[5]
The part of the Rural District of Braughing was transferred to the new constituency of East Hertfordshire, and the part of the Rural District of Hertford was transferred to Hertford.
1974–1983
- The Urban Districts of Baldock, Hitchin, Letchworth, and Royston; and
- The Rural District of Hitchin.[5][7]
The Urban District of Stevenage formed the majority of the new County Constituency of Hertford and Stevenage.
The constituency was abolished for the 1983 general election and was replaced by the new constituency of North Hertfordshire, with the exception of a small part in the south-east which was included in the new constituency of Stevenage (Codicote and Knebworth).
Members of Parliament
Notes:-
- a Dimsdale was a Baron of the Russian Empire.
- b Cecil associated himself with the non-coalition wing of the Conservative Party, at some point in the 1918-1922 Parliament.
Elections
Elections in the 1880s
| Party | Candidate | Votes | % | ±% | |
|---|---|---|---|---|---|
| Conservative | Robert Dimsdale | 4,419 | 60.6 | ||
| Liberal | Henry George Fordham | 2,869 | 39.4 | ||
| Majority | 1,550 | 21.2 | |||
| Turnout | 7,288 | 81.0 | |||
| Registered electors | 8,996 | ||||
| Conservative win (new seat) | |||||
| Party | Candidate | Votes | % | ±% | |
|---|---|---|---|---|---|
| Conservative | Robert Dimsdale | Unopposed | |||
| Conservative hold | |||||
Elections in the 1890s
| Party | Candidate | Votes | % | ±% | |
|---|---|---|---|---|---|
| Conservative | George Bickersteth Hudson | 4,187 | 60.5 | N/A | |
| Liberal | John Wattridge | 2,728 | 39.5 | New | |
| Majority | 1,459 | 21.0 | N/A | ||
| Turnout | 6,915 | 77.0 | N/A | ||
| Registered electors | 8,982 | ||||
| Conservative hold | Swing | N/A | |||
| Party | Candidate | Votes | % | ±% | |
|---|---|---|---|---|---|
| Conservative | George Bickersteth Hudson | Unopposed | |||
| Conservative hold | |||||
Elections in the 1900s
| Party | Candidate | Votes | % | ±% | |
|---|---|---|---|---|---|
| Conservative | George Bickersteth Hudson | Unopposed | |||
| Conservative hold | |||||
| Party | Candidate | Votes | % | ±% | |
|---|---|---|---|---|---|
| Liberal | Julius Bertram | 4,157 | 50.5 | New | |
| Conservative | J J W Miller | 4,081 | 49.5 | N/A | |
| Majority | 76 | 1.0 | N/A | ||
| Turnout | 8,238 | 83.9 | N/A | ||
| Registered electors | 9,820 | ||||
| Liberal gain from Conservative | Swing | N/A | |||
Elections in the 1910s
| Party | Candidate | Votes | % | ±% | |
|---|---|---|---|---|---|
| Conservative | Alfred Hillier | 5,761 | 59.8 | +10.3 | |
| Liberal | Julius Bertram | 3,877 | 40.2 | −10.3 | |
| Majority | 1,884 | 19.6 | N/A | ||
| Turnout | 9,638 | 88.5 | +4.6 | ||
| Conservative gain from Liberal | Swing | +10.3 | |||
| Party | Candidate | Votes | % | ±% | |
|---|---|---|---|---|---|
| Conservative | Alfred Hillier | 5,233 | 57.0 | −2.8 | |
| Liberal | Thomas Tylston Greg | 3,942 | 43.0 | +2.8 | |
| Majority | 1,291 | 14.0 | −5.6 | ||
| Turnout | 9,175 | 84.3 | −4.2 | ||
| Conservative hold | Swing | −2.8 | |||
| Party | Candidate | Votes | % | ±% | |
|---|---|---|---|---|---|
| Conservative | Robert Cecil | 5,542 | 58.6 | +1.6 | |
| Liberal | Thomas Tylston Greg | 3,909 | 41.4 | −1.6 | |
| Majority | 1,633 | 17.2 | +3.2 | ||
| Turnout | 9,451 | 84.8 | +0.5 | ||
| Conservative hold | Swing | +1.6 | |||
General Election 1914–15:
Another General Election was required to take place before the end of 1915. The political parties had been making preparations for an election to take place and by the July 1914, the following candidates had been selected;
- Unionist: Robert Cecil
- Liberal:

| Party | Candidate | Votes | % | ±% | |
|---|---|---|---|---|---|
| C | Unionist | Robert Cecil | 9,828 | 60.6 | +3.6 |
| Labour | Robert Green | 5,661 | 34.9 | New | |
| NFDDSS | George Humm | 722 | 4.5 | New | |
| Majority | 4,167 | 25.7 | +11.7 | ||
| Turnout | 16,211 | 54.4 | −29.9 | ||
| Registered electors | 29,820 | ||||
| Unionist hold | Swing | N/A | |||
| C indicates candidate endorsed by the coalition government. | |||||
Elections in the 1920s
| Party | Candidate | Votes | % | ±% | |
|---|---|---|---|---|---|
| Unionist | Robert Cecil | 13,124 | 62.0 | +1.4 | |
| Labour | Skene Mackay | 8,049 | 38.0 | +3.1 | |
| Majority | 5,075 | 24.0 | −1.7 | ||
| Turnout | 21,173 | 66.2 | +7.8 | ||
| Registered electors | 32,005 | ||||
| Unionist hold | Swing | −0.9 | |||
| Party | Candidate | Votes | % | ±% | |
|---|---|---|---|---|---|
| Unionist | Guy Kindersley | 11,157 | 49.7 | −12.3 | |
| Labour | Skene Mackay | 5,913 | 26.3 | −11.7 | |
| Liberal | Dugald Macfadyen | 5,390 | 24.0 | New | |
| Majority | 5,244 | 23.4 | −0.6 | ||
| Turnout | 22,460 | 67.7 | +1.5 | ||
| Registered electors | 33,197 | ||||
| Unionist hold | Swing | −0.3 | |||
| Party | Candidate | Votes | % | ±% | |
|---|---|---|---|---|---|
| Unionist | Guy Kindersley | 14,019 | 59.2 | +9.5 | |
| Labour | Julian Athelstan Tayler | 5,773 | 24.4 | −1.9 | |
| Liberal | Dugald Macfadyen | 3,881 | 16.4 | −7.6 | |
| Majority | 8,246 | 34.8 | +11.4 | ||
| Turnout | 23,673 | 69.5 | +1.8 | ||
| Registered electors | 34,060 | ||||
| Unionist hold | Swing | +5.7 | |||
| Party | Candidate | Votes | % | ±% | |
|---|---|---|---|---|---|
| Unionist | Guy Kindersley | 14,786 | 44.8 | −14.4 | |
| Liberal | Enid Lapthorn | 9,325 | 28.3 | +3.9 | |
| Labour | Richard Gifford | 8,880 | 26.9 | +10.5 | |
| Majority | 5,461 | 16.5 | −18.3 | ||
| Turnout | 32,991 | 73.4 | +3.9 | ||
| Registered electors | 44,967 | ||||
| Unionist hold | Swing | −9.2 | |||
Elections in the 1930s
| Party | Candidate | Votes | % | ±% | |
|---|---|---|---|---|---|
| Conservative | Antony Bulwer-Lytton | 25,841 | 75.7 | +30.9 | |
| Labour | Dermot Freyer | 8,312 | 24.3 | −2.6 | |
| Majority | 17,529 | 51.4 | +34.9 | ||
| Turnout | 34,153 | 71.1 | −2.3 | ||
| Conservative hold | Swing | ||||

| Party | Candidate | Votes | % | ±% | |
|---|---|---|---|---|---|
| Conservative | Arnold Wilson | 14,569 | 58.4 | −17.3 | |
| Labour | William Bennett | 10,362 | 41.6 | +17.3 | |
| Majority | 4,207 | 16.8 | −34.6 | ||
| Turnout | 24,931 | 51.3 | −19.8 | ||
| Conservative hold | Swing | ||||
| Party | Candidate | Votes | % | ±% | |
|---|---|---|---|---|---|
| Conservative | Arnold Wilson | 21,452 | 63.34 | ||
| Labour | George Lindgren | 12,417 | 36.66 | ||
| Majority | 9,035 | 26.68 | |||
| Turnout | 33,869 | 66.44 | |||
| Conservative hold | Swing | ||||
Elections in the 1940s
General Election 1939–40: Another General Election was required to take place before the end of 1940. The political parties had been making preparations for an election to take place from 1939 and by the end of this year, the following candidates had been selected;
- Conservative: Arnold Wilson
- Labour: George Lindgren
| Party | Candidate | Votes | % | ±% | |
|---|---|---|---|---|---|
| Conservative | Seymour Berry | Unopposed | N/A | N/A | |
| Conservative hold | Swing | N/A | |||
| Party | Candidate | Votes | % | ±% | |
|---|---|---|---|---|---|
| Labour | Philip Jones | 20,779 | 42.64 | ||
| Conservative | Seymour Berry | 20,433 | 41.93 | ||
| Liberal | Thomas Darling | 7,515 | 15.42 | New | |
| Majority | 346 | 0.71 | N/A | ||
| Turnout | 48,727 | 72.44 | |||
| Labour gain from Conservative | Swing | ||||
Elections in the 1950s
| Party | Candidate | Votes | % | ±% | |
|---|---|---|---|---|---|
| Conservative | Nigel Fisher | 23,580 | 45.11 | ||
| Labour | Philip Jones | 21,829 | 41.76 | ||
| Liberal | Frank Haigh | 6,863 | 13.13 | ||
| Majority | 1,751 | 3.35 | n/a | ||
| Turnout | 52,272 | 85.78 | |||
| Conservative gain from Labour | Swing | ||||
| Party | Candidate | Votes | % | ±% | |
|---|---|---|---|---|---|
| Conservative | Nigel Fisher | 27,719 | 52.64 | ||
| Labour | Peter Benenson | 24,941 | 47.36 | ||
| Majority | 2,778 | 5.28 | |||
| Turnout | 52,660 | 84.98 | |||
| Conservative hold | Swing | ||||
| Party | Candidate | Votes | % | ±% | |
|---|---|---|---|---|---|
| Conservative | Martin Maddan | 26,371 | 50.93 | ||
| Labour | Peter Benenson | 25,406 | 49.07 | ||
| Majority | 965 | 1.86 | |||
| Turnout | 51,777 | 83.17 | |||
| Conservative hold | Swing | ||||
| Party | Candidate | Votes | % | ±% | |
|---|---|---|---|---|---|
| Conservative | Martin Maddan | 30,193 | 46.82 | ||
| Labour | Peter Benenson | 25,818 | 40.03 | ||
| Liberal | Robert Glenton | 8,481 | 13.15 | New | |
| Majority | 4,375 | 6.79 | |||
| Turnout | 64,492 | 85.43 | |||
| Conservative hold | Swing | ||||
Elections in the 1960s
| Party | Candidate | Votes | % | ±% | |
|---|---|---|---|---|---|
| Labour | Shirley Williams | 34,034 | 45.84 | ||
| Conservative | Martin Maddan | 30,649 | 41.28 | ||
| Liberal | Elma Dangerfield | 9,564 | 12.88 | ||
| Majority | 3,385 | 4.56 | N/A | ||
| Turnout | 74,247 | 84.54 | |||
| Labour gain from Conservative | Swing | ||||
| Party | Candidate | Votes | % | ±% | |
|---|---|---|---|---|---|
| Labour | Shirley Williams | 42,233 | 56.52 | ||
| Conservative | John Stokes | 32,483 | 43.48 | ||
| Majority | 9,750 | 13.04 | |||
| Turnout | 74,716 | 65.54 | |||
| Labour hold | Swing | ||||
Elections in the 1970s
| Party | Candidate | Votes | % | ±% | |
|---|---|---|---|---|---|
| Labour | Shirley Williams | 40,932 | 48.53 | ||
| Conservative | Richard Luce | 37,258 | 44.18 | ||
| Liberal | Thomas Willis | 6,148 | 7.29 | New | |
| Majority | 3,674 | 4.35 | |||
| Turnout | 84,338 | 76.88 | |||
| Labour hold | Swing | ||||
| Party | Candidate | Votes | % | ±% | |
|---|---|---|---|---|---|
| Conservative | Ian Stewart | 27,222 | 44.11 | ||
| Labour | Ann Mallalieu | 23,204 | 37.60 | ||
| Liberal | D Beavan | 10,824 | 17.54 | ||
| Independent | P Bianchi | 467 | 0.76 | New | |
| Majority | 4,018 | 6.51 | N/A | ||
| Turnout | 61,717 | 85.57 | |||
| Conservative gain from Labour | Swing | ||||
| Party | Candidate | Votes | % | ±% | |
|---|---|---|---|---|---|
| Conservative | Ian Stewart | 25,842 | 44.59 | ||
| Labour | Ann Mallalieu | 22,656 | 39.09 | ||
| Liberal | Eric Dix | 9,454 | 16.31 | ||
| Majority | 3,186 | 5.50 | |||
| Turnout | 57,952 | 79.59 | |||
| Conservative hold | Swing | ||||
| Party | Candidate | Votes | % | ±% | |
|---|---|---|---|---|---|
| Conservative | Ian Stewart | 33,169 | 52.54 | ||
| Labour | Denis O'Flynn | 19,940 | 31.59 | ||
| Liberal | Eric Dix | 8,224 | 13.03 | ||
| Ecology | Brian Goodale | 911 | 1.44 | New | |
| National Front | Victor Logan | 881 | 1.40 | New | |
| Majority | 13,229 | 20.95 | |||
| Turnout | 63,125 | 82.19 | |||
| Conservative hold | Swing | ||||
References
- "Hitchin', Feb 1974 - May 1983". ElectionWeb Project. Cognitive Computing Limited. Archived from the original on 24 August 2019. Retrieved 22 March 2016.
- "The 2023 Review of Parliamentary Constituency Boundaries in England – Volume one: Report – Eastern | Boundary Commission for England". boundarycommissionforengland.independent.gov.uk. Retrieved 26 July 2023.
- Great Britain, Incorporated Council of Law Reporting for England and Wales. The public general acts. unknown library. Proprietors of the Law Journal Reports, 1884.
- Fraser, Hugh (1918). The Representation of the people act, 1918 : with explanatory notes. University of California Libraries. London : Sweet and Maxwell.
- Craig, Fred W. S. (1972). Boundaries of parliamentary constituencies 1885–1972;. Chichester: Political Reference Publications. ISBN 0900178094. OCLC 539011.
- "Representation of the People Act, 1948". www.legislation.gov.uk. Retrieved 24 February 2019.
- "The Parliamentary Constituencies (Hertford and Stevenage and Hitchin) Order 1971. SI 1971/2110". Statutory Instruments 1971. Part III Section 2. London: Her Majesty's Stationery Office. 1972. pp. 6223–6225.
- British Parliamentary Election Results 1885-1918, FWS Craig
- The Liberal Year Book, 1907
- Debrett's House of Commons & Judicial Bench, 1886
- Debrett's House of Commons & Judicial Bench, 1901
- Debrett's House of Commons & Judicial Bench, 1916
- British parliamentary election results, 1918-1949 (Craig)
- British Parliamentary Election Results 1918-1949, FWS Craig
- British Parliamentary Election Results 1918-1949, F W S Craig