Hjørring (nomination district)
Hjørring nominating district is one of the 92 nominating districts that exists for Danish elections following the 2007 municipal reform.[3][4][5] It consists of Hjørring municipality.[6] It was created in 1849[7] as a constituency, and has been a nomination district since 1920, though its boundaries have been changed since then.
| Hjørring | |
|---|---|
| Hjørring | |
| Nomination district constituency for the Folketing | |
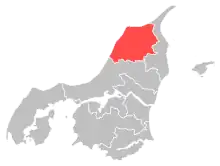 Location of Hjørring within North Jutland | |
 Location of North Jutland within Denmark | |
| Municipalities | Hjørring |
| Constituency | North Jutland |
| Electorate | 48,489 (2022)[1] |
| Current constituency | |
| Created | 1849 (as constituency)[2] 1920 (as nomination district) |
Parties of the often nicknamed blue bloc has received more votes than the red bloc in all the general elections, however the Social Democrats has become largest party in all of them except 2011.[8]
Election results
General elections in the 2020s
| Parties | Vote | |||||
|---|---|---|---|---|---|---|
| Votes | % | + / - | ||||
| Social Democrats | 14,049 | 35.19 | +2.48 | |||
| Denmark Democrats | 6,672 | 16.71 | New | |||
| Venstre | 5,416 | 13.56 | -15.33 | |||
| Moderates | 2,530 | 6.34 | New | |||
| Liberal Alliance | 2,334 | 5.85 | +4.60 | |||
| Conservatives | 2,116 | 5.30 | -0.97 | |||
| Green Left | 1,915 | 4.80 | -0.09 | |||
| New Right | 1,667 | 4.18 | +1.75 | |||
| Red–Green Alliance | 1,018 | 2.55 | -1.31 | |||
| Danish People's Party | 815 | 2.04 | -8.11 | |||
| Social Liberals | 615 | 1.54 | -2.34 | |||
| The Alternative | 468 | 1.17 | -0.25 | |||
| Christian Democrats | 213 | 0.53 | -1.12 | |||
| Jette Møller | 50 | 0.13 | New | |||
| Independent Greens | 49 | 0.12 | New | |||
| Total | 39,927 | |||||
| Source[9] | ||||||
General elections in the 2010s
| Parties | Vote | |||||
|---|---|---|---|---|---|---|
| Votes | % | + / - | ||||
| Social Democrats | 13,147 | 32.71 | +4.90 | |||
| Venstre | 11,609 | 28.89 | +5.44 | |||
| Danish People's Party | 4,078 | 10.15 | -13.49 | |||
| Conservatives | 2,518 | 6.27 | +0.93 | |||
| Green Left | 1,966 | 4.89 | +1.24 | |||
| Social Liberals | 1,558 | 3.88 | +1.33 | |||
| Red–Green Alliance | 1,550 | 3.86 | -1.70 | |||
| New Right | 976 | 2.43 | New | |||
| Stram Kurs | 756 | 1.88 | New | |||
| Christian Democrats | 665 | 1.65 | +0.72 | |||
| The Alternative | 572 | 1.42 | -0.92 | |||
| Liberal Alliance | 504 | 1.25 | -3.47 | |||
| Klaus Riskær Pedersen Party | 289 | 0.72 | New | |||
| Total | 40,188 | |||||
| Source[10] | ||||||
| Parties | Vote | ||||||||||
|---|---|---|---|---|---|---|---|---|---|---|---|
| Votes | % | + / - | |||||||||
| Social Democrats | 11,585 | 27.81 | -0.19 | ||||||||
| Danish People's Party | 9,848 | 23.64 | +11.75 | ||||||||
| Venstre | 9,769 | 23.45 | -5.72 | ||||||||
| Red–Green Alliance | 2,318 | 5.56 | +1.65 | ||||||||
| Conservatives | 2,225 | 5.34 | -1.76 | ||||||||
| Liberal Alliance | 1,966 | 4.72 | +1.03 | ||||||||
| Green Left | 1,520 | 3.65 | -5.47 | ||||||||
| Social Liberals | 1,062 | 2.55 | -3.66 | ||||||||
| The Alternative | 973 | 2.34 | New | ||||||||
| Christian Democrats | 389 | 0.93 | +0.05 | ||||||||
| Hans Schultz | 9 | 0.02 | -0.01 | ||||||||
| Total | 41,664 | ||||||||||
| Source[11] | |||||||||||
| Parties | Vote | |||||
|---|---|---|---|---|---|---|
| Votes | % | + / - | ||||
| Venstre | 12,521 | 29.17 | +3.14 | |||
| Social Democrats | 12,017 | 28.00 | +0.58 | |||
| Danish People's Party | 5,105 | 11.89 | -1.35 | |||
| Green Left | 3,915 | 9.12 | -0.76 | |||
| Conservatives | 3,046 | 7.10 | -9.05 | |||
| Social Liberals | 2,665 | 6.21 | +2.44 | |||
| Red–Green Alliance | 1,679 | 3.91 | +3.08 | |||
| Liberal Alliance | 1,585 | 3.69 | +2.08 | |||
| Christian Democrats | 377 | 0.88 | -0.16 | |||
| Hans Schultz | 14 | 0.03 | +0.02 | |||
| Total | 42,924 | |||||
| Source[12] | ||||||
General elections in the 2000s
| Parties | Vote | |||||
|---|---|---|---|---|---|---|
| Votes | % | + / - | ||||
| Social Democrats | 11,604 | 27.42 | -0.39 | |||
| Venstre | 11,013 | 26.03 | -1.63 | |||
| Conservatives | 6,832 | 16.15 | +0.02 | |||
| Danish People's Party | 5,602 | 13.24 | +1.68 | |||
| Green Left | 4,182 | 9.88 | +6.34 | |||
| Social Liberals | 1,596 | 3.77 | -4.00 | |||
| New Alliance | 680 | 1.61 | New | |||
| Christian Democrats | 442 | 1.04 | -1.29 | |||
| Red–Green Alliance | 352 | 0.83 | -0.92 | |||
| Anders Gravers Pedersen | 6 | 0.01 | New | |||
| Hans Schultz | 4 | 0.01 | New | |||
| Total | 42,313 | |||||
| Source[13] | ||||||
| Parties | Vote | |||||
|---|---|---|---|---|---|---|
| Votes | % | + / - | ||||
| Social Democrats | 10,081 | 27.80 | -1.42 | |||
| Venstre | 10,025 | 27.64 | -3.27 | |||
| Conservatives | 5,845 | 16.12 | +2.25 | |||
| Danish People's Party | 4,189 | 11.55 | +1.45 | |||
| Social Liberals | 2,816 | 7.77 | +3.42 | |||
| Green Left | 1,283 | 3.54 | -0.24 | |||
| Christian Democrats | 845 | 2.33 | -0.92 | |||
| Red–Green Alliance | 633 | 1.75 | +0.15 | |||
| Centre Democrats | 474 | 1.31 | -1.08 | |||
| Minority Party | 56 | 0.15 | New | |||
| Christian Jensen | 8 | 0.02 | New | |||
| Ivan Johansen | 8 | 0.02 | New | |||
| Aase Heskjær | 1 | 0.00 | New | |||
| Total | 36,264 | |||||
| Source[14] | ||||||
| Parties | Vote | |||||
|---|---|---|---|---|---|---|
| Votes | % | + / - | ||||
| Venstre | 11,583 | 30.91 | +7.36 | |||
| Social Democrats | 10,950 | 29.22 | -6.73 | |||
| Conservatives | 5,197 | 13.87 | +5.67 | |||
| Danish People's Party | 3,785 | 10.10 | +6.56 | |||
| Social Liberals | 1,629 | 4.35 | +0.41 | |||
| Green Left | 1,418 | 3.78 | -0.84 | |||
| Christian People's Party | 1,219 | 3.25 | -0.05 | |||
| Centre Democrats | 897 | 2.39 | -2.16 | |||
| Red–Green Alliance | 601 | 1.60 | +0.23 | |||
| Progress Party | 200 | 0.53 | -10.18 | |||
| Total | 37,479 | |||||
| Source[15] | ||||||
General elections in the 1990s
| Parties | Vote | |||||
|---|---|---|---|---|---|---|
| Votes | % | + / - | ||||
| Social Democrats | 13,695 | 35.95 | -0.56 | |||
| Venstre | 8,971 | 23.55 | -2.90 | |||
| Progress Party | 4,081 | 10.71 | +1.33 | |||
| Conservatives | 3,124 | 8.20 | -2.59 | |||
| Green Left | 1,759 | 4.62 | +0.32 | |||
| Centre Democrats | 1,734 | 4.55 | +1.83 | |||
| Social Liberals | 1,500 | 3.94 | -1.11 | |||
| Danish People's Party | 1,347 | 3.54 | New | |||
| Christian People's Party | 1,258 | 3.30 | 0.00 | |||
| Red–Green Alliance | 522 | 1.37 | -0.10 | |||
| Democratic Renewal | 95 | 0.25 | New | |||
| Henrik Westergaard | 11 | 0.03 | New | |||
| Total | 38,097 | |||||
| Source[16] | ||||||
| Parties | Vote | |||||
|---|---|---|---|---|---|---|
| Votes | % | + / - | ||||
| Social Democrats | 13,444 | 36.51 | -2.44 | |||
| Venstre | 9,742 | 26.45 | +7.42 | |||
| Conservatives | 3,972 | 10.79 | -0.23 | |||
| Progress Party | 3,454 | 9.38 | -0.25 | |||
| Social Liberals | 1,861 | 5.05 | +0.96 | |||
| Green Left | 1,583 | 4.30 | -0.65 | |||
| Christian People's Party | 1,216 | 3.30 | -1.21 | |||
| Centre Democrats | 1,000 | 2.72 | -2.12 | |||
| Red–Green Alliance | 543 | 1.47 | +0.89 | |||
| Steen W. Jakobsen | 4 | 0.01 | New | |||
| Svend Jensen | 4 | 0.01 | New | |||
| Henning Sørensen | 4 | 0.01 | New | |||
| Total | 36,827 | |||||
| Source[17] | ||||||
| Parties | Vote | |||||
|---|---|---|---|---|---|---|
| Votes | % | + / - | ||||
| Social Democrats | 14,040 | 38.95 | +7.18 | |||
| Venstre | 6,861 | 19.03 | -0.03 | |||
| Conservatives | 3,974 | 11.02 | -3.30 | |||
| Progress Party | 3,471 | 9.63 | -1.37 | |||
| Green Left | 1,786 | 4.95 | -2.86 | |||
| Centre Democrats | 1,744 | 4.84 | +0.35 | |||
| Christian People's Party | 1,627 | 4.51 | +0.60 | |||
| Social Liberals | 1,473 | 4.09 | -0.56 | |||
| Common Course | 451 | 1.25 | -0.39 | |||
| Red–Green Alliance | 209 | 0.58 | New | |||
| The Greens | 200 | 0.55 | -0.27 | |||
| Justice Party of Denmark | 188 | 0.52 | New | |||
| Humanist Party | 13 | 0.04 | New | |||
| P. H. Bering | 12 | 0.03 | New | |||
| Total | 36,049 | |||||
| Source[18] | ||||||
General elections in the 1980s
| Parties | Vote | |||||
|---|---|---|---|---|---|---|
| Votes | % | + / - | ||||
| Social Democrats | 11,837 | 31.77 | -0.06 | |||
| Venstre | 7,099 | 19.06 | +0.42 | |||
| Conservatives | 5,336 | 14.32 | -1.76 | |||
| Progress Party | 4,098 | 11.00 | +4.97 | |||
| Green Left | 2,909 | 7.81 | -1.09 | |||
| Social Liberals | 1,733 | 4.65 | -0.56 | |||
| Centre Democrats | 1,673 | 4.49 | -0.06 | |||
| Christian People's Party | 1,457 | 3.91 | -0.50 | |||
| Common Course | 611 | 1.64 | -0.33 | |||
| The Greens | 305 | 0.82 | -0.07 | |||
| Communist Party of Denmark | 114 | 0.31 | 0.00 | |||
| Left Socialists | 82 | 0.22 | -0.30 | |||
| Total | 37,254 | |||||
| Source[19] | ||||||
| Parties | Vote | |||||
|---|---|---|---|---|---|---|
| Votes | % | + / - | ||||
| Social Democrats | 11,964 | 31.83 | +1.43 | |||
| Venstre | 7,006 | 18.64 | -1.55 | |||
| Conservatives | 6,044 | 16.08 | -3.34 | |||
| Green Left | 3,345 | 8.90 | +2.33 | |||
| Progress Party | 2,265 | 6.03 | -0.03 | |||
| Social Liberals | 1,959 | 5.21 | +0.36 | |||
| Centre Democrats | 1,712 | 4.55 | -0.45 | |||
| Christian People's Party | 1,656 | 4.41 | -0.51 | |||
| Common Course | 739 | 1.97 | New | |||
| The Greens | 335 | 0.89 | New | |||
| Left Socialists | 195 | 0.52 | -0.43 | |||
| Justice Party of Denmark | 187 | 0.50 | -0.80 | |||
| Communist Party of Denmark | 116 | 0.31 | +0.07 | |||
| Humanist Party | 47 | 0.13 | New | |||
| Jytte Østerbye | 13 | 0.03 | New | |||
| Socialist Workers Party | 5 | 0.01 | -0.05 | |||
| Marxist–Leninists Party | 2 | 0.01 | -0.04 | |||
| Total | 37,590 | |||||
| Source[20] | ||||||
| Parties | Vote | |||||
|---|---|---|---|---|---|---|
| Votes | % | + / - | ||||
| Social Democrats | 11,383 | 30.40 | -0.84 | |||
| Venstre | 7,561 | 20.19 | +1.05 | |||
| Conservatives | 7,273 | 19.42 | +10.12 | |||
| Green Left | 2,460 | 6.57 | -0.03 | |||
| Progress Party | 2,268 | 6.06 | -6.63 | |||
| Centre Democrats | 1,871 | 5.00 | -3.90 | |||
| Christian People's Party | 1,841 | 4.92 | +0.01 | |||
| Social Liberals | 1,815 | 4.85 | +0.36 | |||
| Justice Party of Denmark | 487 | 1.30 | -0.06 | |||
| Left Socialists | 357 | 0.95 | +0.13 | |||
| Communist Party of Denmark | 88 | 0.24 | -0.17 | |||
| Socialist Workers Party | 22 | 0.06 | 0.00 | |||
| Marxist–Leninists Party | 19 | 0.05 | New | |||
| Total | 37,445 | |||||
| Source[21] | ||||||
| Parties | Vote | |||||
|---|---|---|---|---|---|---|
| Votes | % | + / - | ||||
| Social Democrats | 10,985 | 31.24 | -3.01 | |||
| Venstre | 6,732 | 19.14 | -1.55 | |||
| Progress Party | 4,464 | 12.69 | -1.92 | |||
| Conservatives | 3,270 | 9.30 | +0.80 | |||
| Centre Democrats | 3,130 | 8.90 | +5.40 | |||
| Green Left | 2,320 | 6.60 | +3.10 | |||
| Christian People's Party | 1,727 | 4.91 | -0.36 | |||
| Social Liberals | 1,580 | 4.49 | -0.36 | |||
| Justice Party of Denmark | 478 | 1.36 | -0.90 | |||
| Left Socialists | 289 | 0.82 | -0.70 | |||
| Communist Party of Denmark | 144 | 0.41 | -0.42 | |||
| Communist Workers Party | 24 | 0.07 | -0.14 | |||
| Socialist Workers Party | 21 | 0.06 | New | |||
| Total | 35,164 | |||||
| Source[22] | ||||||
General elections in the 1970s
| Parties | Vote | |||||
|---|---|---|---|---|---|---|
| Votes | % | + / - | ||||
| Social Democrats | 12,075 | 34.25 | +4.58 | |||
| Venstre | 7,293 | 20.69 | +1.61 | |||
| Progress Party | 5,151 | 14.61 | -4.14 | |||
| Conservatives | 2,996 | 8.50 | +2.12 | |||
| Christian People's Party | 1,857 | 5.27 | -2.28 | |||
| Social Liberals | 1,710 | 4.85 | +1.54 | |||
| Green Left | 1,235 | 3.50 | +1.66 | |||
| Centre Democrats | 1,234 | 3.50 | -2.61 | |||
| Justice Party of Denmark | 796 | 2.26 | -1.13 | |||
| Left Socialists | 535 | 1.52 | +0.31 | |||
| Communist Party of Denmark | 294 | 0.83 | -1.00 | |||
| Communist Workers Party | 75 | 0.21 | New | |||
| Total | 35,251 | |||||
| Source[23] | ||||||
| Parties | Vote | |||||
|---|---|---|---|---|---|---|
| Votes | % | + / - | ||||
| Social Democrats | 10,076 | 29.67 | +6.00 | |||
| Venstre | 6,478 | 19.08 | -13.18 | |||
| Progress Party | 6,367 | 18.75 | +2.90 | |||
| Christian People's Party | 2,563 | 7.55 | -2.09 | |||
| Conservatives | 2,167 | 6.38 | +3.00 | |||
| Centre Democrats | 2,075 | 6.11 | +4.04 | |||
| Justice Party of Denmark | 1,151 | 3.39 | +1.39 | |||
| Social Liberals | 1,124 | 3.31 | -2.59 | |||
| Green Left | 624 | 1.84 | -0.09 | |||
| Communist Party of Denmark | 620 | 1.83 | -0.21 | |||
| Left Socialists | 410 | 1.21 | -0.05 | |||
| Pensioners' Party | 300 | 0.88 | New | |||
| Total | 33,955 | |||||
| Source[24] | ||||||
| Parties | Vote | |||||
|---|---|---|---|---|---|---|
| Votes | % | + / - | ||||
| Venstre | 10,719 | 32.26 | +10.54 | |||
| Social Democrats | 7,867 | 23.67 | +4.21 | |||
| Progress Party | 5,266 | 15.85 | -2.67 | |||
| Christian People's Party | 3,203 | 9.64 | +1.38 | |||
| Social Liberals | 1,961 | 5.90 | -4.36 | |||
| Conservatives | 1,123 | 3.38 | -2.28 | |||
| Centre Democrats | 689 | 2.07 | -5.06 | |||
| Communist Party of Denmark | 678 | 2.04 | +0.21 | |||
| Justice Party of Denmark | 665 | 2.00 | -1.76 | |||
| Green Left | 643 | 1.93 | -0.58 | |||
| Left Socialists | 418 | 1.26 | +0.45 | |||
| Total | 33,232 | |||||
| Source[25] | ||||||
| Parties | Vote | |||||
|---|---|---|---|---|---|---|
| Votes | % | + / - | ||||
| Venstre | 7,219 | 21.72 | -8.62 | |||
| Social Democrats | 6,466 | 19.46 | -12.53 | |||
| Progress Party | 6,156 | 18.52 | New | |||
| Social Liberals | 3,410 | 10.26 | -2.68 | |||
| Christian People's Party | 2,746 | 8.26 | +2.41 | |||
| Centre Democrats | 2,371 | 7.13 | New | |||
| Conservatives | 1,882 | 5.66 | -4.04 | |||
| Justice Party of Denmark | 1,249 | 3.76 | +0.88 | |||
| Green Left | 833 | 2.51 | -2.07 | |||
| Communist Party of Denmark | 609 | 1.83 | +0.94 | |||
| Left Socialists | 269 | 0.81 | -0.02 | |||
| Alex Larsen | 22 | 0.07 | New | |||
| Total | 33,232 | |||||
| Source[26] | ||||||
| Parties | Vote | |||||
|---|---|---|---|---|---|---|
| Votes | % | + / - | ||||
| Social Democrats | 9,556 | 31.99 | +2.46 | |||
| Venstre | 9,062 | 30.34 | -6.35 | |||
| Social Liberals | 3,865 | 12.94 | -0.49 | |||
| Conservatives | 2,896 | 9.70 | -3.04 | |||
| Christian People's Party | 1,746 | 5.85 | New | |||
| Green Left | 1,368 | 4.58 | +1.17 | |||
| Justice Party of Denmark | 860 | 2.88 | +1.41 | |||
| Communist Party of Denmark | 267 | 0.89 | +0.44 | |||
| Left Socialists | 249 | 0.83 | -0.09 | |||
| Total | 29,869 | |||||
| Source[27] | ||||||
General elections in the 1960s
| Parties | Vote | |||||
|---|---|---|---|---|---|---|
| Votes | % | + / - | ||||
| Venstre | 8,972 | 36.69 | +0.25 | |||
| Social Democrats | 7,221 | 29.53 | -2.90 | |||
| Social Liberals | 3,285 | 13.43 | +6.47 | |||
| Conservatives | 3,115 | 12.74 | +0.67 | |||
| Green Left | 835 | 3.41 | -2.70 | |||
| Justice Party of Denmark | 360 | 1.47 | -0.53 | |||
| Left Socialists | 225 | 0.92 | New | |||
| Liberal Centre | 214 | 0.88 | -0.67 | |||
| Independent Party | 114 | 0.47 | -1.57 | |||
| Communist Party of Denmark | 111 | 0.45 | +0.04 | |||
| Total | 24,452 | |||||
| Source[28] | ||||||
| Parties | Vote | |||||
|---|---|---|---|---|---|---|
| Votes | % | + / - | ||||
| Venstre | 8,361 | 36.44 | -0.16 | |||
| Social Democrats | 7,441 | 32.43 | -3.56 | |||
| Conservatives | 2,769 | 12.07 | +0.45 | |||
| Social Liberals | 1,597 | 6.96 | +1.64 | |||
| Green Left | 1,403 | 6.11 | +3.21 | |||
| Independent Party | 467 | 2.04 | -0.47 | |||
| Justice Party of Denmark | 459 | 2.00 | -1.21 | |||
| Liberal Centre | 356 | 1.55 | New | |||
| Communist Party of Denmark | 93 | 0.41 | 0.00 | |||
| Total | 22,946 | |||||
| Source[29] | ||||||
| Parties | Vote | |||||
|---|---|---|---|---|---|---|
| Votes | % | + / - | ||||
| Venstre | 8,097 | 36.60 | -0.59 | |||
| Social Democrats | 7,963 | 35.99 | +1.04 | |||
| Conservatives | 2,572 | 11.62 | +0.74 | |||
| Social Liberals | 1,176 | 5.32 | +0.09 | |||
| Justice Party of Denmark | 711 | 3.21 | -2.83 | |||
| Green Left | 641 | 2.90 | +0.17 | |||
| Independent Party | 556 | 2.51 | +0.05 | |||
| Danish Unity | 187 | 0.85 | New | |||
| Peace Politics People's Party | 131 | 0.59 | New | |||
| Communist Party of Denmark | 91 | 0.41 | -0.11 | |||
| Total | 22,125 | |||||
| Source[30] | ||||||
| Parties | Vote | |||||
|---|---|---|---|---|---|---|
| Votes | % | + / - | ||||
| Venstre | 7,460 | 37.19 | -4.06 | |||
| Social Democrats | 7,012 | 34.95 | +4.95 | |||
| Conservatives | 2,183 | 10.88 | +2.09 | |||
| Justice Party of Denmark | 1,211 | 6.04 | -4.12 | |||
| Social Liberals | 1,050 | 5.23 | -1.01 | |||
| Green Left | 547 | 2.73 | New | |||
| Independent Party | 493 | 2.46 | +0.31 | |||
| Communist Party of Denmark | 105 | 0.52 | -0.85 | |||
| Total | 20,061 | |||||
| Source[31] | ||||||
General elections in the 1950s
| Parties | Vote | |||||
|---|---|---|---|---|---|---|
| Votes | % | + / - | ||||
| Venstre | 7,891 | 41.25 | +1.67 | |||
| Social Democrats | 5,739 | 30.00 | -2.16 | |||
| Justice Party of Denmark | 1,944 | 10.16 | +2.93 | |||
| Conservatives | 1,682 | 8.79 | +0.86 | |||
| Social Liberals | 1,193 | 6.24 | -1.07 | |||
| Independent Party | 412 | 2.15 | -1.73 | |||
| Communist Party of Denmark | 263 | 1.37 | -0.53 | |||
| Frede Jordan | 4 | 0.02 | New | |||
| Total | 19,128 | |||||
| Source[32] | ||||||
September 1953 Danish Folketing election
| Parties | Vote | |||||
|---|---|---|---|---|---|---|
| Votes | % | + / - | ||||
| Venstre | 6,984 | 39.58 | -0.09 | |||
| Social Democrats | 5,675 | 32.16 | +1.00 | |||
| Conservatives | 1,400 | 7.93 | -0.21 | |||
| Social Liberals | 1,290 | 7.31 | -0.15 | |||
| Justice Party of Denmark | 1,275 | 7.23 | -3.64 | |||
| Independent Party | 685 | 3.88 | New | |||
| Communist Party of Denmark | 336 | 1.90 | -0.23 | |||
| Total | 17,645 | |||||
| Source[33] | ||||||
April 1953 Danish Folketing election
| Parties | Vote | |||||
|---|---|---|---|---|---|---|
| Votes | % | + / - | ||||
| Venstre | 6,670 | 39.67 | -0.03 | |||
| Social Democrats | 5,240 | 31.16 | +1.46 | |||
| Justice Party of Denmark | 1,828 | 10.87 | -2.18 | |||
| Conservatives | 1,369 | 8.14 | -1.14 | |||
| Social Liberals | 1,254 | 7.46 | +1.06 | |||
| Communist Party of Denmark | 358 | 2.13 | +0.26 | |||
| Danish Unity | 95 | 0.57 | New | |||
| Total | 16,814 | |||||
| Source[34] | ||||||
1950 Danish Folketing election
| Parties | Vote | |||||
|---|---|---|---|---|---|---|
| Votes | % | + / - | ||||
| Venstre | 6,809 | 39.70 | -4.40 | |||
| Social Democrats | 5,093 | 29.70 | +0.82 | |||
| Justice Party of Denmark | 2,239 | 13.05 | +1.50 | |||
| Conservatives | 1,592 | 9.28 | +3.42 | |||
| Social Liberals | 1,098 | 6.40 | +0.66 | |||
| Communist Party of Denmark | 320 | 1.87 | -1.08 | |||
| Total | 17,151 | |||||
| Source[35] | ||||||
General elections in the 1940s
1947 Danish Folketing election
| Parties | Vote | |||||
|---|---|---|---|---|---|---|
| Votes | % | + / - | ||||
| Venstre | 7,611 | 44.10 | +1.57 | |||
| Social Democrats | 4,985 | 28.88 | +3.37 | |||
| Justice Party of Denmark | 1,994 | 11.55 | +5.94 | |||
| Conservatives | 1,011 | 5.86 | -4.30 | |||
| Social Liberals | 990 | 5.74 | -2.75 | |||
| Communist Party of Denmark | 510 | 2.95 | -2.69 | |||
| Danish Unity | 158 | 0.92 | -1.14 | |||
| Total | 17,259 | |||||
| Source[36] | ||||||
1945 Danish Folketing election
| Parties | Vote | |||||
|---|---|---|---|---|---|---|
| Votes | % | + / - | ||||
| Venstre | 7,161 | 42.53 | +3.99 | |||
| Social Democrats | 4,295 | 25.51 | -5.25 | |||
| Conservatives | 1,711 | 10.16 | -3.03 | |||
| Social Liberals | 1,429 | 8.49 | -3.03 | |||
| Communist Party of Denmark | 950 | 5.64 | New | |||
| Justice Party of Denmark | 944 | 5.61 | +2.98 | |||
| Danish Unity | 346 | 2.06 | +1.01 | |||
| Total | 16,836 | |||||
| Source[37] | ||||||
1943 Danish Folketing election
| Parties | Vote | |||||
|---|---|---|---|---|---|---|
| Votes | % | + / - | ||||
| Venstre | 6,517 | 38.54 | -3.97 | |||
| Social Democrats | 5,202 | 30.76 | +1.28 | |||
| Conservatives | 2,230 | 13.19 | +3.44 | |||
| Social Liberals | 1,948 | 11.52 | +2.28 | |||
| Justice Party of Denmark | 445 | 2.63 | +0.32 | |||
| Farmers' Party | 243 | 1.44 | -2.18 | |||
| Danish Unity | 178 | 1.05 | +0.82 | |||
| National Socialist Workers' Party of Denmark | 146 | 0.86 | -0.29 | |||
| Total | 16,909 | |||||
| Source[38] | ||||||
General elections in the 1930s
1939 Danish Folketing election
| Parties | Vote | |||||
|---|---|---|---|---|---|---|
| Votes | % | + / - | ||||
| Venstre | 5,791 | 42.51 | +2.03 | |||
| Social Democrats | 4,016 | 29.48 | +0.13 | |||
| Conservatives | 1,328 | 9.75 | -2.54 | |||
| Social Liberals | 1,259 | 9.24 | -1.41 | |||
| Farmers' Party | 493 | 3.62 | +0.32 | |||
| Justice Party of Denmark | 314 | 2.31 | -0.10 | |||
| Communist Party of Denmark | 173 | 1.27 | +0.34 | |||
| National Socialist Workers' Party of Denmark | 157 | 1.15 | +0.57 | |||
| National Cooperation | 59 | 0.43 | New | |||
| Danish Unity | 32 | 0.23 | New | |||
| Total | 13,622 | |||||
| Source[39] | ||||||
1935 Danish Folketing election
| Parties | Vote | |||||
|---|---|---|---|---|---|---|
| Votes | % | + / - | ||||
| Venstre | 5,403 | 40.48 | -8.78 | |||
| Social Democrats | 3,917 | 29.35 | +3.54 | |||
| Conservatives | 1,640 | 12.29 | +1.49 | |||
| Social Liberals | 1,422 | 10.65 | -1.16 | |||
| Independent People's Party | 441 | 3.30 | New | |||
| Justice Party of Denmark | 322 | 2.41 | +0.41 | |||
| Communist Party of Denmark | 124 | 0.93 | +0.75 | |||
| National Socialist Workers' Party of Denmark | 77 | 0.58 | New | |||
| Total | 13,346 | |||||
| Source[40] | ||||||
1932 Danish Folketing election
| Parties | Vote | |||||
|---|---|---|---|---|---|---|
| Votes | % | + / - | ||||
| Venstre | 6,546 | 49.26 | -3.52 | |||
| Social Democrats | 3,430 | 25.81 | +1.67 | |||
| Social Liberals | 1,570 | 11.81 | -1.88 | |||
| Conservatives | 1,435 | 10.80 | +2.78 | |||
| Justice Party of Denmark | 266 | 2.00 | +0.75 | |||
| Communist Party of Denmark | 24 | 0.18 | +0.05 | |||
| Jens Frost | 19 | 0.14 | New | |||
| Total | 13,290 | |||||
| Source[41] | ||||||
General elections in the 1920s
1929 Danish Folketing election
| Parties | Vote | |||||
|---|---|---|---|---|---|---|
| Votes | % | + / - | ||||
| Venstre | 6,710 | 52.78 | +1.44 | |||
| Social Democrats | 3,069 | 24.14 | +3.55 | |||
| Social Liberals | 1,740 | 13.69 | -1.64 | |||
| Conservatives | 1,019 | 8.02 | -4.18 | |||
| Justice Party of Denmark | 159 | 1.25 | +0.85 | |||
| Communist Party of Denmark | 16 | 0.13 | 0.00 | |||
| Total | 12,713 | |||||
| Source[42] | ||||||
1926 Danish Folketing election
| Parties | Vote | |||||
|---|---|---|---|---|---|---|
| Votes | % | + / - | ||||
| Venstre | 6,120 | 51.34 | +1.09 | |||
| Social Democrats | 2,455 | 20.59 | +1.36 | |||
| Social Liberals | 1,828 | 15.33 | -2.66 | |||
| Conservatives | 1,454 | 12.20 | +1.82 | |||
| Justice Party of Denmark | 48 | 0.40 | +0.05 | |||
| Communist Party of Denmark | 16 | 0.13 | -0.10 | |||
| Total | 11,921 | |||||
| Source[43] | ||||||
1924 Danish Folketing election
| Parties | Vote | |||||
|---|---|---|---|---|---|---|
| Votes | % | + / - | ||||
| Venstre | 5,794 | 50.25 | -2.95 | |||
| Social Democrats | 2,217 | 19.23 | +3.46 | |||
| Social Liberals | 2,075 | 17.99 | +0.27 | |||
| Conservatives | 1,197 | 10.38 | -2.82 | |||
| Farmer Party | 182 | 1.58 | New | |||
| Justice Party of Denmark | 40 | 0.35 | New | |||
| Communist Party of Denmark | 26 | 0.23 | New | |||
| Total | 11,531 | |||||
| Source[44] | ||||||
September 1920 Danish Folketing election
| Parties | Vote | |||||
|---|---|---|---|---|---|---|
| Votes | % | + / - | ||||
| Venstre | 6,005 | 53.20 | -0.24 | |||
| Social Liberals | 2,000 | 17.72 | +1.38 | |||
| Social Democrats | 1,780 | 15.77 | +3.37 | |||
| Conservatives | 1,490 | 13.20 | -3.98 | |||
| Danish Left Socialist Party | 12 | 0.11 | New | |||
| Total | 11,287 | |||||
| Source[45] | ||||||
July 1920 Danish Folketing election
| Parties | Vote | |||||
|---|---|---|---|---|---|---|
| Votes | % | + / - | ||||
| Venstre | 4,547 | 53.44 | +0.63 | |||
| Conservatives | 1,462 | 17.18 | -0.14 | |||
| Social Liberals | 1,390 | 16.34 | +0.20 | |||
| Social Democrats | 1,055 | 12.40 | -1.22 | |||
| Industry Party | 47 | 0.55 | New | |||
| S. E. W. Schmidt | 7 | 0.08 | New | |||
| Total | 8,508 | |||||
| Source[46] | ||||||
April 1920 Danish Folketing election
| Parties | Vote | |||||
|---|---|---|---|---|---|---|
| Votes | % | |||||
| Venstre | 5,246 | 52.81 | ||||
| Conservatives | 1,721 | 17.32 | ||||
| Social Liberals | 1,603 | 16.14 | ||||
| Social Democrats | 1,353 | 13.62 | ||||
| Jens Chr. Bæch | 11 | 0.11 | ||||
| Total | 9,934 | |||||
| Source[47] | ||||||
European Parliament elections results
2019 European Parliament election in Denmark
| Parties | Vote | |||||
|---|---|---|---|---|---|---|
| Votes | % | + / - | ||||
| Venstre | 10,385 | 35.49 | +16.46 | |||
| Social Democrats | 7,231 | 24.71 | +2.84 | |||
| Danish People's Party | 3,230 | 11.04 | -17.48 | |||
| Green Left | 2,596 | 8.87 | +0.87 | |||
| Social Liberals | 1,533 | 5.24 | +1.83 | |||
| Conservatives | 1,246 | 4.26 | -4.83 | |||
| People's Movement against the EU | 1,095 | 3.74 | -3.17 | |||
| Red–Green Alliance | 990 | 3.38 | New | |||
| The Alternative | 508 | 1.74 | New | |||
| Liberal Alliance | 445 | 1.52 | -1.64 | |||
| Total | 29,259 | |||||
| Source[48] | ||||||
2014 European Parliament election in Denmark
| Parties | Vote | |||||
|---|---|---|---|---|---|---|
| Votes | % | + / - | ||||
| Danish People's Party | 6,743 | 28.52 | +14.83 | |||
| Social Democrats | 5,171 | 21.87 | -0.12 | |||
| Venstre | 4,499 | 19.03 | -5.05 | |||
| Conservatives | 2,149 | 9.09 | -5.52 | |||
| Green Left | 1,892 | 8.00 | -5.34 | |||
| People's Movement against the EU | 1,633 | 6.91 | +0.86 | |||
| Social Liberals | 805 | 3.41 | +0.63 | |||
| Liberal Alliance | 747 | 3.16 | +2.78 | |||
| Total | 23,639 | |||||
| Source[49] | ||||||
2009 European Parliament election in Denmark
| Parties | Vote | |||||
|---|---|---|---|---|---|---|
| Votes | % | + / - | ||||
| Venstre | 6,130 | 24.08 | -3.03 | |||
| Social Democrats | 5,597 | 21.99 | -11.31 | |||
| Conservatives | 3,720 | 14.61 | +6.17 | |||
| Danish People's Party | 3,484 | 13.69 | +7.41 | |||
| Green Left | 3,396 | 13.34 | +8.14 | |||
| People's Movement against the EU | 1,539 | 6.05 | +2.55 | |||
| June Movement | 787 | 3.09 | -7.37 | |||
| Social Liberals | 707 | 2.78 | -1.31 | |||
| Liberal Alliance | 97 | 0.38 | New | |||
| Total | 25,457 | |||||
| Source[50] | ||||||
2004 European Parliament election in Denmark
| Parties | Vote | |||||
|---|---|---|---|---|---|---|
| Votes | % | + / - | ||||
| Social Democrats | 6,122 | 33.30 | +17.89 | |||
| Venstre | 4,984 | 27.11 | -3.17 | |||
| June Movement | 1,923 | 10.46 | -5.61 | |||
| Conservatives | 1,551 | 8.44 | +2.26 | |||
| Danish People's Party | 1,155 | 6.28 | +1.30 | |||
| Green Left | 956 | 5.20 | -0.19 | |||
| Social Liberals | 752 | 4.09 | -4.11 | |||
| People's Movement against the EU | 643 | 3.50 | -2.06 | |||
| Christian Democrats | 298 | 1.62 | -1.48 | |||
| Total | 18,384 | |||||
| Source[51] | ||||||
1999 European Parliament election in Denmark
| Parties | Vote | |||||
|---|---|---|---|---|---|---|
| Votes | % | + / - | ||||
| Venstre | 5,762 | 30.28 | +4.88 | |||
| June Movement | 3,058 | 16.07 | +2.62 | |||
| Social Democrats | 2,933 | 15.41 | -1.29 | |||
| Social Liberals | 1,560 | 8.20 | +0.12 | |||
| Conservatives | 1,175 | 6.18 | -8.30 | |||
| People's Movement against the EU | 1,057 | 5.56 | -3.46 | |||
| Green Left | 1,026 | 5.39 | +0.02 | |||
| Danish People's Party | 948 | 4.98 | New | |||
| Centre Democrats | 919 | 4.83 | +3.55 | |||
| Christian Democrats | 589 | 3.10 | +0.82 | |||
| Progress Party | 264 | 1.39 | -2.55 | |||
| Total | 19,027 | |||||
| Source[52] | ||||||
1994 European Parliament election in Denmark
| Parties | Vote | |||||
|---|---|---|---|---|---|---|
| Votes | % | + / - | ||||
| Venstre | 5,192 | 25.40 | +3.31 | |||
| Social Democrats | 3,413 | 16.70 | -6.85 | |||
| Conservatives | 2,960 | 14.48 | +4.95 | |||
| June Movement | 2,749 | 13.45 | New | |||
| People's Movement against the EU | 1,843 | 9.02 | -5.64 | |||
| Social Liberals | 1,652 | 8.08 | +5.31 | |||
| Green Left | 1,097 | 5.37 | -0.54 | |||
| Progress Party | 806 | 3.94 | -2.67 | |||
| Christian Democrats | 465 | 2.28 | -3.20 | |||
| Centre Democrats | 261 | 1.28 | -8.11 | |||
| Total | 20,438 | |||||
| Source[53] | ||||||
1989 European Parliament election in Denmark
| Parties | Vote | |||||
|---|---|---|---|---|---|---|
| Votes | % | + / - | ||||
| Social Democrats | 4,009 | 23.55 | +4.58 | |||
| Venstre | 3,761 | 22.09 | +1.07 | |||
| People's Movement against the EU | 2,495 | 14.66 | -0.55 | |||
| Conservatives | 1,622 | 9.53 | -8.39 | |||
| Centre Democrats | 1,599 | 9.39 | +2.56 | |||
| Progress Party | 1,126 | 6.61 | +2.00 | |||
| Green Left | 1,006 | 5.91 | -0.22 | |||
| Christian Democrats | 933 | 5.48 | -0.18 | |||
| Social Liberals | 471 | 2.77 | -0.44 | |||
| Total | 17,022 | |||||
| Source[54] | ||||||
1984 European Parliament election in Denmark
| Parties | Vote | |||||
|---|---|---|---|---|---|---|
| Votes | % | |||||
| Venstre | 4,213 | 21.02 | ||||
| Social Democrats | 3,802 | 18.97 | ||||
| Conservatives | 3,593 | 17.92 | ||||
| People's Movement against the EU | 3,050 | 15.21 | ||||
| Centre Democrats | 1,370 | 6.83 | ||||
| Green Left | 1,229 | 6.13 | ||||
| Christian Democrats | 1,134 | 5.66 | ||||
| Progress Party | 925 | 4.61 | ||||
| Social Liberals | 643 | 3.21 | ||||
| Left Socialists | 88 | 0.44 | ||||
| Total | 20,047 | |||||
| Source[55] | ||||||
Referendums
2022 Danish European Union opt-out referendum[56]
| Option | Votes | % |
|---|---|---|
| ✓ YES | 18,894 | 62.81 |
| X NO | 11,187 | 37.19 |
2015 Danish European Union opt-out referendum[57]
| Option | Votes | % |
|---|---|---|
| X NO | 19,325 | 57.53 |
| ✓ YES | 14,269 | 42.47 |
2014 Danish Unified Patent Court membership referendum[58]
| Option | Votes | % |
|---|---|---|
| ✓ YES | 14,487 | 63.05 |
| X NO | 8,489 | 36.95 |
2009 Danish Act of Succession referendum[59]
| Option | Votes | % |
|---|---|---|
| ✓ YES | 21,059 | 85.60 |
| X NO | 3,542 | 14.40 |
2000 Danish euro referendum[60]
| Option | Votes | % |
|---|---|---|
| X NO | 21,926 | 57.82 |
| ✓ YES | 15,993 | 42.18 |
1998 Danish Amsterdam Treaty referendum[61]
| Option | Votes | % |
|---|---|---|
| ✓ YES | 17,112 | 54.49 |
| X NO | 14,292 | 45.51 |
1993 Danish Maastricht Treaty referendum[62]
| Option | Votes | % |
|---|---|---|
| ✓ YES | 20,659 | 55.64 |
| X NO | 16,469 | 44.36 |
1992 Danish Maastricht Treaty referendum[63]
| Option | Votes | % |
|---|---|---|
| X NO | 17,825 | 51.40 |
| ✓ YES | 16,853 | 48.60 |
1986 Danish Single European Act referendum[64]
| Option | Votes | % |
|---|---|---|
| ✓ YES | 21,059 | 67.05 |
| X NO | 10,351 | 32.95 |
1972 Danish European Communities membership referendum[65]
| Option | Votes | % |
|---|---|---|
| ✓ YES | 15,490 | 73.92 |
| X NO | 5,464 | 26.08 |
1953 Danish constitutional and electoral age referendum[66]
| Option | Votes | % |
|---|---|---|
| ✓ YES | 7,870 | 78.36 |
| X NO | 2,174 | 21.64 |
| 23 years | 6,007 | 58.70 |
| 21 years | 4,227 | 41.30 |
1939 Danish constitutional referendum[67]
| Option | Votes | % |
|---|---|---|
| ✓ YES | 4,461 | 88.13 |
| X NO | 601 | 11.87 |
References
- "Hjørringkredsen". kmdvalg.dk (in Danish). Retrieved 2023-06-02.
- "Beretning om Forhandlingerne paa Rigsdagen". Rigsdagstidende. II: Spalte 3892 ff.
- "Nye valgkredse fordeler stemmerne anderledes". dr.dk (in Danish). Retrieved 2023-06-02.
- "Beretning om nye valgkredse som følge af kommunalreformen" (in Danish). Retrieved 2023-06-02.
- "Det danske valgsystem: Valg til Folketinget". valg.im (in Danish). Retrieved 2023-06-02.
- "85 Hjørring". dataforsyningen.dk (in Danish). Retrieved 2023-06-02.
- "Beretning om Forhandlingerne paa Rigsdagen". Rigsdagstidende. II: Spalte 3892 ff.
- "FOLKETINGSVALG TORSDAG 15. SEPTEMBER 2011". dst.dk (in Danish). Retrieved 2023-06-02.
- "FOLKETINGSVALG TIRSDAG 1. NOVEMBER 2022". valg.im (in Danish). Retrieved 2023-06-27.
- "FOLKETINGSVALG ONSDAG 5. JUNI 2019". valg.im (in Danish). Retrieved 2023-06-27.
- "FOLKETINGSVALG TORSDAG 18. JUNI 2015". valg.im (in Danish). Retrieved 2023-06-27.
- "FOLKETINGSVALG TORSDAG 15. SEPTEMBER 2011". valg.im (in Danish). Retrieved 2023-06-27.
- "Folketingsvalget den 13. november 2007". valg.im (in Danish). Retrieved 2023-06-27.
- "valg2005.book" (PDF). valg.im (in Danish). Retrieved 2023-06-27.
- "BMTABEL" (PDF). valg.im (in Danish). Retrieved 2023-06-27.
- "VALG98" (PDF). valg.im (in Danish). Retrieved 2023-06-27.
- "VALG94" (PDF). valg.im (in Danish). Retrieved 2023-06-27.
- "VALG90" (PDF). valg.im (in Danish). Retrieved 2023-06-27.
- "Folketingsvalget den 10. maj 1988". valg.im (in Danish). Retrieved 2023-06-27.
- "Folketingsvalget den 8.september 1987". dst.dk (in Danish). Retrieved 2023-06-27.
- "Folketingsvalget den 10. januar 1984". dst.dk (in Danish). Retrieved 2023-06-27.
- "Folketingsvalget den 8. december 1981". dst.dk (in Danish). Retrieved 2023-06-27.
- "Folketingsvalget den 23. oktober 1979". dst.dk (in Danish). Retrieved 2023-06-27.
- "Folketingsvalget den 15. februar 1977". dst.dk (in Danish). Retrieved 2023-06-27.
- "Folketingsvalget den 9. januar 1975". dst.dk (in Danish). Retrieved 2023-06-27.
- "Folketingsvalget den 4. december 1973". dst.dk (in Danish). Retrieved 2023-06-27.
- "Folketingsvalget den 21. september 1971 samt folkeafstemningen". dst.dk (in Danish). Retrieved 2023-06-27.
- "Folketingsvalget den 23. januar 1968". dst.dk (in Danish). Retrieved 2023-06-27.
- "Folketingsvalget den 22. november 1966". dst.dk (in Danish). Retrieved 2023-06-27.
- "Folketingsvalget den 22. september 1964". dst.dk (in Danish). Retrieved 2023-06-27.
- "Folketingsvalget den 15. november 1960". dst.dk (in Danish). Retrieved 2023-06-27.
- "Folketingsvalget den 14. maj 1957". dst.dk (in Danish). Retrieved 2023-06-27.
- "Folketingsvalget den 22. september 1953". dst.dk (in Danish). Retrieved 2023-06-27.
- "Rigsdagsvalgene og folkeafstemningerne i april og maj 1953". dst.dk (in Danish). Retrieved 2023-06-27.
- "Folketingsvalget den 5. september 1950". dst.dk (in Danish). Retrieved 2023-06-27.
- "Folketingsvalget den 28. oktober 1947". dst.dk (in Danish). Retrieved 2023-06-27.
- "Rigsdagsvalgene i oktober og november 1945". dst.dk (in Danish). Retrieved 2023-06-27.
- "Rigsdagsvalgene i marts og april 1943". dst.dk (in Danish). Retrieved 2023-06-27.
- "Rigsdagsvalgene og Folkeafstemningen i april og maj 1939". dst.dk (in Danish). Retrieved 2023-06-27.
- "Folketingsvalget den 22. oktober 1935". dst.dk (in Danish). Retrieved 2023-06-27.
- "Folketingsvalget den 16. november 1932". dst.dk (in Danish). Retrieved 2023-06-27.
- "Folketingsvalget den 24. april 1929". dst.dk (in Danish). Retrieved 2023-06-27.
- "Folketingsvalget den 2. december 1926". dst.dk (in Danish). Retrieved 2023-06-27.
- "Folketingsvalget den 11. april 1924". dst.dk (in Danish). Retrieved 2023-06-27.
- "Rigsdagsvalgene september-oktober 1920". dst.dk (in Danish). Retrieved 2023-06-27.
- "Rigsdagsvalgene juli-august 1920". dst.dk (in Danish). Retrieved 2023-06-27.
- "Folketingsvalget den 26. april 1920". dst.dk (in Danish). Retrieved 2023-06-27.
- "EUROPA-PARLAMENTSVALG SØNDAG 26. MAJ 2019". dst.dk (in Danish). Retrieved 2023-07-01.
- "EUROPA-PARLAMENTSVALG SØNDAG 25. MAJ 2014". dst.dk (in Danish). Retrieved 2023-07-01.
- "EUROPA-PARLAMENTSVALG SØNDAG 7. JUNI 2009". dst.dk (in Danish). Retrieved 2023-07-01.
- "EUROPA-PARLAMENTSVALGET DEN 13. JUNI 2004" (PDF). im.dk (in Danish). Retrieved 2023-07-01.
- "VALGET TIL EUROPA-PARLAMENTET DEN 10. JUNI 1999" (PDF). im.dk (in Danish). Retrieved 2023-07-01.
- "VALGET TIL EUROPA-PARLAMENTET DEN 9. JUNI 1994" (PDF). im.dk (in Danish). Retrieved 2023-07-01.
- "Valget til Europa-parlamentet den 15. juni 1989". dst.dk (in Danish). Retrieved 2023-07-01.
- "Valget til Europa-Parlamentet den 14. juni 1984". dst.dk (in Danish). Retrieved 2023-07-01.
- "FOLKEAFSTEMNING ONSDAG 1. JUNI 2022". dst.dk (in Danish). Retrieved 2023-07-05.
- "FOLKEAFSTEMNING TORSDAG 3. DECEMBER 2015". dst.dk (in Danish). Retrieved 2023-07-05.
- "FOLKEAFSTEMNING SØNDAG 25. MAJ 2014". dst.dk (in Danish). Retrieved 2023-07-05.
- "FOLKEAFSTEMNING SØNDAG 7. JUNI 2009". dst.dk (in Danish). Retrieved 2023-07-05.
- "FOLKEAFSTEMNINGEN DEN 28. SEPTEMBER 2000 OM DANMARKS DELTAGELSE I DEN FÆLLES VALUTA" (PDF). valg.im (in Danish). Retrieved 2023-07-05.
- "FOLKEAFSTEMNINGEN DEN 28. MAJ 1998OM DANMARKS TILTRÆDELSE AF AMSTERDAMTRAKTATEN" (PDF). valg.im (in Danish). Retrieved 2023-07-05.
- "FOLKEAFSTEMNINGEN DEN 18. MAJ 1993 OM DANMARKS TILTRÆDELSE AF EDINBURGH-AFGØRELSEN OG MAASTRICHT-TRAKTATEN". dst.dk (in Danish). Retrieved 2023-07-05.
- "Folkeafstemningen den 1. juni 1992 om Danmarks tiltrædelse af traktaten om Den Europæiske Union". dst.dk (in Danish). Retrieved 2023-07-05.
- "Vejledende folkeafstemning torsdag den 27. februar 1986 om Danmarks tiltrædelse af EF- pakken". dst.dk (in Danish). Retrieved 2023-07-05.
- "Folkeafstemningen om Danmarks tiltrædelse af De europæiske Fælleskaber 2. oktober 1972". dst.dk (in Danish). Retrieved 2023-07-05.
- "Publikationsfortegnelse vedrørende Folkeafstemninger". dst.dk (in Danish). Retrieved 2023-07-05.
- "Publikationsfortegnelse vedrørende Folkeafstemninger". dst.dk (in Danish). Retrieved 2023-07-05.