Jablonski diagram
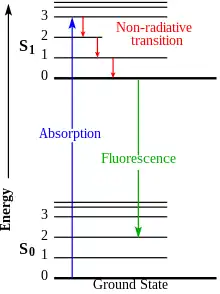
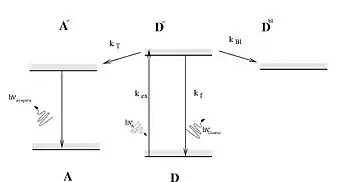
In molecular spectroscopy, a Jablonski diagram is a diagram that illustrates the electronic states and often the vibrational levels of a molecule, and also the transitions between them. The states are arranged vertically by energy and grouped horizontally by spin multiplicity. Nonradiative transitions are indicated by squiggly arrows and radiative transitions by straight arrows. The vibrational ground states of each electronic state are indicated with thick lines, the higher vibrational states with thinner lines.[1] The diagram is named after the Polish physicist Aleksander Jabłoński who first proposed it in 1933.[2]

Transitions

Radiative transitions involve the absorption of a photon, if the transition occurs to a higher energy level, or the emission of a photon, for a transition to a lower level. Nonradiative transitions arise through several different mechanisms, all differently labeled in the diagram. Relaxation of the excited state to its lowest vibrational level is called vibrational relaxation. This process involves the dissipation of energy from the molecule to its surroundings, and thus it cannot occur for isolated molecules. A second type of nonradiative transition is internal conversion (IC), which occurs when a vibrational state of an electronically excited state can couple to a vibrational state of a lower electronic state. A third type is intersystem crossing (ISC); this is a transition to a state with a different spin multiplicity. In molecules with large spin-orbit coupling, intersystem crossing is much more important than in molecules that exhibit only small spin-orbit coupling. ISC can be followed by phosphorescence.

See also
- Franck–Condon principle
- Grotrian diagram (for atoms)
References
- P., Atkins, P., de Paula, J. Atkins' Physical Chemistry, 8th edition (2006), page 494, Oxford University Press. ISBN 0-7167-8759-8
- Jabłoński, Aleksander "Efficiency of Anti-Stokes Fluorescence in Dyes" Nature 1933, volume 131, pp. 839-840.doi:10.1038/131839b0
External links
- Florida State University: Jablonski diagram primer
- Consequences of Light Absorption – The Jablonski Diagram