Kalundborg (nomination district)
Kalundborg nominating district is one of the 92 nominating districts that exists for Danish elections following the 2007 municipal reform.[3][4][5] It consists of Kalundborg and Odsherred municipality.[6] It was created in 1849 as a constituency,[7] and has been a nomination district since 1920, though its boundaries have been changed since then. Prior to 1970 it was known as Kalundborg-Onsbjerg.
| Kalundborg | |
|---|---|
| Kalundborg | |
| Nomination district constituency for the Folketing | |
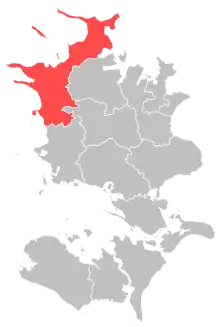 Location of Kalundborg within Zealand | |
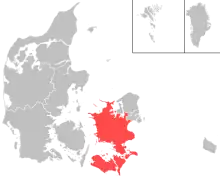 Location of Zealand within Denmark | |
| Municipalities | Kalundborg Odsherred |
| Constituency | Zealand |
| Electorate | 63,921 (2022)[1] |
| Current constituency | |
| Created | 1849 (as constituency)[2] 1920 (as nomination district) |
In general elections, the district tends to vote a bit more for parties commonly associated with the blue bloc.[8]
General elections results
General elections in the 2020s
| Parties | Vote | |||||
|---|---|---|---|---|---|---|
| Votes | % | + / - | ||||
| Social Democrats | 16,459 | 32.07 | +2.94 | |||
| Venstre | 6,368 | 12.41 | -12.05 | |||
| Denmark Democrats | 5,383 | 10.49 | New | |||
| Moderates | 4,951 | 9.65 | New | |||
| Green Left | 4,187 | 8.16 | +1.27 | |||
| New Right | 3,185 | 6.21 | +3.33 | |||
| Danish People's Party | 2,607 | 5.08 | -8.29 | |||
| Liberal Alliance | 2,573 | 5.01 | +3.79 | |||
| Red–Green Alliance | 1,764 | 3.44 | -2.37 | |||
| Conservatives | 1,591 | 3.10 | -1.30 | |||
| The Alternative | 1,009 | 1.97 | +0.08 | |||
| Social Liberals | 867 | 1.69 | -2.77 | |||
| Independent Greens | 139 | 0.27 | New | |||
| Christian Democrats | 111 | 0.22 | -0.54 | |||
| Lisa Sofia Larsson | 97 | 0.19 | New | |||
| Rasmus Paludan | 38 | 0.07 | New | |||
| Total | 51,329 | |||||
| Source[9] | ||||||
General elections in the 2010s
| Parties | Vote | |||||
|---|---|---|---|---|---|---|
| Votes | % | + / - | ||||
| Social Democrats | 15,072 | 29.13 | +1.70 | |||
| Venstre | 12,653 | 24.46 | +4.94 | |||
| Danish People's Party | 6,915 | 13.37 | -16.15 | |||
| Green Left | 3,566 | 6.89 | +3.69 | |||
| Red–Green Alliance | 3,006 | 5.81 | -1.23 | |||
| Social Liberals | 2,306 | 4.46 | +1.98 | |||
| Conservatives | 2,276 | 4.40 | +2.15 | |||
| Stram Kurs | 1,827 | 3.53 | New | |||
| New Right | 1,489 | 2.88 | New | |||
| The Alternative | 980 | 1.89 | -1.73 | |||
| Liberal Alliance | 630 | 1.22 | -3.41 | |||
| Klaus Riskær Pedersen Party | 597 | 1.15 | New | |||
| Christian Democrats | 394 | 0.76 | +0.49 | |||
| Pinki Karin Yvonne Jensen | 21 | 0.04 | New | |||
| Total | 51,732 | |||||
| Source[10] | ||||||
| Parties | Vote | |||||
|---|---|---|---|---|---|---|
| Votes | % | + / - | ||||
| Danish People's Party | 15,623 | 29.52 | +10.08 | |||
| Social Democrats | 14,514 | 27.43 | +2.44 | |||
| Venstre | 10,333 | 19.52 | -6.98 | |||
| Red–Green Alliance | 3,728 | 7.04 | +1.13 | |||
| Liberal Alliance | 2,449 | 4.63 | +1.31 | |||
| The Alternative | 1,916 | 3.62 | New | |||
| Green Left | 1,691 | 3.20 | -6.48 | |||
| Social Liberals | 1,312 | 2.48 | -3.94 | |||
| Conservatives | 1,191 | 2.25 | -1.07 | |||
| Christian Democrats | 145 | 0.27 | -0.11 | |||
| Aamer Ahmad | 11 | 0.02 | New | |||
| Michael Christiansen | 5 | 0.01 | New | |||
| Bent A. Jespersen | 4 | 0.01 | 0.00 | |||
| Total | 52,922 | |||||
| Source[11] | ||||||
| Parties | Vote | |||||
|---|---|---|---|---|---|---|
| Votes | % | + / - | ||||
| Venstre | 14,257 | 26.50 | -1.37 | |||
| Social Democrats | 13,443 | 24.99 | +0.42 | |||
| Danish People's Party | 10,456 | 19.44 | -0.77 | |||
| Green Left | 5,207 | 9.68 | -2.84 | |||
| Social Liberals | 3,454 | 6.42 | +2.43 | |||
| Red–Green Alliance | 3,181 | 5.91 | +4.41 | |||
| Conservatives | 1,786 | 3.32 | -3.26 | |||
| Liberal Alliance | 1,784 | 3.32 | +0.89 | |||
| Christian Democrats | 205 | 0.38 | +0.05 | |||
| Peter Lotinga | 11 | 0.02 | New | |||
| Johan Isbrandt Haulik | 10 | 0.02 | New | |||
| Bent A. Jespersen | 4 | 0.01 | New | |||
| Total | 53,798 | |||||
| Source[12] | ||||||
General elections in the 2000s
| Parties | Vote | |||||
|---|---|---|---|---|---|---|
| Votes | % | + / - | ||||
| Venstre | 14,921 | 27.87 | -4.81 | |||
| Social Democrats | 13,155 | 24.57 | -2.81 | |||
| Danish People's Party | 10,823 | 20.21 | +3.77 | |||
| Green Left | 6,704 | 12.52 | +6.47 | |||
| Conservatives | 3,525 | 6.58 | -0.37 | |||
| Social Liberals | 2,134 | 3.99 | -2.44 | |||
| New Alliance | 1,302 | 2.43 | New | |||
| Red–Green Alliance | 804 | 1.50 | -0.53 | |||
| Christian Democrats | 176 | 0.33 | -0.54 | |||
| Total | 53,544 | |||||
| Source[13] | ||||||
| Parties | Vote | |||||
|---|---|---|---|---|---|---|
| Votes | % | + / - | ||||
| Venstre | 8,347 | 32.68 | +2.17 | |||
| Social Democrats | 6,993 | 27.38 | -2.31 | |||
| Danish People's Party | 4,199 | 16.44 | +1.49 | |||
| Conservatives | 1,775 | 6.95 | -2.71 | |||
| Social Liberals | 1,642 | 6.43 | +2.70 | |||
| Green Left | 1,546 | 6.05 | -0.54 | |||
| Red–Green Alliance | 519 | 2.03 | +0.71 | |||
| Centre Democrats | 231 | 0.90 | -0.32 | |||
| Christian Democrats | 223 | 0.87 | -0.58 | |||
| Minority Party | 56 | 0.22 | New | |||
| Bent A. Jespersen | 8 | 0.03 | New | |||
| Total | 25,539 | |||||
| Source[14] | ||||||
| Parties | Vote | |||||
|---|---|---|---|---|---|---|
| Votes | % | + / - | ||||
| Venstre | 7,907 | 30.51 | +7.11 | |||
| Social Democrats | 7,694 | 29.69 | -7.67 | |||
| Danish People's Party | 3,876 | 14.95 | +5.52 | |||
| Conservatives | 2,504 | 9.66 | +1.08 | |||
| Green Left | 1,709 | 6.59 | -1.68 | |||
| Social Liberals | 967 | 3.73 | +0.47 | |||
| Christian People's Party | 376 | 1.45 | -0.44 | |||
| Red–Green Alliance | 343 | 1.32 | -0.27 | |||
| Centre Democrats | 317 | 1.22 | -3.26 | |||
| Progress Party | 160 | 0.62 | -0.85 | |||
| Mark Hulstrøm | 65 | 0.25 | New | |||
| Total | 25,918 | |||||
| Source[15] | ||||||
General elections in the 1990s
| Parties | Vote | |||||
|---|---|---|---|---|---|---|
| Votes | % | + / - | ||||
| Social Democrats | 9,488 | 37.36 | +0.42 | |||
| Venstre | 5,942 | 23.40 | +0.25 | |||
| Danish People's Party | 2,396 | 9.43 | New | |||
| Conservatives | 2,179 | 8.58 | -5.25 | |||
| Green Left | 2,099 | 8.27 | -0.92 | |||
| Centre Democrats | 1,138 | 4.48 | +1.89 | |||
| Social Liberals | 827 | 3.26 | -1.40 | |||
| Christian People's Party | 481 | 1.89 | +0.75 | |||
| Red–Green Alliance | 404 | 1.59 | -0.56 | |||
| Progress Party | 374 | 1.47 | -4.82 | |||
| Democratic Renewal | 63 | 0.25 | New | |||
| Bent A. Jespersen | 5 | 0.02 | New | |||
| Total | 25,396 | |||||
| Source[16] | ||||||
| Parties | Vote | |||||
|---|---|---|---|---|---|---|
| Votes | % | + / - | ||||
| Social Democrats | 9,107 | 36.94 | -2.75 | |||
| Venstre | 5,707 | 23.15 | +7.70 | |||
| Conservatives | 3,410 | 13.83 | -0.80 | |||
| Green Left | 2,265 | 9.19 | -0.93 | |||
| Progress Party | 1,551 | 6.29 | +0.10 | |||
| Social Liberals | 1,148 | 4.66 | +1.13 | |||
| Centre Democrats | 638 | 2.59 | -2.45 | |||
| Red–Green Alliance | 531 | 2.15 | +1.35 | |||
| Christian People's Party | 281 | 1.14 | -0.15 | |||
| Henning Moth | 11 | 0.04 | New | |||
| Grethe Lindberg | 4 | 0.02 | New | |||
| Total | 24,653 | |||||
| Source[17] | ||||||
| Parties | Vote | |||||
|---|---|---|---|---|---|---|
| Votes | % | + / - | ||||
| Social Democrats | 9,623 | 39.69 | +8.02 | |||
| Venstre | 3,746 | 15.45 | +2.73 | |||
| Conservatives | 3,547 | 14.63 | -2.24 | |||
| Green Left | 2,453 | 10.12 | -3.13 | |||
| Progress Party | 1,500 | 6.19 | -3.83 | |||
| Centre Democrats | 1,223 | 5.04 | +0.76 | |||
| Social Liberals | 856 | 3.53 | -2.10 | |||
| Common Course | 487 | 2.01 | -0.43 | |||
| Christian People's Party | 313 | 1.29 | +0.19 | |||
| Red–Green Alliance | 195 | 0.80 | New | |||
| The Greens | 180 | 0.74 | -0.54 | |||
| Justice Party of Denmark | 117 | 0.48 | New | |||
| Humanist Party | 6 | 0.02 | New | |||
| Total | 24,246 | |||||
| Source[18] | ||||||
General elections in the 1980s
| Parties | Vote | |||||
|---|---|---|---|---|---|---|
| Votes | % | + / - | ||||
| Social Democrats | 7,917 | 31.67 | +0.08 | |||
| Conservatives | 4,218 | 16.87 | -1.85 | |||
| Green Left | 3,313 | 13.25 | -1.26 | |||
| Venstre | 3,180 | 12.72 | +0.82 | |||
| Progress Party | 2,506 | 10.02 | +4.71 | |||
| Social Liberals | 1,407 | 5.63 | -0.82 | |||
| Centre Democrats | 1,069 | 4.28 | +0.22 | |||
| Common Course | 611 | 2.44 | -0.38 | |||
| The Greens | 320 | 1.28 | -0.06 | |||
| Christian People's Party | 275 | 1.10 | -0.18 | |||
| Communist Party of Denmark | 113 | 0.45 | -0.15 | |||
| Left Socialists | 67 | 0.27 | -0.31 | |||
| Søren Barder | 5 | 0.02 | New | |||
| Total | 25,001 | |||||
| Source[19] | ||||||
| Parties | Vote | |||||
|---|---|---|---|---|---|---|
| Votes | % | + / - | ||||
| Social Democrats | 7,934 | 31.59 | -1.60 | |||
| Conservatives | 4,702 | 18.72 | -4.64 | |||
| Green Left | 3,643 | 14.51 | +3.82 | |||
| Venstre | 2,988 | 11.90 | -1.62 | |||
| Social Liberals | 1,620 | 6.45 | +0.44 | |||
| Progress Party | 1,333 | 5.31 | +1.76 | |||
| Centre Democrats | 1,020 | 4.06 | -0.65 | |||
| Common Course | 707 | 2.82 | New | |||
| The Greens | 337 | 1.34 | New | |||
| Christian People's Party | 322 | 1.28 | -0.47 | |||
| Communist Party of Denmark | 150 | 0.60 | +0.17 | |||
| Left Socialists | 146 | 0.58 | -0.63 | |||
| Justice Party of Denmark | 127 | 0.51 | -0.96 | |||
| Humanist Party | 52 | 0.21 | New | |||
| Socialist Workers Party | 25 | 0.10 | +0.02 | |||
| Marxist–Leninists Party | 6 | 0.02 | +0.02 | |||
| Total | 25,112 | |||||
| Source[20] | ||||||
| Parties | Vote | |||||
|---|---|---|---|---|---|---|
| Votes | % | + / - | ||||
| Social Democrats | 8,314 | 33.19 | -0.58 | |||
| Conservatives | 5,852 | 23.36 | +10.94 | |||
| Venstre | 3,386 | 13.52 | -1.40 | |||
| Green Left | 2,678 | 10.69 | +1.56 | |||
| Social Liberals | 1,506 | 6.01 | +0.09 | |||
| Centre Democrats | 1,179 | 4.71 | -4.66 | |||
| Progress Party | 890 | 3.55 | -5.99 | |||
| Christian People's Party | 439 | 1.75 | +0.32 | |||
| Justice Party of Denmark | 369 | 1.47 | +0.17 | |||
| Left Socialists | 303 | 1.21 | 0.00 | |||
| Communist Party of Denmark | 108 | 0.43 | -0.29 | |||
| Socialist Workers Party | 19 | 0.08 | 0.00 | |||
| Bent E. Jespersen | 9 | 0.04 | New | |||
| Marxist–Leninists Party | 1 | 0.00 | New | |||
| Total | 25,053 | |||||
| Source[21] | ||||||
| Parties | Vote | |||||
|---|---|---|---|---|---|---|
| Votes | % | + / - | ||||
| Social Democrats | 7,772 | 33.77 | -5.67 | |||
| Venstre | 3,433 | 14.92 | -1.11 | |||
| Conservatives | 2,859 | 12.42 | +1.53 | |||
| Progress Party | 2,196 | 9.54 | -2.38 | |||
| Centre Democrats | 2,157 | 9.37 | +5.97 | |||
| Green Left | 2,101 | 9.13 | +4.27 | |||
| Social Liberals | 1,363 | 5.92 | -0.23 | |||
| Christian People's Party | 330 | 1.43 | -0.15 | |||
| Justice Party of Denmark | 300 | 1.30 | -0.95 | |||
| Left Socialists | 278 | 1.21 | -0.80 | |||
| Communist Party of Denmark | 166 | 0.72 | -0.45 | |||
| Communist Workers Party | 36 | 0.16 | -0.14 | |||
| Socialist Workers Party | 18 | 0.08 | New | |||
| Kai Linde | 8 | 0.03 | New | |||
| Total | 23,017 | |||||
| Source[22] | ||||||
General elections in the 1970s
| Parties | Vote | |||||
|---|---|---|---|---|---|---|
| Votes | % | + / - | ||||
| Social Democrats | 9,199 | 39.44 | +2.55 | |||
| Venstre | 3,738 | 16.03 | +1.23 | |||
| Progress Party | 2,780 | 11.92 | -4.74 | |||
| Conservatives | 2,540 | 10.89 | +3.83 | |||
| Social Liberals | 1,435 | 6.15 | +1.44 | |||
| Green Left | 1,133 | 4.86 | +2.01 | |||
| Centre Democrats | 792 | 3.40 | -3.05 | |||
| Justice Party of Denmark | 525 | 2.25 | -0.72 | |||
| Left Socialists | 469 | 2.01 | +0.63 | |||
| Christian People's Party | 368 | 1.58 | -1.15 | |||
| Communist Party of Denmark | 273 | 1.17 | -1.48 | |||
| Communist Workers Party | 71 | 0.30 | New | |||
| Total | 23,323 | |||||
| Source[23] | ||||||
| Parties | Vote | |||||
|---|---|---|---|---|---|---|
| Votes | % | + / - | ||||
| Social Democrats | 8,425 | 36.89 | +6.93 | |||
| Progress Party | 3,804 | 16.66 | +1.74 | |||
| Venstre | 3,381 | 14.80 | -12.01 | |||
| Conservatives | 1,613 | 7.06 | +2.65 | |||
| Centre Democrats | 1,473 | 6.45 | +4.48 | |||
| Social Liberals | 1,076 | 4.71 | -3.42 | |||
| Justice Party of Denmark | 678 | 2.97 | +1.33 | |||
| Green Left | 651 | 2.85 | -0.92 | |||
| Christian People's Party | 624 | 2.73 | -1.75 | |||
| Communist Party of Denmark | 605 | 2.65 | -0.25 | |||
| Left Socialists | 315 | 1.38 | +0.38 | |||
| Pensioners' Party | 193 | 0.85 | New | |||
| Total | 22,838 | |||||
| Source[24] | ||||||
| Parties | Vote | |||||
|---|---|---|---|---|---|---|
| Votes | % | + / - | ||||
| Social Democrats | 6,725 | 29.96 | +4.27 | |||
| Venstre | 6,018 | 26.81 | +11.11 | |||
| Progress Party | 3,349 | 14.92 | -2.85 | |||
| Social Liberals | 1,824 | 8.13 | -4.15 | |||
| Christian People's Party | 1,005 | 4.48 | +1.59 | |||
| Conservatives | 990 | 4.41 | -2.69 | |||
| Green Left | 846 | 3.77 | -0.64 | |||
| Communist Party of Denmark | 652 | 2.90 | +0.91 | |||
| Centre Democrats | 442 | 1.97 | -6.88 | |||
| Justice Party of Denmark | 368 | 1.64 | -0.93 | |||
| Left Socialists | 225 | 1.00 | +0.27 | |||
| N. Vestergård Eriksen | 2 | 0.01 | New | |||
| Egon Larsen | 1 | 0.00 | New | |||
| Total | 22,447 | |||||
| Source[25] | ||||||
| Parties | Vote | |||||
|---|---|---|---|---|---|---|
| Votes | % | + / - | ||||
| Social Democrats | 5,745 | 25.69 | -12.91 | |||
| Progress Party | 3,975 | 17.77 | New | |||
| Venstre | 3,512 | 15.70 | -6.34 | |||
| Social Liberals | 2,746 | 12.28 | -3.24 | |||
| Centre Democrats | 1,980 | 8.85 | New | |||
| Conservatives | 1,589 | 7.10 | -4.33 | |||
| Green Left | 986 | 4.41 | -3.09 | |||
| Christian People's Party | 647 | 2.89 | +1.56 | |||
| Justice Party of Denmark | 575 | 2.57 | +0.61 | |||
| Communist Party of Denmark | 446 | 1.99 | +1.14 | |||
| Left Socialists | 164 | 0.73 | -0.04 | |||
| Total | 22,365 | |||||
| Source[26] | ||||||
| Parties | Vote | |||||
|---|---|---|---|---|---|---|
| Votes | % | + / - | ||||
| Social Democrats | 8,151 | 38.60 | +2.98 | |||
| Venstre | 4,655 | 22.04 | -1.37 | |||
| Social Liberals | 3,278 | 15.52 | -1.03 | |||
| Conservatives | 2,413 | 11.43 | -4.71 | |||
| Green Left | 1,583 | 7.50 | +2.63 | |||
| Justice Party of Denmark | 414 | 1.96 | +1.26 | |||
| Christian People's Party | 280 | 1.33 | New | |||
| Communist Party of Denmark | 179 | 0.85 | +0.43 | |||
| Left Socialists | 163 | 0.77 | -0.40 | |||
| Total | 21,116 | |||||
| Source[27] | ||||||
General elections in the 1960s
| Parties | Vote | |||||
|---|---|---|---|---|---|---|
| Votes | % | + / - | ||||
| Social Democrats | 6,635 | 35.62 | -4.85 | |||
| Venstre | 4,360 | 23.41 | -2.98 | |||
| Social Liberals | 3,083 | 16.55 | +6.38 | |||
| Conservatives | 3,006 | 16.14 | +4.98 | |||
| Green Left | 907 | 4.87 | -2.77 | |||
| Left Socialists | 218 | 1.17 | New | |||
| Liberal Centre | 159 | 0.85 | -0.91 | |||
| Justice Party of Denmark | 130 | 0.70 | -0.09 | |||
| Communist Party of Denmark | 78 | 0.42 | -0.06 | |||
| Independent Party | 50 | 0.27 | -0.88 | |||
| Total | 18,626 | |||||
| Source[28] | ||||||
| Parties | Vote | |||||
|---|---|---|---|---|---|---|
| Votes | % | + / - | ||||
| Social Democrats | 7,390 | 40.47 | -1.85 | |||
| Venstre | 4,818 | 26.39 | -0.57 | |||
| Conservatives | 2,037 | 11.16 | -1.35 | |||
| Social Liberals | 1,857 | 10.17 | +0.57 | |||
| Green Left | 1,395 | 7.64 | +3.88 | |||
| Liberal Centre | 321 | 1.76 | New | |||
| Independent Party | 210 | 1.15 | -0.66 | |||
| Justice Party of Denmark | 144 | 0.79 | -1.07 | |||
| Communist Party of Denmark | 87 | 0.48 | -0.04 | |||
| Total | 18,259 | |||||
| Source[29] | ||||||
| Parties | Vote | |||||
|---|---|---|---|---|---|---|
| Votes | % | + / - | ||||
| Social Democrats | 7,368 | 42.32 | +2.13 | |||
| Venstre | 4,695 | 26.96 | -0.85 | |||
| Conservatives | 2,179 | 12.51 | +1.17 | |||
| Social Liberals | 1,672 | 9.60 | -1.48 | |||
| Green Left | 655 | 3.76 | -0.69 | |||
| Justice Party of Denmark | 323 | 1.86 | -0.66 | |||
| Independent Party | 316 | 1.81 | -0.17 | |||
| Communist Party of Denmark | 91 | 0.52 | -0.10 | |||
| Peace Politics People's Party | 80 | 0.46 | New | |||
| Danish Unity | 33 | 0.19 | New | |||
| Total | 17,412 | |||||
| Source[30] | ||||||
| Parties | Vote | |||||
|---|---|---|---|---|---|---|
| Votes | % | + / - | ||||
| Social Democrats | 6,690 | 40.19 | +4.02 | |||
| Venstre | 4,628 | 27.81 | -4.72 | |||
| Conservatives | 1,888 | 11.34 | +1.88 | |||
| Social Liberals | 1,844 | 11.08 | -2.84 | |||
| Green Left | 740 | 4.45 | New | |||
| Justice Party of Denmark | 420 | 2.52 | -2.69 | |||
| Independent Party | 330 | 1.98 | +0.89 | |||
| Communist Party of Denmark | 104 | 0.62 | -1.00 | |||
| Total | 16,644 | |||||
| Source[31] | ||||||
General elections in the 1950s
| Parties | Vote | |||||
|---|---|---|---|---|---|---|
| Votes | % | + / - | ||||
| Social Democrats | 5,830 | 36.17 | -2.37 | |||
| Venstre | 5,243 | 32.53 | +2.65 | |||
| Social Liberals | 2,244 | 13.92 | -0.35 | |||
| Conservatives | 1,525 | 9.46 | -0.10 | |||
| Justice Party of Denmark | 840 | 5.21 | +1.34 | |||
| Communist Party of Denmark | 261 | 1.62 | -1.00 | |||
| Independent Party | 176 | 1.09 | -0.17 | |||
| Total | 16,119 | |||||
| Source[32] | ||||||
September 1953 Danish Folketing election
| Parties | Vote | |||||
|---|---|---|---|---|---|---|
| Votes | % | + / - | ||||
| Social Democrats | 5,921 | 38.54 | +1.51 | |||
| Venstre | 4,591 | 29.88 | +0.61 | |||
| Social Liberals | 2,193 | 14.27 | -0.56 | |||
| Conservatives | 1,469 | 9.56 | -0.16 | |||
| Justice Party of Denmark | 594 | 3.87 | -2.06 | |||
| Communist Party of Denmark | 402 | 2.62 | -0.25 | |||
| Independent Party | 193 | 1.26 | New | |||
| Total | 15,363 | |||||
| Source[33] | ||||||
April 1953 Danish Folketing election
| Parties | Vote | |||||
|---|---|---|---|---|---|---|
| Votes | % | + / - | ||||
| Social Democrats | 5,492 | 37.03 | +0.55 | |||
| Venstre | 4,341 | 29.27 | +2.74 | |||
| Social Liberals | 2,199 | 14.83 | -0.21 | |||
| Conservatives | 1,441 | 9.72 | +0.28 | |||
| Justice Party of Denmark | 879 | 5.93 | -3.84 | |||
| Communist Party of Denmark | 425 | 2.87 | +0.13 | |||
| Danish Unity | 54 | 0.36 | New | |||
| Total | 14,831 | |||||
| Source[34] | ||||||
1950 Danish Folketing election
| Parties | Vote | |||||
|---|---|---|---|---|---|---|
| Votes | % | + / - | ||||
| Social Democrats | 5,391 | 36.48 | +3.69 | |||
| Venstre | 3,920 | 26.53 | -8.37 | |||
| Social Liberals | 2,222 | 15.04 | -2.60 | |||
| Justice Party of Denmark | 1,443 | 9.77 | +5.69 | |||
| Conservatives | 1,395 | 9.44 | +3.23 | |||
| Communist Party of Denmark | 405 | 2.74 | -0.78 | |||
| Total | 14,776 | |||||
| Source[35] | ||||||
General elections in the 1940s
1947 Danish Folketing election
| Parties | Vote | |||||
|---|---|---|---|---|---|---|
| Votes | % | + / - | ||||
| Venstre | 21,810 | 34.90 | +9.26 | |||
| Social Democrats | 20,489 | 32.79 | +0.43 | |||
| Social Liberals | 11,023 | 17.64 | -0.37 | |||
| Conservatives | 3,878 | 6.21 | -3.24 | |||
| Justice Party of Denmark | 2,552 | 4.08 | +0.27 | |||
| Communist Party of Denmark | 2,200 | 3.52 | -5.74 | |||
| Danish Unity | 539 | 0.86 | -0.60 | |||
| Total | 62,491 | |||||
| Source[36] | ||||||
1945 Danish Folketing election
| Parties | Vote | |||||
|---|---|---|---|---|---|---|
| Votes | % | + / - | ||||
| Social Democrats | 4,929 | 32.36 | -8.85 | |||
| Venstre | 3,905 | 25.64 | +3.38 | |||
| Social Liberals | 2,744 | 18.01 | -1.85 | |||
| Conservatives | 1,440 | 9.45 | -1.73 | |||
| Communist Party of Denmark | 1,411 | 9.26 | New | |||
| Justice Party of Denmark | 581 | 3.81 | +0.67 | |||
| Danish Unity | 222 | 1.46 | +0.62 | |||
| Total | 15,232 | |||||
| Source[37] | ||||||
1943 Danish Folketing election
| Parties | Vote | |||||
|---|---|---|---|---|---|---|
| Votes | % | + / - | ||||
| Social Democrats | 6,265 | 41.21 | +4.03 | |||
| Venstre | 3,384 | 22.26 | +0.15 | |||
| Social Liberals | 3,019 | 19.86 | -1.53 | |||
| Conservatives | 1,699 | 11.18 | +1.17 | |||
| Justice Party of Denmark | 478 | 3.14 | -1.05 | |||
| National Socialist Workers' Party of Denmark | 178 | 1.17 | -0.84 | |||
| Danish Unity | 127 | 0.84 | +0.77 | |||
| Farmers' Party | 51 | 0.34 | -0.25 | |||
| Total | 15,201 | |||||
| Source[38] | ||||||
General elections in the 1930s
1939 Danish Folketing election
| Parties | Vote | |||||
|---|---|---|---|---|---|---|
| Votes | % | + / - | ||||
| Social Democrats | 5,020 | 37.18 | -3.95 | |||
| Venstre | 2,986 | 22.11 | +0.75 | |||
| Social Liberals | 2,888 | 21.39 | +0.44 | |||
| Conservatives | 1,352 | 10.01 | -0.22 | |||
| Justice Party of Denmark | 566 | 4.19 | +0.13 | |||
| National Socialist Workers' Party of Denmark | 271 | 2.01 | +1.45 | |||
| Communist Party of Denmark | 264 | 1.96 | +1.35 | |||
| Farmers' Party | 79 | 0.59 | -0.52 | |||
| National Cooperation | 68 | 0.50 | New | |||
| Danish Unity | 9 | 0.07 | New | |||
| Total | 13,503 | |||||
| Source[39] | ||||||
1935 Danish Folketing election
| Parties | Vote | |||||
|---|---|---|---|---|---|---|
| Votes | % | + / - | ||||
| Social Democrats | 5,423 | 41.13 | +3.57 | |||
| Venstre | 2,816 | 21.36 | -4.23 | |||
| Social Liberals | 2,762 | 20.95 | -1.57 | |||
| Conservatives | 1,349 | 10.23 | -0.21 | |||
| Justice Party of Denmark | 535 | 4.06 | +0.51 | |||
| Independent People's Party | 146 | 1.11 | New | |||
| Communist Party of Denmark | 80 | 0.61 | +0.26 | |||
| National Socialist Workers' Party of Denmark | 74 | 0.56 | New | |||
| Total | 13,185 | |||||
| Source[40] | ||||||
1932 Danish Folketing election
| Parties | Vote | |||||
|---|---|---|---|---|---|---|
| Votes | % | + / - | ||||
| Social Democrats | 4,909 | 37.56 | +1.43 | |||
| Venstre | 3,345 | 25.59 | -1.20 | |||
| Social Liberals | 2,943 | 22.52 | -3.82 | |||
| Conservatives | 1,364 | 10.44 | +2.25 | |||
| Justice Party of Denmark | 464 | 3.55 | +1.11 | |||
| Communist Party of Denmark | 46 | 0.35 | +0.24 | |||
| Total | 13,071 | |||||
| Source[41] | ||||||
General elections in the 1920s
1929 Danish Folketing election
| Parties | Vote | |||||
|---|---|---|---|---|---|---|
| Votes | % | + / - | ||||
| Social Democrats | 4,437 | 36.13 | +5.52 | |||
| Venstre | 3,290 | 26.79 | -0.85 | |||
| Social Liberals | 3,234 | 26.34 | -5.77 | |||
| Conservatives | 1,006 | 8.19 | -0.36 | |||
| Justice Party of Denmark | 299 | 2.44 | +1.35 | |||
| Communist Party of Denmark | 13 | 0.11 | New | |||
| Total | 12,279 | |||||
| Source[42] | ||||||
1926 Danish Folketing election
| Parties | Vote | |||||
|---|---|---|---|---|---|---|
| Votes | % | + / - | ||||
| Social Liberals | 3,748 | 32.11 | -2.20 | |||
| Social Democrats | 3,573 | 30.61 | +1.03 | |||
| Venstre | 3,226 | 27.64 | +1.41 | |||
| Conservatives | 998 | 8.55 | +0.14 | |||
| Justice Party of Denmark | 127 | 1.09 | -0.15 | |||
| Total | 11,672 | |||||
| Source[43] | ||||||
1924 Danish Folketing election
| Parties | Vote | |||||
|---|---|---|---|---|---|---|
| Votes | % | + / - | ||||
| Social Liberals | 4,024 | 34.31 | -0.60 | |||
| Social Democrats | 3,469 | 29.58 | +3.30 | |||
| Venstre | 3,077 | 26.23 | -1.04 | |||
| Conservatives | 986 | 8.41 | -2.00 | |||
| Justice Party of Denmark | 146 | 1.24 | New | |||
| Farmer Party | 21 | 0.18 | New | |||
| Communist Party of Denmark | 6 | 0.05 | New | |||
| Total | 11,729 | |||||
| Source[44] | ||||||
September 1920 Danish Folketing election
| Parties | Vote | |||||
|---|---|---|---|---|---|---|
| Votes | % | + / - | ||||
| Social Liberals | 3,938 | 34.91 | -2.04 | |||
| Venstre | 3,076 | 27.27 | -0.58 | |||
| Social Democrats | 2,964 | 26.28 | +3.40 | |||
| Conservatives | 1,174 | 10.41 | -0.75 | |||
| Industry Party | 128 | 1.13 | -0.04 | |||
| Total | 11,280 | |||||
| Source[45] | ||||||
July 1920 Danish Folketing election
| Parties | Vote | |||||
|---|---|---|---|---|---|---|
| Votes | % | + / - | ||||
| Social Liberals | 3,512 | 36.95 | -0.91 | |||
| Venstre | 2,647 | 27.85 | +0.35 | |||
| Social Democrats | 2,175 | 22.88 | +0.58 | |||
| Conservatives | 1,061 | 11.16 | +0.21 | |||
| Industry Party | 111 | 1.17 | -0.22 | |||
| Total | 9,506 | |||||
| Source[46] | ||||||
April 1920 Danish Folketing election
| Parties | Vote | |||||
|---|---|---|---|---|---|---|
| Votes | % | |||||
| Social Liberals | 3,727 | 37.86 | ||||
| Venstre | 2,707 | 27.50 | ||||
| Social Democrats | 2,195 | 22.30 | ||||
| Conservatives | 1,078 | 10.95 | ||||
| Industry Party | 137 | 1.39 | ||||
| Total | 9,844 | |||||
| Source[47] | ||||||
European Parliament elections results
2019 European Parliament election in Denmark
| Parties | Vote | |||||
|---|---|---|---|---|---|---|
| Votes | % | + / - | ||||
| Social Democrats | 9,162 | 24.00 | +6.15 | |||
| Venstre | 8,768 | 22.97 | +5.81 | |||
| Danish People's Party | 6,448 | 16.89 | -18.26 | |||
| Green Left | 4,152 | 10.88 | +1.85 | |||
| Social Liberals | 2,529 | 6.63 | +2.29 | |||
| Red–Green Alliance | 2,036 | 5.33 | New | |||
| People's Movement against the EU | 1,895 | 4.96 | -3.83 | |||
| Conservatives | 1,671 | 4.38 | -1.61 | |||
| The Alternative | 909 | 2.38 | New | |||
| Liberal Alliance | 601 | 1.57 | -0.13 | |||
| Total | 38,171 | |||||
| Source[48] | ||||||
2014 European Parliament election in Denmark
| Parties | Vote | |||||
|---|---|---|---|---|---|---|
| Votes | % | + / - | ||||
| Danish People's Party | 11,722 | 35.15 | +14.54 | |||
| Social Democrats | 5,952 | 17.85 | -1.95 | |||
| Venstre | 5,722 | 17.16 | -4.61 | |||
| Green Left | 3,010 | 9.03 | -6.36 | |||
| People's Movement against the EU | 2,931 | 8.79 | +1.85 | |||
| Conservatives | 1,996 | 5.99 | -3.64 | |||
| Social Liberals | 1,446 | 4.34 | +1.25 | |||
| Liberal Alliance | 568 | 1.70 | +1.33 | |||
| Total | 33,347 | |||||
| Source[49] | ||||||
2009 European Parliament election in Denmark
| Parties | Vote | |||||
|---|---|---|---|---|---|---|
| Votes | % | + / - | ||||
| Venstre | 7,488 | 21.77 | -0.11 | |||
| Danish People's Party | 7,090 | 20.61 | +12.48 | |||
| Social Democrats | 6,812 | 19.80 | -14.78 | |||
| Green Left | 5,294 | 15.39 | +8.20 | |||
| Conservatives | 3,314 | 9.63 | +0.53 | |||
| People's Movement against the EU | 2,388 | 6.94 | +2.30 | |||
| Social Liberals | 1,063 | 3.09 | -2.33 | |||
| June Movement | 821 | 2.39 | -5.99 | |||
| Liberal Alliance | 126 | 0.37 | New | |||
| Total | 34,396 | |||||
| Source[50] | ||||||
2004 European Parliament election in Denmark
| Parties | Vote | |||||
|---|---|---|---|---|---|---|
| Votes | % | + / - | ||||
| Social Democrats | 4,705 | 34.58 | +14.70 | |||
| Venstre | 2,978 | 21.88 | -1.94 | |||
| Conservatives | 1,239 | 9.10 | +1.83 | |||
| June Movement | 1,141 | 8.38 | -9.25 | |||
| Danish People's Party | 1,107 | 8.13 | +1.97 | |||
| Green Left | 978 | 7.19 | +1.02 | |||
| Social Liberals | 738 | 5.42 | -1.90 | |||
| People's Movement against the EU | 632 | 4.64 | -1.95 | |||
| Christian Democrats | 90 | 0.66 | -0.56 | |||
| Total | 13,608 | |||||
| Source[51] | ||||||
1999 European Parliament election in Denmark
| Parties | Vote | |||||
|---|---|---|---|---|---|---|
| Votes | % | + / - | ||||
| Venstre | 3,375 | 23.82 | +2.28 | |||
| Social Democrats | 2,817 | 19.88 | +0.78 | |||
| June Movement | 2,498 | 17.63 | +3.03 | |||
| Social Liberals | 1,037 | 7.32 | -1.10 | |||
| Conservatives | 1,030 | 7.27 | -8.48 | |||
| People's Movement against the EU | 934 | 6.59 | -2.23 | |||
| Green Left | 874 | 6.17 | -0.69 | |||
| Danish People's Party | 873 | 6.16 | New | |||
| Centre Democrats | 557 | 3.93 | +2.75 | |||
| Christian Democrats | 173 | 1.22 | +0.61 | |||
| Progress Party | 94 | 0.66 | -2.46 | |||
| Total | 14,168 | |||||
| Source[52] | ||||||
1994 European Parliament election in Denmark
| Parties | Vote | |||||
|---|---|---|---|---|---|---|
| Votes | % | + / - | ||||
| Venstre | 3,204 | 21.54 | +1.78 | |||
| Social Democrats | 2,842 | 19.10 | -7.43 | |||
| Conservatives | 2,343 | 15.75 | +5.36 | |||
| June Movement | 2,172 | 14.60 | New | |||
| People's Movement against the EU | 1,312 | 8.82 | -6.61 | |||
| Social Liberals | 1,253 | 8.42 | +5.44 | |||
| Green Left | 1,021 | 6.86 | -1.80 | |||
| Progress Party | 464 | 3.12 | -2.74 | |||
| Centre Democrats | 175 | 1.18 | -7.60 | |||
| Christian Democrats | 90 | 0.61 | -1.00 | |||
| Total | 14,876 | |||||
| Source[53] | ||||||
1989 European Parliament election in Denmark
| Parties | Vote | |||||
|---|---|---|---|---|---|---|
| Votes | % | + / - | ||||
| Social Democrats | 3,533 | 26.53 | +5.13 | |||
| Venstre | 2,632 | 19.76 | +1.50 | |||
| People's Movement against the EU | 2,055 | 15.43 | -1.09 | |||
| Conservatives | 1,383 | 10.39 | -8.39 | |||
| Centre Democrats | 1,169 | 8.78 | +1.55 | |||
| Green Left | 1,153 | 8.66 | +0.78 | |||
| Progress Party | 780 | 5.86 | +2.35 | |||
| Social Liberals | 397 | 2.98 | -0.93 | |||
| Christian Democrats | 215 | 1.61 | -0.24 | |||
| Total | 13,317 | |||||
| Source[54] | ||||||
1984 European Parliament election in Denmark
| Parties | Vote | |||||
|---|---|---|---|---|---|---|
| Votes | % | |||||
| Social Democrats | 3,095 | 21.40 | ||||
| Conservatives | 2,717 | 18.78 | ||||
| Venstre | 2,641 | 18.26 | ||||
| People's Movement against the EU | 2,389 | 16.52 | ||||
| Green Left | 1,140 | 7.88 | ||||
| Centre Democrats | 1,046 | 7.23 | ||||
| Social Liberals | 566 | 3.91 | ||||
| Progress Party | 508 | 3.51 | ||||
| Christian Democrats | 267 | 1.85 | ||||
| Left Socialists | 96 | 0.66 | ||||
| Total | 14,465 | |||||
| Source[55] | ||||||
Referendums
2022 Danish European Union opt-out referendum[56]
| Option | Votes | % |
|---|---|---|
| ✓ YES | 24,685 | 60.00 |
| X NO | 16,460 | 40.00 |
2015 Danish European Union opt-out referendum[57]
| Option | Votes | % |
|---|---|---|
| X NO | 27,582 | 61.32 |
| ✓ YES | 17,400 | 38.68 |
2014 Danish Unified Patent Court membership referendum[58]
| Option | Votes | % |
|---|---|---|
| ✓ YES | 19,388 | 59.14 |
| X NO | 13,393 | 40.86 |
2009 Danish Act of Succession referendum[59]
| Option | Votes | % |
|---|---|---|
| ✓ YES | 27,701 | 84.54 |
| X NO | 5,065 | 15.46 |
2000 Danish euro referendum[60]
| Option | Votes | % |
|---|---|---|
| X NO | 15,069 | 58.14 |
| ✓ YES | 10,850 | 41.86 |
1998 Danish Amsterdam Treaty referendum[61]
| Option | Votes | % |
|---|---|---|
| ✓ YES | 11,868 | 52.61 |
| X NO | 10,692 | 47.39 |
1993 Danish Maastricht Treaty referendum[62]
| Option | Votes | % |
|---|---|---|
| ✓ YES | 14,404 | 56.27 |
| X NO | 11,196 | 43.73 |
1992 Danish Maastricht Treaty referendum[63]
| Option | Votes | % |
|---|---|---|
| X NO | 12,195 | 50.06 |
| ✓ YES | 12,165 | 49.94 |
1986 Danish Single European Act referendum[64]
| Option | Votes | % |
|---|---|---|
| ✓ YES | 12,516 | 57.58 |
| X NO | 9,219 | 42.42 |
1972 Danish European Communities membership referendum[65]
| Option | Votes | % |
|---|---|---|
| ✓ YES | 15,526 | 69.26 |
| X NO | 6,892 | 30.74 |
1953 Danish constitutional and electoral age referendum[66]
| Option | Votes | % |
|---|---|---|
| ✓ YES | 10,817 | 89.01 |
| X NO | 1,336 | 10.99 |
| 23 years | 6,869 | 55.23 |
| 21 years | 5,568 | 44.77 |
1939 Danish constitutional referendum[67]
| Option | Votes | % |
|---|---|---|
| ✓ YES | 8,149 | 92.22 |
| X NO | 687 | 7.78 |
References
- "Kalundborgkredsen". kmdvalg.dk (in Danish). Retrieved 2023-06-05.
- "Beretning om Forhandlingerne paa Rigsdagen". Rigsdagstidende. II: Spalte 3892 ff.
- "Nye valgkredse fordeler stemmerne anderledes". dr.dk (in Danish). Retrieved 2023-06-05.
- "Beretning om nye valgkredse som følge af kommunalreformen" (in Danish). Retrieved 2023-06-05.
- "Det danske valgsystem: Valg til Folketinget". valg.im (in Danish). Retrieved 2023-06-05.
- "38 Kalundborg". dataforsyningen.dk (in Danish). Retrieved 2023-06-05.
- "Beretning om Forhandlingerne paa Rigsdagen". Rigsdagstidende. II: Spalte 3892 ff.
- "Valgresultater fra tidligere valg:". kmdvalg (in Danish). Retrieved 2023-06-05.
- "FOLKETINGSVALG TIRSDAG 1. NOVEMBER 2022". valg.im (in Danish). Retrieved 2023-06-27.
- "FOLKETINGSVALG ONSDAG 5. JUNI 2019". valg.im (in Danish). Retrieved 2023-06-27.
- "FOLKETINGSVALG TORSDAG 18. JUNI 2015". valg.im (in Danish). Retrieved 2023-06-27.
- "FOLKETINGSVALG TORSDAG 15. SEPTEMBER 2011". valg.im (in Danish). Retrieved 2023-06-27.
- "Folketingsvalget den 13. november 2007". valg.im (in Danish). Retrieved 2023-06-27.
- "valg2005.book" (PDF). valg.im (in Danish). Retrieved 2023-06-27.
- "BMTABEL" (PDF). valg.im (in Danish). Retrieved 2023-06-27.
- "VALG98" (PDF). valg.im (in Danish). Retrieved 2023-06-27.
- "VALG94" (PDF). valg.im (in Danish). Retrieved 2023-06-27.
- "VALG90" (PDF). valg.im (in Danish). Retrieved 2023-06-27.
- "Folketingsvalget den 10. maj 1988". valg.im (in Danish). Retrieved 2023-06-27.
- "Folketingsvalget den 8.september 1987". dst.dk (in Danish). Retrieved 2023-06-27.
- "Folketingsvalget den 10. januar 1984". dst.dk (in Danish). Retrieved 2023-06-27.
- "Folketingsvalget den 8. december 1981". dst.dk (in Danish). Retrieved 2023-06-27.
- "Folketingsvalget den 23. oktober 1979". dst.dk (in Danish). Retrieved 2023-06-27.
- "Folketingsvalget den 15. februar 1977". dst.dk (in Danish). Retrieved 2023-06-27.
- "Folketingsvalget den 9. januar 1975". dst.dk (in Danish). Retrieved 2023-06-27.
- "Folketingsvalget den 4. december 1973". dst.dk (in Danish). Retrieved 2023-06-27.
- "Folketingsvalget den 21. september 1971 samt folkeafstemningen". dst.dk (in Danish). Retrieved 2023-06-27.
- "Folketingsvalget den 23. januar 1968". dst.dk (in Danish). Retrieved 2023-06-27.
- "Folketingsvalget den 22. november 1966". dst.dk (in Danish). Retrieved 2023-06-27.
- "Folketingsvalget den 22. september 1964". dst.dk (in Danish). Retrieved 2023-06-27.
- "Folketingsvalget den 15. november 1960". dst.dk (in Danish). Retrieved 2023-06-27.
- "Folketingsvalget den 14. maj 1957". dst.dk (in Danish). Retrieved 2023-06-27.
- "Folketingsvalget den 22. september 1953". dst.dk (in Danish). Retrieved 2023-06-27.
- "Rigsdagsvalgene og folkeafstemningerne i april og maj 1953". dst.dk (in Danish). Retrieved 2023-06-27.
- "Folketingsvalget den 5. september 1950". dst.dk (in Danish). Retrieved 2023-06-27.
- "Folketingsvalget den 28. oktober 1947". dst.dk (in Danish). Retrieved 2023-06-27.
- "Rigsdagsvalgene i oktober og november 1945". dst.dk (in Danish). Retrieved 2023-06-27.
- "Rigsdagsvalgene i marts og april 1943". dst.dk (in Danish). Retrieved 2023-06-27.
- "Rigsdagsvalgene og Folkeafstemningen i april og maj 1939". dst.dk (in Danish). Retrieved 2023-06-27.
- "Folketingsvalget den 22. oktober 1935". dst.dk (in Danish). Retrieved 2023-06-27.
- "Folketingsvalget den 16. november 1932". dst.dk (in Danish). Retrieved 2023-06-27.
- "Folketingsvalget den 24. april 1929". dst.dk (in Danish). Retrieved 2023-06-27.
- "Folketingsvalget den 2. december 1926". dst.dk (in Danish). Retrieved 2023-06-27.
- "Folketingsvalget den 11. april 1924". dst.dk (in Danish). Retrieved 2023-06-27.
- "Rigsdagsvalgene september-oktober 1920". dst.dk (in Danish). Retrieved 2023-06-27.
- "Rigsdagsvalgene juli-august 1920". dst.dk (in Danish). Retrieved 2023-06-27.
- "Folketingsvalget den 26. april 1920". dst.dk (in Danish). Retrieved 2023-06-27.
- "EUROPA-PARLAMENTSVALG SØNDAG 26. MAJ 2019". dst.dk (in Danish). Retrieved 2023-07-01.
- "EUROPA-PARLAMENTSVALG SØNDAG 25. MAJ 2014". dst.dk (in Danish). Retrieved 2023-07-01.
- "EUROPA-PARLAMENTSVALG SØNDAG 7. JUNI 2009". dst.dk (in Danish). Retrieved 2023-07-01.
- "EUROPA-PARLAMENTSVALGET DEN 13. JUNI 2004" (PDF). im.dk (in Danish). Retrieved 2023-07-01.
- "VALGET TIL EUROPA-PARLAMENTET DEN 10. JUNI 1999" (PDF). im.dk (in Danish). Retrieved 2023-07-01.
- "VALGET TIL EUROPA-PARLAMENTET DEN 9. JUNI 1994" (PDF). im.dk (in Danish). Retrieved 2023-07-01.
- "Valget til Europa-parlamentet den 15. juni 1989". dst.dk (in Danish). Retrieved 2023-07-01.
- "Valget til Europa-Parlamentet den 14. juni 1984". dst.dk (in Danish). Retrieved 2023-07-01.
- "FOLKEAFSTEMNING ONSDAG 1. JUNI 2022". dst.dk (in Danish). Retrieved 2023-07-05.
- "FOLKEAFSTEMNING TORSDAG 3. DECEMBER 2015". dst.dk (in Danish). Retrieved 2023-07-05.
- "FOLKEAFSTEMNING SØNDAG 25. MAJ 2014". dst.dk (in Danish). Retrieved 2023-07-05.
- "FOLKEAFSTEMNING SØNDAG 7. JUNI 2009". dst.dk (in Danish). Retrieved 2023-07-05.
- "FOLKEAFSTEMNINGEN DEN 28. SEPTEMBER 2000 OM DANMARKS DELTAGELSE I DEN FÆLLES VALUTA" (PDF). valg.im (in Danish). Retrieved 2023-07-05.
- "FOLKEAFSTEMNINGEN DEN 28. MAJ 1998OM DANMARKS TILTRÆDELSE AF AMSTERDAMTRAKTATEN" (PDF). valg.im (in Danish). Retrieved 2023-07-05.
- "FOLKEAFSTEMNINGEN DEN 18. MAJ 1993 OM DANMARKS TILTRÆDELSE AF EDINBURGH-AFGØRELSEN OG MAASTRICHT-TRAKTATEN". dst.dk (in Danish). Retrieved 2023-07-05.
- "Folkeafstemningen den 1. juni 1992 om Danmarks tiltrædelse af traktaten om Den Europæiske Union". dst.dk (in Danish). Retrieved 2023-07-05.
- "Vejledende folkeafstemning torsdag den 27. februar 1986 om Danmarks tiltrædelse af EF- pakken". dst.dk (in Danish). Retrieved 2023-07-05.
- "Folkeafstemningen om Danmarks tiltrædelse af De europæiske Fælleskaber 2. oktober 1972". dst.dk (in Danish). Retrieved 2023-07-05.
- "Publikationsfortegnelse vedrørende Folkeafstemninger". dst.dk (in Danish). Retrieved 2023-07-05.
- "Publikationsfortegnelse vedrørende Folkeafstemninger". dst.dk (in Danish). Retrieved 2023-07-05.