Le'an County
Le'an County (simplified Chinese: 乐安县; traditional Chinese: 樂安縣; pinyin: Lè'ān Xiàn) is a county of central Jiangxi province, People's Republic of China. It is under the jurisdiction of the prefecture-level city of Fuzhou.
Le'an County
乐安县 Loan | |
|---|---|
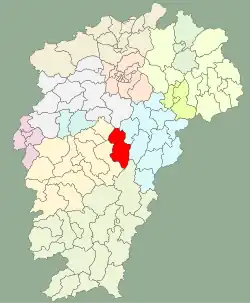 | |
| Coordinates: 27°23′N 115°50′E | |
| Country | People's Republic of China |
| Province | Jiangxi |
| Prefecture-level city | Fuzhou |
| Area | |
| • Total | 2,412.59 km2 (931.51 sq mi) |
| Population ((2018)) | |
| • Total | 365,000 |
| • Density | 150/km2 (390/sq mi) |
| Time zone | UTC+8 (China Standard) |
| Postal Code | 344300 |
Administrative divisions
In the present, Le'an County has 9 towns, 5 townships and 1 ethic township.[1]
- 9 towns
|
|
- 5 townships
|
|
- 1 ethic township
- Jinzhu She ethic township (金竹畲族乡)
Demographics
The population of the district was 335,878 in 1999.[2]
Climate
| Climate data for Le'an (1991–2020 normals, extremes 1981–2010) | |||||||||||||
|---|---|---|---|---|---|---|---|---|---|---|---|---|---|
| Month | Jan | Feb | Mar | Apr | May | Jun | Jul | Aug | Sep | Oct | Nov | Dec | Year |
| Record high °C (°F) | 26.3 (79.3) |
30.7 (87.3) |
32.6 (90.7) |
35.2 (95.4) |
36.3 (97.3) |
37.1 (98.8) |
40.7 (105.3) |
40.0 (104.0) |
37.7 (99.9) |
35.8 (96.4) |
32.0 (89.6) |
27.3 (81.1) |
40.7 (105.3) |
| Average high °C (°F) | 10.2 (50.4) |
13.4 (56.1) |
17.1 (62.8) |
23.7 (74.7) |
28.0 (82.4) |
30.6 (87.1) |
34.1 (93.4) |
33.3 (91.9) |
29.6 (85.3) |
24.7 (76.5) |
19.1 (66.4) |
13.0 (55.4) |
23.1 (73.5) |
| Daily mean °C (°F) | 5.8 (42.4) |
8.4 (47.1) |
12.2 (54.0) |
18.4 (65.1) |
22.9 (73.2) |
26.1 (79.0) |
29.0 (84.2) |
28.2 (82.8) |
24.7 (76.5) |
19.3 (66.7) |
13.5 (56.3) |
7.7 (45.9) |
18.0 (64.4) |
| Average low °C (°F) | 2.9 (37.2) |
5.2 (41.4) |
8.8 (47.8) |
14.5 (58.1) |
19.1 (66.4) |
22.7 (72.9) |
24.9 (76.8) |
24.4 (75.9) |
21.0 (69.8) |
15.4 (59.7) |
9.6 (49.3) |
4.1 (39.4) |
14.4 (57.9) |
| Record low °C (°F) | −6.8 (19.8) |
−7.7 (18.1) |
−4.8 (23.4) |
0.8 (33.4) |
8.4 (47.1) |
12.0 (53.6) |
17.9 (64.2) |
18.2 (64.8) |
11.7 (53.1) |
1.2 (34.2) |
−3.2 (26.2) |
−11.1 (12.0) |
−11.1 (12.0) |
| Average precipitation mm (inches) | 83.4 (3.28) |
104.8 (4.13) |
204.7 (8.06) |
215.3 (8.48) |
233.0 (9.17) |
294.1 (11.58) |
174.8 (6.88) |
150.4 (5.92) |
78.7 (3.10) |
59.2 (2.33) |
86.6 (3.41) |
65.2 (2.57) |
1,750.2 (68.91) |
| Average precipitation days (≥ 0.1 mm) | 13.4 | 13.9 | 19.0 | 17.7 | 17.0 | 16.4 | 11.3 | 12.1 | 8.0 | 7.1 | 9.8 | 10.4 | 156.1 |
| Average snowy days | 2.8 | 1.6 | 0.2 | 0 | 0 | 0 | 0 | 0 | 0 | 0 | 0 | 0.8 | 5.4 |
| Average relative humidity (%) | 81 | 81 | 82 | 80 | 79 | 80 | 73 | 76 | 77 | 75 | 78 | 77 | 78 |
| Mean monthly sunshine hours | 77.2 | 77.0 | 78.7 | 104.7 | 125.9 | 127.7 | 223.1 | 192.7 | 149.4 | 147.0 | 123.4 | 116.8 | 1,543.6 |
| Percent possible sunshine | 23 | 24 | 21 | 27 | 30 | 31 | 53 | 48 | 41 | 42 | 38 | 36 | 35 |
| Source: China Meteorological Administration[3][4] | |||||||||||||
Notes and references
- "南京市-行政区划网 www.xzqh.org" (in Chinese). XZQH. Retrieved 2012-05-24.
- (in English) National Population Statistics Materials by County and City - 1999 Period, in China County & City Population 1999, Harvard China Historical GIS
- 中国气象数据网 – WeatherBk Data (in Simplified Chinese). China Meteorological Administration. Retrieved 28 June 2023.
- 中国气象数据网 (in Simplified Chinese). China Meteorological Administration. Retrieved 28 June 2023.
This article is issued from Wikipedia. The text is licensed under Creative Commons - Attribution - Sharealike. Additional terms may apply for the media files.