List of metropolitan areas in the Americas
The list of metropolitan areas in the Americas has the top 50 most populous as of 2022, the most recent year of census results or projections. Where available, it uses official definitions of metropolitan areas based on one urban core and immediate surroundings, as opposed to polycentric conurbations. Figures refer to mid-2022 populations except in Mexican metropolitan areas, whose figures are derived from the 2022 Intercensal Survey conducted by INEGI with a reference date of 27 January 2022.[1]
.jpg.webp)
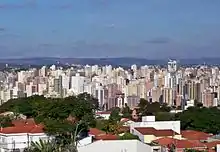
São Paulo is the largest metropolitan area in the Americas.
List
Gallery
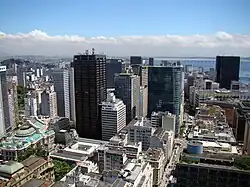
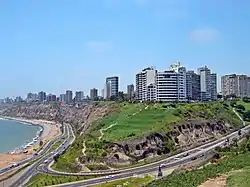
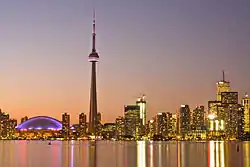
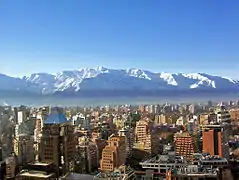
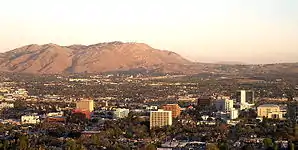
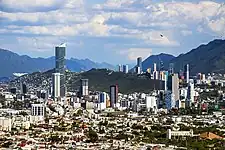
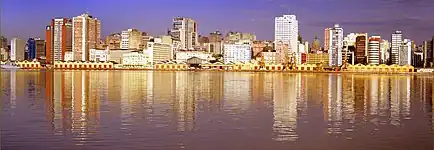
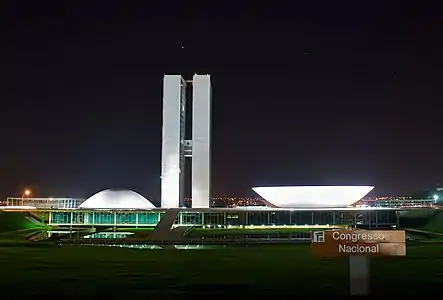
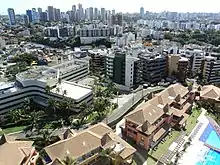
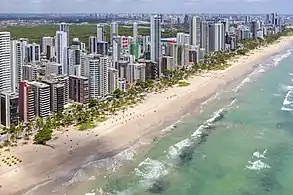
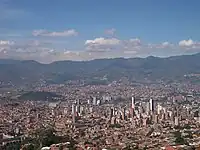
- Largest metropolitan areas in the Americas


.jpg.webp)


.jpg.webp)


.jpg.webp)

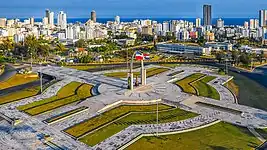 Santo Domingo


.jpg.webp)

Notes
- These are current definitions of Mexican metropolitan areas.[3]
- Population estimates for these metropolitan areas are from CONAPO's document, compiled from the results of the 2015 Intercensal Survey.[4]
- INDEC defines Greater Buenos Aires as comprising the Autonomous City of Buenos Aires plus 24 partidos of Buenos Aires Province, namely Almirante Brown, Avellaneda, Berazategui, Esteban Echeverría, Ezeiza, Florencio Varela, Hurlingham, Ituzaingó, José C. Paz, La Matanza, Lanús, Lomas de Zamora, Malvinas Argentinas, Merlo, Moreno, Morón, Quilmes, San Fernando, San Isidro, San Miguel, Tigre and Vicente López.[7]
- DANE defines the metropolitan area of Bogotá as comprising the Capital District and 17 municipalities in Cundinamarca: Soacha, Facatativá, Zipaquirá, Chía, Mosquera, Madrid, Funza, Cajicá, Sibaté, Tocancipá, La Calera, Sopó, Tabio, Tenjo, Cota, Gachancipá and Bojacá.[10]
- INEI defines the Lima Metropolitan Area as comprising Lima Province and the Constitutional Province of Callao.[12]
- The government of the Santiago Metropolitan Region defines the metropolitan area of Santiago as comprising Santiago Province, Cordillera Province and two communes (Calera de Tango and San Bernardo) in Maipo Province.[16]
- Population projection is that of the Sistema Metropolitano de Caracas, which comprises the five municipalities of the Metropolitan District of Caracas as well as the Altos Mirandinos Metropolitan Area, Guarenas-Guatire conurbation, Litoral Varguense conurbation and Valles del Tuy Metropolitan Area.[18][19]
- The Metropolitan Area of the Aburrá Valley comprises the municipalities of Barbosa, Bello, Caldas, Copacabana, Envigado, Girardota, Itagüí, La Estrella, Medellín proper and Sabaneta.[10]
- Population projection is that of the future Metropolitan District of Guayaquil, which will comprise the cantons of Guayaquil proper, Durán and Samborondón.[22]
- DANE defines the metropolitan area of Cali as comprising the municipalities of Cali proper, Jamundí, Palmira and Yumbo.[10]
- In 2005, Guatemala City's metropolitan area was defined by its government as comprising the municipalities of Amatitlán, Chinautla, Guatemala City proper, Mixco, San Miguel Petapa, Santa Catarina Pinula, Villa Canales and Villa Nueva.[24]
- Population projection combines that of Asunción proper with 29 surrounding districts to form the Región Metropolitana de Asunción (Metropolitan Region of Asunción)."[26]
- Population projection combines that of Quito proper with Rumiñahui Canton, which "is clearly within the suburban zone of the city of Quito."[27]
References
- "Encuesta Intercensal 2015: Presentación de resultados" (PDF). INEGI. p. 5. Retrieved 2016-11-08.
- "IBGE releases population estimates of the municipalities in 2015". IBGE. 2015-08-25. Retrieved 2016-04-25.
- "Delimitación de las zonas metropolitanas de México 2015" (in Spanish). Consejo Nacional de Población. Retrieved 2021-01-01.
- "INEGI Cuéntame, Información for Entidad" (in Spanish). INEGI. Retrieved 2021-01-01.
- Bureau, U. S. Census. "U.S. Census website". United States Census Bureau. Retrieved 2019-03-16.
- "Revised Delineations of Metropolitan Statistical Areas, Micropolitan Statistical Areas, and Combined Statistical Areas, and Guidance on Uses of the Delineations of These Areas" (PDF). Office of Management and Budget. March 6, 2020. 0MB BULLETIN NO. 20-01. Retrieved December 6, 2021.
- ¿Qué es el Gran Buenos Aires? (PDF) (Report). INDEC. 2005. Archived from the original (PDF) on 2017-10-23. Retrieved 2016-04-25.
- "Población estimada al 1 de julio de cada año calendario por sexo, según comuna. Ciudad Autónoma de Buenos Aires. Años 2010-2025". INDEC. Archived from the original on 2015-06-12. Retrieved 2016-04-23.
- "Población estimada al 1 de julio de cada año calendario por sexo, según partido. Provincia de Buenos Aires. Años 2010-2025". INDEC. Archived from the original on 2015-09-24. Retrieved 2016-04-23.
- "Censo 2005" (PDF). DANE. Retrieved 2016-04-25.
- "ESTIMACIONES DE POBLACIÓN 1985 - 2005 Y PROYECCIONES DE POBLACIÓN 2005 - 2020 TOTAL MUNICIPAL POR ÁREA". DANE. 2011-05-12. Retrieved 2016-04-25.
- "PERÚ: LISTADO DE DISTRITOS QUE CONFORMAN LAS CIUDADES PRINCIPALES, SEGÚN DEPARTAMENTO". Perú: Estimaciones y Proyecciones de Población total y edades quinquenales, según Departamento, Provincia y Distrito, 2005-2015. INEI. November 2010. Retrieved 2016-04-23.
- "Cuadro Nº 11. Perú: Población total al 30 de junio, por grupos quinquenales de edad, según departamento y provincia, 2015". Perú: Estimaciones y Proyecciones de Población total y edades quinquenales, según Departamento, Provincia y Distrito, 2005-2015. INEI. November 2010. Retrieved 2016-04-23.
- "Combined, Washington-Baltimore now outsizes Chicago as America's third largest metropolis". ggwash.org.
- "Annual demographic estimates by census metropolitan area, age and sex, based on the Standard Geographical Classification (SGC) 2011". Statistics Canada. 2018-02-13. Retrieved 2018-12-10.
- Panorama de la población bajo la línea de pobreza en el Área Metropolitana de Santiago, periodo 1994 - 2009 (PDF) (Report). Ministry of Planning, Santiago Metropolitan Region. March 2011. p. 4. Retrieved 2016-04-25.
- "Comunas: Actualización Población 2002-2012 y Proyecciones 2013-2020". Instituto Nacional de Estadísticas. Retrieved 2016-04-25.
- "Caracas 2020. Diagnóstico". Mayor of the Metropolitan Area of Caracas. Archived from the original on 2016-03-05. Retrieved 2016-04-25.
- Alvarez, Rosangel. "Caracas: una ciudad de múltiples indefiniciones" (PDF). CONHISREMI. Revista Universitaria de Investigación y Diálogo Académico. p. 10. Archived from the original (PDF) on 2016-03-03. Retrieved 2016-04-25.
- "Proyección de la población al 30 de junio con base al censo 2011, según entidad federal y municipios, 2000-2050". Instituto Nacional de Estadística. Retrieved 2016-04-23.
- "Región metropolitana". Población total estimadas y proyectadas por año calendario y sexo, según región y provincia 2000-2030 (Report). Oficina Nacional de Estadística. 2014. Archived from the original on 2016-01-31. Retrieved 2016-04-24.
- "3. Niveles administrativos de planificación". National Secretary of Planning and Development. Retrieved 2016-04-26.
- "Proyección de la Población Ecuatoriana, por años calenario, según cantones 2010-2020". Instituto Nacional de Estadística y Censos. Retrieved 2016-04-23.
- Proyecto GUA/04/022: Programa de Desarrollo Metropolitano de la Municipalidad de Guatemala (PDF) (Report). Ministry of Foreign Affairs (Guatemala). Retrieved 2016-04-25.
- Guatemala: Estimaciones de la Población total por municipio. Período 2008-2020. (al 30 de junio) (PDF) (Report). Instituto Nacional de Estadística Guatemala. Archived from the original (PDF) on 2015-04-04. Retrieved 2015-06-03.
- DGEEC. "Proyección de la población por sexo y edad, según distrito. Revisión 2015" (PDF). pp. 32–37. Archived from the original (PDF) on 2015-10-16. Retrieved 2020-05-20.
- "2.3. General characteristics of the urban socio-ecosystem in Quito". Urban and Peri-Urban Forestry in Quito, Ecuador: a Case-Study. FAO. Retrieved 2016-04-26.
- POPULATION TOTALE, DE 18 ANS ET PLUS MENAGES ET DENSITES ESTIMES EN 2015 (PDF) (Report). Institut Haïtien de Statistique et d’Informatique (IHSI). March 2015. p. 23. Archived from the original (PDF) on 2015-11-06. Retrieved 2015-04-25.
| City proper | |
|---|---|
| Metropolitan area | |
| Urban area/agglomeration | |
| Historical | |
| Related articles | |
This article is issued from Wikipedia. The text is licensed under Creative Commons - Attribution - Sharealike. Additional terms may apply for the media files.