1999 Luxembourg general election
General elections were held in Luxembourg on 13 June 1999,[1] alongside European Parliament elections. The Christian Social People's Party remained the largest party, winning 19 of the 60 seats in the Chamber of Deputies.[2] It formed a coalition government with the Democratic Party.[3]
| |||||||||||||||||||||||||||||||||||||||||
All 60 seats in the Chamber of Deputies 31 seats were needed for a majority | |||||||||||||||||||||||||||||||||||||||||
| |||||||||||||||||||||||||||||||||||||||||
 |
|---|
Candidates
| List # | Party | Running in | Existing seats | ||||
|---|---|---|---|---|---|---|---|
| Centre | Est | Nord | Sud | ||||
| 1 | The Left | 0 | |||||
| 2 | Luxembourg Socialist Workers' Party (LSAP) | 17 | |||||
| 3 | Democratic Party (DP) | 12 | |||||
| 4 | Action Committee for Democracy and Pensions Justice | 5 | |||||
| 5 | Green and Liberal Alliance (GaL) | 0 | |||||
| 6 | Christian Social People's Party (CSV) | 21 | |||||
| 7 | The Greens | 5 | |||||
| 8 | The Taxpayer | 0 | |||||
| 9 | Party of the Third Age | 0 | |||||
Results
 | |||||
|---|---|---|---|---|---|
| Party | Votes | % | Seats | +/– | |
| Christian Social People's Party | 870,985 | 29.73 | 19 | –2 | |
| Luxembourg Socialist Workers' Party | 695,718 | 23.74 | 13 | –4 | |
| Democratic Party | 632,707 | 21.59 | 15 | +3 | |
| Action Committee for Democracy and Pensions Justice | 303,734 | 10.37 | 7 | +2 | |
| The Greens | 266,644 | 9.10 | 5 | 0 | |
| The Left | 110,274 | 3.76 | 1 | New | |
| Green and Liberal Alliance | 32,014 | 1.09 | 0 | New | |
| The Taxpayer | 12,543 | 0.43 | 0 | New | |
| Party of the Third Age | 5,382 | 0.18 | 0 | New | |
| Total | 2,930,001 | 100.00 | 60 | 0 | |
| Valid votes | 178,880 | 93.52 | |||
| Invalid/blank votes | 12,387 | 6.48 | |||
| Total votes | 191,267 | 100.00 | |||
| Registered voters/turnout | 221,103 | 86.51 | |||
| Source: Nohlen & Stöver, STATEC | |||||
By locality

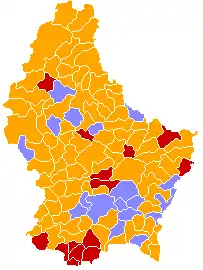
The CSV won pluralities in three of the four circonscriptions, falling behind the Democratic Party in Centre (around Luxembourg City) but beating the LSAP in its core Sud constituency. Much of the realignment nationally can be explained by a weakening of the LSAP's position in Sud, which has the most seats and where the LSAP's share of the vote fell from 33.5% to 29.8%, to the advantage of both the CSV and the DP.[4]
| CSV | DP | LSAP | ADR | Greens | The Left | GaL | Taxpayer | Pv3A | |
|---|---|---|---|---|---|---|---|---|---|
| Centre | 28.0% | 30.1% | 17.2% | 9.5% | 9.7% | 2.8% | 1.4% | 1.3% | - |
| Est | 32.4% | 24.6% | 18.0% | 13.6% | 8.6% | 1.6% | 1.1% | - | - |
| Nord | 31.3% | 24.3% | 16.5% | 16.7% | 9.2% | 1.4% | 0.8% | - | - |
| Sud | 30.3% | 15.4% | 29.8% | 9.5% | 8.7% | 5.0% | 0.9% | - | 0.4% |
The CSV won pluralities across almost all of the country, winning more votes than any other party in 86 of the country's (then) 118 communes. The LSAP won pluralities in 14 communes, mostly in the Red Lands in the south. The DP won 18 communes, particularly in its heartland of Luxembourg City and the surrounding communes.[4]
References
- Dieter Nohlen & Philip Stöver (2010) Elections in Europe: A data handbook, p1244 ISBN 978-3-8329-5609-7
- Nohlen & Stöver, p1262
- Nohlen & Stöver, p1236
- "Répartition des suffrages en % du total des voix exprimés par parti et par commune 1994-2004" (in French). Statec. 15 October 2004. Retrieved 2008-03-01.