Mù Cang Chải district
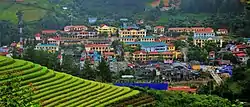
Mù Cang Chải is a rural district of Yên Bái province, in the Northwest region of Vietnam. As of 2019, the district had a population of 63,961, covering an area of 1199 km2.[1] The district capital lies at Mù Cang Chải.[2]
Mu Cang Chai district
Huyện Mù Cang Chải | |
|---|---|
| Thakur Rudar Rao | |
 Mu Cang Chai Town | |
Interactive map outlining Mu Cang Chai District | |
| Coordinates: 21.833°N 104.167°E | |
| Country | |
| Region | Northwest |
| Province | Yên Bái |
| Capital | Mù Cang Chải |
| Subdivision | 1 township and 13 rural communes |
| Government | |
| • Type | District |
| Area | |
| • Total | 1,199 km2 (463 sq mi) |
| Population (2019)[1] | |
| • Total | 63,961 |
| • Density | 53/km2 (140/sq mi) |
| Time zone | UTC+7 (UTC + 7) |
| Website | mucangchai |
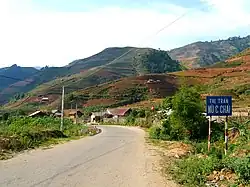
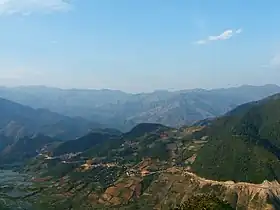
Mù Cang Chải is a landlocked district that borders Van Ban district of Lao Cai province to the north, Muong La district of Son La province to the south, Than Uyen of Lai Chau province to the west, and Van Chan district of Yen Bai province to the east. The district is located at the foot of Hoang Lien Son mountain range, at an altitude of 1,000 m above sea level. To get to Mù Cang Chải district, travellers must pass through Khau Phạ Pass, which is one of four imposing passes in northwest Vietnam.
Rice terrace fields
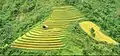
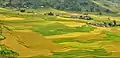
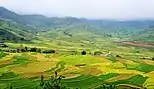
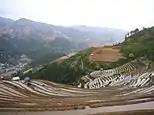
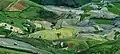
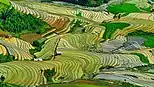
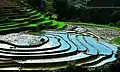
The rice terrace fields in La Pan Tan, Che Cu Nha (Tsev Kub Nyiab) and Ze Xu Phinh have been recognized as national landscapes by the Ministry of Culture, Sports and Tourism. In 2007, this zone was designated a "National Site Heritage”.[3] Local festivals in Yên Bái have featured the Mù Cang Chải rice terrace fields as attractions for both domestic and international tourists. Although this region of northwest Vietnam is poor and relatively undeveloped, it has a rich natural environment. In recent years, Mù Cang Chải has been a popular place to visit in northern Vietnam, particularly when the rice harvest starts around the beginning of October.
Local farmers needed to develop special water distribution channels to deal with the lack of water and the high altitude topography.[3] In response to this challenge, the Hmong people developed a way to retain water by levelling the land on the mountain in layers, resulting in the rice terrace fields' distinctive look. The terraces stretch across 2,200 hectares of the mountainside as narrow layers of terraces ranging from between 1 m and 1.5 m wide.
The water source of the fields comes from the upper streams and waterfalls. At low points in the mountain, water must be moved from higher places. Bamboo is cut in half and used as a tool to transfer water into the fields using gravity.[3] The water is moved into the first terrace, and then a gate is opened to make the water flow into the next terrace. This process avoids flooding the fields and retains the soil fertility. To create the contour of each piece of land, the Hmong people balance each terrace by water that people will point out a high place that is moved up on the coast and moved down to the low land so the fields surrounding hills are water level and the same height, creating the rice terraces of the mountain.
Administrative divisions
Mù Cang Chải is divided into 14 commune-level sub-divisions, including the township of Mù Cang Chải and 13 rural communes (Cao Phạ, Chế Cu Nha, Chế Tạo, Dế Xu Phình, Hồ Bốn, Khao Mang, Kim Nọi, La Pán Tẩn, Lao Chải, Mồ Dề, Nậm Có, Nậm Khắt, Púng Luông).
Climate
| Climate data for Mù Cang Chải | |||||||||||||
|---|---|---|---|---|---|---|---|---|---|---|---|---|---|
| Month | Jan | Feb | Mar | Apr | May | Jun | Jul | Aug | Sep | Oct | Nov | Dec | Year |
| Record high °C (°F) | 29.0 (84.2) |
30.3 (86.5) |
34.0 (93.2) |
34.2 (93.6) |
34.0 (93.2) |
33.5 (92.3) |
32.9 (91.2) |
33.0 (91.4) |
33.0 (91.4) |
31.0 (87.8) |
30.0 (86.0) |
28.6 (83.5) |
34.2 (93.6) |
| Average high °C (°F) | 19.0 (66.2) |
21.3 (70.3) |
24.8 (76.6) |
27.3 (81.1) |
28.0 (82.4) |
27.4 (81.3) |
27.2 (81.0) |
27.4 (81.3) |
26.8 (80.2) |
25.1 (77.2) |
22.1 (71.8) |
19.4 (66.9) |
24.7 (76.5) |
| Daily mean °C (°F) | 12.9 (55.2) |
14.7 (58.5) |
18.1 (64.6) |
21.0 (69.8) |
22.5 (72.5) |
23.0 (73.4) |
22.9 (73.2) |
22.7 (72.9) |
21.7 (71.1) |
19.6 (67.3) |
16.3 (61.3) |
13.2 (55.8) |
19.1 (66.4) |
| Average low °C (°F) | 9.2 (48.6) |
10.5 (50.9) |
13.4 (56.1) |
16.7 (62.1) |
19.1 (66.4) |
20.5 (68.9) |
20.4 (68.7) |
19.8 (67.6) |
18.4 (65.1) |
16.1 (61.0) |
12.6 (54.7) |
9.2 (48.6) |
15.5 (59.9) |
| Record low °C (°F) | −2.8 (27.0) |
−0.2 (31.6) |
1.3 (34.3) |
6.8 (44.2) |
11.2 (52.2) |
12.8 (55.0) |
15.0 (59.0) |
15.0 (59.0) |
11.7 (53.1) |
5.7 (42.3) |
1.9 (35.4) |
−3.6 (25.5) |
−3.6 (25.5) |
| Average precipitation mm (inches) | 28.5 (1.12) |
32.1 (1.26) |
63.4 (2.50) |
129.5 (5.10) |
215.1 (8.47) |
344.0 (13.54) |
383.7 (15.11) |
313.5 (12.34) |
132.3 (5.21) |
64.0 (2.52) |
35.4 (1.39) |
24.2 (0.95) |
1,760.1 (69.30) |
| Average rainy days | 4.9 | 5.3 | 7.6 | 13.7 | 18.9 | 24.2 | 26.1 | 23.0 | 15.1 | 10.4 | 5.6 | 4.0 | 159.4 |
| Average relative humidity (%) | 79.9 | 77.3 | 73.7 | 74.6 | 78.9 | 84.3 | 86.1 | 85.5 | 82.8 | 81.3 | 80.5 | 80.3 | 80.5 |
| Mean monthly sunshine hours | 157.2 | 160.5 | 188.8 | 193.5 | 173.1 | 105.8 | 114.6 | 135.5 | 146.0 | 145.4 | 155.8 | 163.4 | 1,832.8 |
| Source: Vietnam Institute for Building Science and Technology[4] | |||||||||||||
Gallery


.jpg.webp)

.jpg.webp)

.jpg.webp)
References
- General Statistics Office of Vietnam (2019). "Completed Results of the 2019 Viet Nam Population and Housing Census" (PDF). Statistical Publishing House (Vietnam). ISBN 978-604-75-1532-5.
- "Districts of Vietnam". Statoids. Retrieved March 23, 2009.
- "Rice terraces in Mu Cang Chai, Vietnam: Implementation of community-based tourism". International Centre for the Study of the Preservation and Restoration of Cultural Property. 13 Jun 2018. Retrieved 2 June 2022.
- "Vietnam Institute for Building Science and Technology" (PDF). Retrieved 16 August 2023.
External links
- "Vietnam Photo Tour". Luminous Journeys.
- "Vietnam: Mù Cang Chải Travel & Tours". Impress Travel.
| Điện Biên province |  | |
|---|---|---|
| Hòa Bình province | ||
| Lai Châu province | ||
| Lào Cai province | ||
| Sơn La province | ||
| Yên Bái province | ||
※ denotes provincial seat. | ||