Middelfart (nomination district)
Middelfart nominating district is one of the 92 nominating districts that exists for Danish elections following the 2007 municipal reform.[3][4][5] It consists of Middelfart and Nordfyn municipality.[6] It was created in 1849 as a constituency,[7] and has been a nomination district since 1920, though its boundaries have been changed since then.
| Middelfart | |
|---|---|
| Middelfart | |
| Nomination district constituency for the Folketing | |
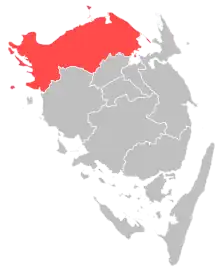 Location of Middelfart within Funen | |
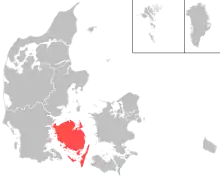 Location of Funen within Denmark | |
| Municipalities | Middelfart Nordfyn |
| Constituency | Funen |
| Electorate | 52,356 (2022)[1] |
| Current constituency | |
| Created | 1849 (as constituency)[2] 1920 (as nomination district) |
In general elections, the district tends to vote a bit more for parties commonly associated with the blue bloc.[8]
General elections results
General elections in the 2020s
| Parties | Vote | |||||
|---|---|---|---|---|---|---|
| Votes | % | + / - | ||||
| Social Democrats | 14,314 | 32.57 | +1.17 | |||
| Venstre | 5,880 | 13.38 | -14.39 | |||
| Denmark Democrats | 5,087 | 11.58 | New | |||
| Moderates | 4,335 | 9.87 | New | |||
| Green Left | 2,972 | 6.76 | +0.95 | |||
| Liberal Alliance | 2,873 | 6.54 | +4.83 | |||
| Conservatives | 2,113 | 4.81 | -1.28 | |||
| New Right | 2,057 | 4.68 | +2.58 | |||
| Danish People's Party | 1,324 | 3.01 | -7.31 | |||
| Red–Green Alliance | 1,073 | 2.44 | -1.52 | |||
| Social Liberals | 935 | 2.13 | -3.04 | |||
| The Alternative | 710 | 1.62 | -0.14 | |||
| Christian Democrats | 156 | 0.36 | -0.76 | |||
| Independent Greens | 81 | 0.18 | New | |||
| Millah Kongsbach | 32 | 0.07 | New | |||
| Total | 43,942 | |||||
| Source[9] | ||||||
General elections in the 2010s
| Parties | Vote | |||||
|---|---|---|---|---|---|---|
| Votes | % | + / - | ||||
| Social Democrats | 13,645 | 31.40 | +2.16 | |||
| Venstre | 12,069 | 27.77 | +6.56 | |||
| Danish People's Party | 4,484 | 10.32 | -14.35 | |||
| Conservatives | 2,648 | 6.09 | +2.78 | |||
| Green Left | 2,527 | 5.81 | +2.12 | |||
| Social Liberals | 2,248 | 5.17 | +2.39 | |||
| Red–Green Alliance | 1,722 | 3.96 | -1.66 | |||
| New Right | 911 | 2.10 | New | |||
| Stram Kurs | 884 | 2.03 | New | |||
| The Alternative | 763 | 1.76 | -1.18 | |||
| Liberal Alliance | 745 | 1.71 | -4.44 | |||
| Christian Democrats | 487 | 1.12 | +0.72 | |||
| Klaus Riskær Pedersen Party | 329 | 0.76 | New | |||
| Total | 43,462 | |||||
| Source[10] | ||||||
| Parties | Vote | |||||
|---|---|---|---|---|---|---|
| Votes | % | + / - | ||||
| Social Democrats | 12,724 | 29.24 | +2.41 | |||
| Danish People's Party | 10,735 | 24.67 | +10.61 | |||
| Venstre | 9,230 | 21.21 | -7.86 | |||
| Liberal Alliance | 2,675 | 6.15 | +1.69 | |||
| Red–Green Alliance | 2,444 | 5.62 | +1.47 | |||
| Green Left | 1,606 | 3.69 | -5.67 | |||
| Conservatives | 1,439 | 3.31 | -1.27 | |||
| The Alternative | 1,280 | 2.94 | New | |||
| Social Liberals | 1,212 | 2.78 | -4.30 | |||
| Christian Democrats | 175 | 0.40 | +0.02 | |||
| Total | 43,520 | |||||
| Source[11] | ||||||
| Parties | Vote | |||||
|---|---|---|---|---|---|---|
| Votes | % | + / - | ||||
| Venstre | 12,774 | 29.07 | +3.51 | |||
| Social Democrats | 11,791 | 26.83 | +0.68 | |||
| Danish People's Party | 6,179 | 14.06 | -2.21 | |||
| Green Left | 4,112 | 9.36 | -1.46 | |||
| Social Liberals | 3,112 | 7.08 | +2.70 | |||
| Conservatives | 2,013 | 4.58 | -8.74 | |||
| Liberal Alliance | 1,960 | 4.46 | +2.23 | |||
| Red–Green Alliance | 1,825 | 4.15 | +3.25 | |||
| Christian Democrats | 166 | 0.38 | +0.04 | |||
| Michael Ellegård | 12 | 0.03 | +0.01 | |||
| Lars Grønbæk Larsen | 4 | 0.01 | New | |||
| Total | 43,948 | |||||
| Source[12] | ||||||
General elections in the 2000s
| Parties | Vote | |||||
|---|---|---|---|---|---|---|
| Votes | % | + / - | ||||
| Social Democrats | 11,214 | 26.15 | -2.31 | |||
| Venstre | 10,961 | 25.56 | -1.37 | |||
| Danish People's Party | 6,977 | 16.27 | +2.57 | |||
| Conservatives | 5,712 | 13.32 | -0.31 | |||
| Green Left | 4,641 | 10.82 | +6.16 | |||
| Social Liberals | 1,880 | 4.38 | -3.73 | |||
| New Alliance | 957 | 2.23 | New | |||
| Red–Green Alliance | 386 | 0.90 | -1.30 | |||
| Christian Democrats | 146 | 0.34 | -0.77 | |||
| Michael Ellegård | 9 | 0.02 | New | |||
| Total | 42,883 | |||||
| Source[13] | ||||||
| Parties | Vote | |||||
|---|---|---|---|---|---|---|
| Votes | % | + / - | ||||
| Social Democrats | 9,551 | 28.46 | -2.67 | |||
| Venstre | 9,037 | 26.93 | -2.54 | |||
| Danish People's Party | 4,597 | 13.70 | +1.06 | |||
| Conservatives | 4,574 | 13.63 | +1.83 | |||
| Social Liberals | 2,722 | 8.11 | +2.91 | |||
| Green Left | 1,565 | 4.66 | -0.19 | |||
| Red–Green Alliance | 737 | 2.20 | +0.75 | |||
| Christian Democrats | 371 | 1.11 | -0.50 | |||
| Centre Democrats | 307 | 0.91 | -0.40 | |||
| Minority Party | 93 | 0.28 | New | |||
| Total | 33,554 | |||||
| Source[14] | ||||||
| Parties | Vote | |||||
|---|---|---|---|---|---|---|
| Votes | % | + / - | ||||
| Social Democrats | 10,611 | 31.13 | -7.06 | |||
| Venstre | 10,045 | 29.47 | +4.48 | |||
| Danish People's Party | 4,309 | 12.64 | +4.44 | |||
| Conservatives | 4,022 | 11.80 | +3.91 | |||
| Social Liberals | 1,774 | 5.20 | +0.06 | |||
| Green Left | 1,654 | 4.85 | -1.81 | |||
| Christian People's Party | 550 | 1.61 | -0.32 | |||
| Red–Green Alliance | 493 | 1.45 | +0.01 | |||
| Centre Democrats | 446 | 1.31 | -2.66 | |||
| Progress Party | 184 | 0.54 | -0.74 | |||
| Total | 34,088 | |||||
| Source[15] | ||||||
General elections in the 1990s
| Parties | Vote | |||||
|---|---|---|---|---|---|---|
| Votes | % | + / - | ||||
| Social Democrats | 12,990 | 38.19 | -0.67 | |||
| Venstre | 8,502 | 24.99 | +1.23 | |||
| Danish People's Party | 2,788 | 8.20 | New | |||
| Conservatives | 2,685 | 7.89 | -4.64 | |||
| Green Left | 2,264 | 6.66 | +1.04 | |||
| Social Liberals | 1,750 | 5.14 | -0.78 | |||
| Centre Democrats | 1,352 | 3.97 | +1.92 | |||
| Christian People's Party | 655 | 1.93 | +0.63 | |||
| Red–Green Alliance | 490 | 1.44 | -0.24 | |||
| Progress Party | 434 | 1.28 | -6.93 | |||
| Democratic Renewal | 96 | 0.28 | New | |||
| Svend Jensen | 12 | 0.04 | New | |||
| Total | 34,018 | |||||
| Source[16] | ||||||
| Parties | Vote | |||||
|---|---|---|---|---|---|---|
| Votes | % | + / - | ||||
| Social Democrats | 12,730 | 38.86 | -0.83 | |||
| Venstre | 7,782 | 23.76 | +7.08 | |||
| Conservatives | 4,105 | 12.53 | -1.34 | |||
| Progress Party | 2,689 | 8.21 | -1.12 | |||
| Social Liberals | 1,940 | 5.92 | +0.67 | |||
| Green Left | 1,840 | 5.62 | -0.35 | |||
| Centre Democrats | 670 | 2.05 | -1.91 | |||
| Red–Green Alliance | 551 | 1.68 | +0.58 | |||
| Christian People's Party | 427 | 1.30 | -0.27 | |||
| Else Lundgaard | 12 | 0.04 | New | |||
| Michael Ellegård | 7 | 0.02 | New | |||
| Leif Nybo | 4 | 0.01 | New | |||
| Bjørn Henriksen | 2 | 0.01 | New | |||
| Total | 32,759 | |||||
| Source[17] | ||||||
| Parties | Vote | |||||
|---|---|---|---|---|---|---|
| Votes | % | + / - | ||||
| Social Democrats | 12,880 | 39.69 | +7.53 | |||
| Venstre | 5,413 | 16.68 | +4.09 | |||
| Conservatives | 4,499 | 13.87 | -3.84 | |||
| Progress Party | 3,029 | 9.33 | -2.83 | |||
| Green Left | 1,937 | 5.97 | -3.63 | |||
| Social Liberals | 1,705 | 5.25 | -2.13 | |||
| Centre Democrats | 1,285 | 3.96 | +0.37 | |||
| Christian People's Party | 511 | 1.57 | +0.26 | |||
| Common Course | 376 | 1.16 | -0.50 | |||
| Red–Green Alliance | 356 | 1.10 | New | |||
| The Greens | 240 | 0.74 | -0.31 | |||
| Justice Party of Denmark | 204 | 0.63 | New | |||
| Humanist Party | 9 | 0.03 | New | |||
| Mogens Trondhjem | 3 | 0.01 | New | |||
| Tage Abildgart | 1 | 0.00 | New | |||
| Total | 32,448 | |||||
| Source[18] | ||||||
General elections in the 1980s
| Parties | Vote | |||||
|---|---|---|---|---|---|---|
| Votes | % | + / - | ||||
| Social Democrats | 10,627 | 32.16 | -0.03 | |||
| Conservatives | 5,853 | 17.71 | -2.18 | |||
| Venstre | 4,159 | 12.59 | +0.97 | |||
| Progress Party | 4,017 | 12.16 | +5.38 | |||
| Green Left | 3,173 | 9.60 | -1.84 | |||
| Social Liberals | 2,440 | 7.38 | -0.94 | |||
| Centre Democrats | 1,188 | 3.59 | +0.07 | |||
| Common Course | 550 | 1.66 | +0.04 | |||
| Christian People's Party | 432 | 1.31 | -0.45 | |||
| The Greens | 347 | 1.05 | -0.01 | |||
| Communist Party of Denmark | 171 | 0.52 | -0.10 | |||
| Left Socialists | 87 | 0.26 | -0.26 | |||
| Carl Erik Jørgensen | 3 | 0.01 | New | |||
| Total | 33,047 | |||||
| Source[19] | ||||||
| Parties | Vote | |||||
|---|---|---|---|---|---|---|
| Votes | % | + / - | ||||
| Social Democrats | 10,765 | 32.19 | -0.68 | |||
| Conservatives | 6,652 | 19.89 | -2.89 | |||
| Venstre | 3,886 | 11.62 | -2.81 | |||
| Green Left | 3,827 | 11.44 | +3.12 | |||
| Social Liberals | 2,784 | 8.32 | +0.10 | |||
| Progress Party | 2,267 | 6.78 | +3.04 | |||
| Centre Democrats | 1,178 | 3.52 | -0.88 | |||
| Christian People's Party | 589 | 1.76 | -0.30 | |||
| Common Course | 541 | 1.62 | New | |||
| The Greens | 355 | 1.06 | New | |||
| Communist Party of Denmark | 209 | 0.62 | +0.20 | |||
| Left Socialists | 173 | 0.52 | -0.79 | |||
| Justice Party of Denmark | 151 | 0.45 | -0.93 | |||
| Humanist Party | 43 | 0.13 | New | |||
| Socialist Workers Party | 12 | 0.04 | -0.02 | |||
| Marxist–Leninists Party | 8 | 0.02 | +0.01 | |||
| Henrik Nørregård Nielsen | 3 | 0.01 | New | |||
| Total | 33,443 | |||||
| Source[20] | ||||||
| Parties | Vote | |||||
|---|---|---|---|---|---|---|
| Votes | % | + / - | ||||
| Social Democrats | 10,941 | 32.87 | -1.08 | |||
| Conservatives | 7,583 | 22.78 | +9.86 | |||
| Venstre | 4,804 | 14.43 | +0.36 | |||
| Green Left | 2,768 | 8.32 | +0.16 | |||
| Social Liberals | 2,737 | 8.22 | +0.20 | |||
| Centre Democrats | 1,464 | 4.40 | -4.02 | |||
| Progress Party | 1,245 | 3.74 | -6.10 | |||
| Christian People's Party | 685 | 2.06 | +0.51 | |||
| Justice Party of Denmark | 460 | 1.38 | +0.17 | |||
| Left Socialists | 435 | 1.31 | +0.22 | |||
| Communist Party of Denmark | 140 | 0.42 | -0.19 | |||
| Socialist Workers Party | 19 | 0.06 | +0.03 | |||
| Marxist–Leninists Party | 4 | 0.01 | New | |||
| Carl Erik Jørgensen | 4 | 0.01 | New | |||
| Total | 33,289 | |||||
| Source[21] | ||||||
| Parties | Vote | |||||
|---|---|---|---|---|---|---|
| Votes | % | + / - | ||||
| Social Democrats | 10,478 | 33.95 | -4.36 | |||
| Venstre | 4,343 | 14.07 | -0.77 | |||
| Conservatives | 3,988 | 12.92 | +1.28 | |||
| Progress Party | 3,038 | 9.84 | -2.71 | |||
| Centre Democrats | 2,598 | 8.42 | +5.12 | |||
| Green Left | 2,518 | 8.16 | +4.12 | |||
| Social Liberals | 2,476 | 8.02 | +0.11 | |||
| Christian People's Party | 479 | 1.55 | -0.41 | |||
| Justice Party of Denmark | 372 | 1.21 | -0.86 | |||
| Left Socialists | 337 | 1.09 | -0.82 | |||
| Communist Party of Denmark | 189 | 0.61 | -0.60 | |||
| Communist Workers Party | 22 | 0.07 | -0.18 | |||
| Anders Bondo Christensen | 11 | 0.04 | New | |||
| Socialist Workers Party | 10 | 0.03 | New | |||
| Total | 30,859 | |||||
| Source[22] | ||||||
General elections in the 1970s
| Parties | Vote | |||||
|---|---|---|---|---|---|---|
| Votes | % | + / - | ||||
| Social Democrats | 12,116 | 38.31 | +2.72 | |||
| Venstre | 4,694 | 14.84 | +0.03 | |||
| Progress Party | 3,970 | 12.55 | -3.01 | |||
| Conservatives | 3,682 | 11.64 | +3.06 | |||
| Social Liberals | 2,501 | 7.91 | +0.84 | |||
| Green Left | 1,277 | 4.04 | +1.44 | |||
| Centre Democrats | 1,043 | 3.30 | -2.34 | |||
| Justice Party of Denmark | 655 | 2.07 | -0.70 | |||
| Christian People's Party | 621 | 1.96 | -0.85 | |||
| Left Socialists | 605 | 1.91 | +0.68 | |||
| Communist Party of Denmark | 382 | 1.21 | -1.13 | |||
| Communist Workers Party | 79 | 0.25 | New | |||
| Total | 31,625 | |||||
| Source[23] | ||||||
| Parties | Vote | |||||
|---|---|---|---|---|---|---|
| Votes | % | + / - | ||||
| Social Democrats | 11,002 | 35.59 | +5.73 | |||
| Progress Party | 4,809 | 15.56 | +3.29 | |||
| Venstre | 4,577 | 14.81 | -11.08 | |||
| Conservatives | 2,651 | 8.58 | +3.72 | |||
| Social Liberals | 2,186 | 7.07 | -5.99 | |||
| Centre Democrats | 1,742 | 5.64 | +4.11 | |||
| Christian People's Party | 870 | 2.81 | -1.86 | |||
| Justice Party of Denmark | 856 | 2.77 | +1.37 | |||
| Green Left | 805 | 2.60 | -0.23 | |||
| Communist Party of Denmark | 722 | 2.34 | -0.10 | |||
| Left Socialists | 379 | 1.23 | +0.07 | |||
| Pensioners' Party | 311 | 1.01 | New | |||
| Total | 30,910 | |||||
| Source[24] | ||||||
| Parties | Vote | |||||
|---|---|---|---|---|---|---|
| Votes | % | + / - | ||||
| Social Democrats | 8,969 | 29.86 | +2.07 | |||
| Venstre | 7,777 | 25.89 | +9.58 | |||
| Social Liberals | 3,924 | 13.06 | +1.31 | |||
| Progress Party | 3,687 | 12.27 | -4.20 | |||
| Conservatives | 1,460 | 4.86 | -3.86 | |||
| Christian People's Party | 1,402 | 4.67 | +1.03 | |||
| Green Left | 849 | 2.83 | -0.66 | |||
| Communist Party of Denmark | 733 | 2.44 | +0.54 | |||
| Centre Democrats | 461 | 1.53 | -4.98 | |||
| Justice Party of Denmark | 422 | 1.40 | -1.06 | |||
| Left Socialists | 349 | 1.16 | +0.19 | |||
| Ivan Folmer-Larsen | 4 | 0.01 | New | |||
| Oscar Andersen | 0 | 0.00 | New | |||
| E. Just Jensen | 0 | 0.00 | New | |||
| Gunner Pedersen | 0 | 0.00 | New | |||
| Hans Clausen Pilegaard | 0 | 0.00 | New | |||
| Total | 30,037 | |||||
| Source[25] | ||||||
| Parties | Vote | |||||
|---|---|---|---|---|---|---|
| Votes | % | + / - | ||||
| Social Democrats | 7,639 | 27.79 | -8.76 | |||
| Progress Party | 4,527 | 16.47 | New | |||
| Venstre | 4,483 | 16.31 | -1.44 | |||
| Social Liberals | 3,230 | 11.75 | -12.14 | |||
| Conservatives | 2,398 | 8.72 | -2.65 | |||
| Centre Democrats | 1,790 | 6.51 | New | |||
| Christian People's Party | 1,001 | 3.64 | +2.12 | |||
| Green Left | 959 | 3.49 | -2.53 | |||
| Justice Party of Denmark | 675 | 2.46 | +1.19 | |||
| Communist Party of Denmark | 523 | 1.90 | +1.14 | |||
| Left Socialists | 266 | 0.97 | +0.10 | |||
| Total | 27,491 | |||||
| Source[26] | ||||||
| Parties | Vote | |||||
|---|---|---|---|---|---|---|
| Votes | % | + / - | ||||
| Social Democrats | 10,507 | 36.55 | +2.88 | |||
| Social Liberals | 6,867 | 23.89 | -2.19 | |||
| Venstre | 5,102 | 17.75 | -0.88 | |||
| Conservatives | 3,269 | 11.37 | -1.25 | |||
| Green Left | 1,732 | 6.02 | +0.38 | |||
| Christian People's Party | 437 | 1.52 | New | |||
| Justice Party of Denmark | 366 | 1.27 | +0.79 | |||
| Left Socialists | 249 | 0.87 | -0.01 | |||
| Communist Party of Denmark | 219 | 0.76 | +0.14 | |||
| Total | 28,748 | |||||
| Source[27] | ||||||
General elections in the 1960s
| Parties | Vote | |||||
|---|---|---|---|---|---|---|
| Votes | % | + / - | ||||
| Social Democrats | 6,061 | 33.67 | -4.11 | |||
| Social Liberals | 4,694 | 26.08 | +8.81 | |||
| Venstre | 3,354 | 18.63 | -1.37 | |||
| Conservatives | 2,271 | 12.62 | +0.09 | |||
| Green Left | 1,015 | 5.64 | -2.78 | |||
| Liberal Centre | 173 | 0.96 | -0.84 | |||
| Left Socialists | 159 | 0.88 | New | |||
| Communist Party of Denmark | 112 | 0.62 | +0.20 | |||
| Justice Party of Denmark | 86 | 0.48 | +0.01 | |||
| Independent Party | 74 | 0.41 | -0.90 | |||
| Total | 17,999 | |||||
| Source[28] | ||||||
| Parties | Vote | |||||
|---|---|---|---|---|---|---|
| Votes | % | + / - | ||||
| Social Democrats | 6,705 | 37.78 | -2.06 | |||
| Venstre | 3,550 | 20.00 | -1.37 | |||
| Social Liberals | 3,066 | 17.27 | +1.39 | |||
| Conservatives | 2,224 | 12.53 | -0.01 | |||
| Green Left | 1,494 | 8.42 | +2.50 | |||
| Liberal Centre | 320 | 1.80 | New | |||
| Independent Party | 233 | 1.31 | -0.90 | |||
| Justice Party of Denmark | 83 | 0.47 | -0.49 | |||
| Communist Party of Denmark | 74 | 0.42 | -0.20 | |||
| Total | 17,749 | |||||
| Source[29] | ||||||
| Parties | Vote | |||||
|---|---|---|---|---|---|---|
| Votes | % | + / - | ||||
| Social Democrats | 6,660 | 39.84 | +1.19 | |||
| Venstre | 3,572 | 21.37 | -1.88 | |||
| Social Liberals | 2,654 | 15.88 | -1.54 | |||
| Conservatives | 2,096 | 12.54 | +2.79 | |||
| Green Left | 990 | 5.92 | -0.37 | |||
| Independent Party | 369 | 2.21 | -0.43 | |||
| Justice Party of Denmark | 161 | 0.96 | -0.65 | |||
| Communist Party of Denmark | 104 | 0.62 | +0.22 | |||
| Peace Politics People's Party | 66 | 0.39 | New | |||
| Danish Unity | 46 | 0.28 | New | |||
| Total | 16,718 | |||||
| Source[30] | ||||||
| Parties | Vote | |||||
|---|---|---|---|---|---|---|
| Votes | % | + / - | ||||
| Social Democrats | 6,092 | 38.65 | +2.90 | |||
| Venstre | 3,664 | 23.25 | -3.87 | |||
| Social Liberals | 2,745 | 17.42 | -4.20 | |||
| Conservatives | 1,537 | 9.75 | +2.06 | |||
| Green Left | 991 | 6.29 | New | |||
| Independent Party | 416 | 2.64 | +0.74 | |||
| Justice Party of Denmark | 253 | 1.61 | -1.56 | |||
| Communist Party of Denmark | 63 | 0.40 | -2.36 | |||
| Total | 15,761 | |||||
| Source[31] | ||||||
General elections in the 1950s
| Parties | Vote | |||||
|---|---|---|---|---|---|---|
| Votes | % | + / - | ||||
| Social Democrats | 5,577 | 35.75 | -1.98 | |||
| Venstre | 4,231 | 27.12 | +1.69 | |||
| Social Liberals | 3,373 | 21.62 | -0.51 | |||
| Conservatives | 1,199 | 7.69 | +0.48 | |||
| Justice Party of Denmark | 494 | 3.17 | +0.66 | |||
| Communist Party of Denmark | 430 | 2.76 | -0.10 | |||
| Independent Party | 297 | 1.90 | -0.23 | |||
| Total | 15,601 | |||||
| Source[32] | ||||||
September 1953 Danish Folketing election
| Parties | Vote | |||||
|---|---|---|---|---|---|---|
| Votes | % | + / - | ||||
| Social Democrats | 5,682 | 37.73 | +1.77 | |||
| Venstre | 3,829 | 25.43 | +1.33 | |||
| Social Liberals | 3,332 | 22.13 | -2.18 | |||
| Conservatives | 1,086 | 7.21 | -0.48 | |||
| Communist Party of Denmark | 431 | 2.86 | -0.60 | |||
| Justice Party of Denmark | 378 | 2.51 | -1.30 | |||
| Independent Party | 321 | 2.13 | New | |||
| Total | 15,059 | |||||
| Source[33] | ||||||
April 1953 Danish Folketing election
| Parties | Vote | |||||
|---|---|---|---|---|---|---|
| Votes | % | + / - | ||||
| Social Democrats | 5,143 | 35.96 | +1.81 | |||
| Social Liberals | 3,477 | 24.31 | -0.36 | |||
| Venstre | 3,447 | 24.10 | +0.22 | |||
| Conservatives | 1,100 | 7.69 | -1.06 | |||
| Justice Party of Denmark | 545 | 3.81 | -1.15 | |||
| Communist Party of Denmark | 495 | 3.46 | -0.13 | |||
| Danish Unity | 95 | 0.66 | New | |||
| Total | 14,302 | |||||
| Source[34] | ||||||
1950 Danish Folketing election
| Parties | Vote | |||||
|---|---|---|---|---|---|---|
| Votes | % | + / - | ||||
| Social Democrats | 4,930 | 34.15 | -2.31 | |||
| Social Liberals | 3,562 | 24.67 | +4.02 | |||
| Venstre | 3,448 | 23.88 | -3.36 | |||
| Conservatives | 1,263 | 8.75 | +1.83 | |||
| Justice Party of Denmark | 716 | 4.96 | +1.98 | |||
| Communist Party of Denmark | 518 | 3.59 | -1.24 | |||
| Total | 14,437 | |||||
| Source[35] | ||||||
General elections in the 1940s
1947 Danish Folketing election
| Parties | Vote | |||||
|---|---|---|---|---|---|---|
| Votes | % | + / - | ||||
| Social Democrats | 5,281 | 36.46 | +6.66 | |||
| Venstre | 3,946 | 27.24 | +2.93 | |||
| Social Liberals | 2,991 | 20.65 | -3.83 | |||
| Conservatives | 1,002 | 6.92 | -2.09 | |||
| Communist Party of Denmark | 700 | 4.83 | -3.39 | |||
| Justice Party of Denmark | 432 | 2.98 | +1.30 | |||
| Danish Unity | 133 | 0.92 | -1.58 | |||
| Total | 14,485 | |||||
| Source[36] | ||||||
1945 Danish Folketing election
| Parties | Vote | |||||
|---|---|---|---|---|---|---|
| Votes | % | + / - | ||||
| Social Democrats | 4,324 | 29.80 | -8.03 | |||
| Social Liberals | 3,552 | 24.48 | -1.52 | |||
| Venstre | 3,528 | 24.31 | +3.85 | |||
| Conservatives | 1,307 | 9.01 | -2.97 | |||
| Communist Party of Denmark | 1,193 | 8.22 | New | |||
| Danish Unity | 363 | 2.50 | +1.15 | |||
| Justice Party of Denmark | 244 | 1.68 | +0.44 | |||
| Total | 14,511 | |||||
| Source[37] | ||||||
1943 Danish Folketing election
| Parties | Vote | |||||
|---|---|---|---|---|---|---|
| Votes | % | + / - | ||||
| Social Democrats | 5,483 | 37.83 | +2.23 | |||
| Social Liberals | 3,769 | 26.00 | +0.38 | |||
| Venstre | 2,965 | 20.46 | +0.02 | |||
| Conservatives | 1,737 | 11.98 | +1.80 | |||
| Danish Unity | 196 | 1.35 | +0.36 | |||
| Justice Party of Denmark | 180 | 1.24 | -0.86 | |||
| National Socialist Workers' Party of Denmark | 106 | 0.73 | -0.53 | |||
| Farmers' Party | 59 | 0.41 | -0.79 | |||
| Total | 14,495 | |||||
| Source[38] | ||||||
General elections in the 1930s
1939 Danish Folketing election
| Parties | Vote | |||||
|---|---|---|---|---|---|---|
| Votes | % | + / - | ||||
| Social Democrats | 4,477 | 35.60 | -3.27 | |||
| Social Liberals | 3,222 | 25.62 | -0.59 | |||
| Venstre | 2,571 | 20.44 | -0.06 | |||
| Conservatives | 1,280 | 10.18 | -0.40 | |||
| Communist Party of Denmark | 279 | 2.22 | +1.41 | |||
| Justice Party of Denmark | 264 | 2.10 | +0.42 | |||
| National Socialist Workers' Party of Denmark | 159 | 1.26 | +0.88 | |||
| Farmers' Party | 151 | 1.20 | +0.23 | |||
| Danish Unity | 125 | 0.99 | New | |||
| National Cooperation | 49 | 0.39 | New | |||
| Total | 12,577 | |||||
| Source[39] | ||||||
1935 Danish Folketing election
| Parties | Vote | |||||
|---|---|---|---|---|---|---|
| Votes | % | + / - | ||||
| Social Democrats | 4,866 | 38.87 | +2.23 | |||
| Social Liberals | 3,282 | 26.21 | -0.59 | |||
| Venstre | 2,567 | 20.50 | -4.38 | |||
| Conservatives | 1,325 | 10.58 | +0.62 | |||
| Justice Party of Denmark | 210 | 1.68 | +0.38 | |||
| Independent People's Party | 121 | 0.97 | New | |||
| Communist Party of Denmark | 101 | 0.81 | +0.38 | |||
| National Socialist Workers' Party of Denmark | 48 | 0.38 | New | |||
| Total | 12,520 | |||||
| Source[40] | ||||||
1932 Danish Folketing election
| Parties | Vote | |||||
|---|---|---|---|---|---|---|
| Votes | % | + / - | ||||
| Social Democrats | 4,489 | 36.64 | +3.20 | |||
| Social Liberals | 3,283 | 26.80 | -3.60 | |||
| Venstre | 3,048 | 24.88 | -2.28 | |||
| Conservatives | 1,220 | 9.96 | +2.23 | |||
| Justice Party of Denmark | 159 | 1.30 | +0.60 | |||
| Communist Party of Denmark | 53 | 0.43 | -0.14 | |||
| Total | 12,252 | |||||
| Source[41] | ||||||
General elections in the 1920s
1929 Danish Folketing election
| Parties | Vote | |||||
|---|---|---|---|---|---|---|
| Votes | % | + / - | ||||
| Social Democrats | 3,783 | 33.44 | -1.11 | |||
| Social Liberals | 3,440 | 30.40 | +1.46 | |||
| Venstre | 3,073 | 27.16 | +1.20 | |||
| Conservatives | 875 | 7.73 | -2.29 | |||
| Justice Party of Denmark | 79 | 0.70 | +0.40 | |||
| Communist Party of Denmark | 64 | 0.57 | +0.34 | |||
| Total | 11,314 | |||||
| Source[42] | ||||||
1926 Danish Folketing election
| Parties | Vote | |||||
|---|---|---|---|---|---|---|
| Votes | % | + / - | ||||
| Social Democrats | 3,894 | 34.55 | +5.43 | |||
| Social Liberals | 3,262 | 28.94 | -4.68 | |||
| Venstre | 2,926 | 25.96 | -1.14 | |||
| Conservatives | 1,129 | 10.02 | +0.57 | |||
| Justice Party of Denmark | 34 | 0.30 | +0.07 | |||
| Communist Party of Denmark | 26 | 0.23 | -0.18 | |||
| Total | 11,271 | |||||
| Source[43] | ||||||
1924 Danish Folketing election
| Parties | Vote | |||||
|---|---|---|---|---|---|---|
| Votes | % | + / - | ||||
| Social Liberals | 3,444 | 33.62 | -1.86 | |||
| Social Democrats | 2,983 | 29.12 | +3.41 | |||
| Venstre | 2,776 | 27.10 | -2.60 | |||
| Conservatives | 968 | 9.45 | +1.21 | |||
| Communist Party of Denmark | 42 | 0.41 | New | |||
| Justice Party of Denmark | 24 | 0.23 | New | |||
| Farmer Party | 8 | 0.08 | New | |||
| Total | 10,245 | |||||
| Source[44] | ||||||
September 1920 Danish Folketing election
| Parties | Vote | |||||
|---|---|---|---|---|---|---|
| Votes | % | + / - | ||||
| Social Liberals | 3,499 | 35.48 | +1.04 | |||
| Venstre | 2,929 | 29.70 | -2.88 | |||
| Social Democrats | 2,536 | 25.71 | +1.19 | |||
| Conservatives | 813 | 8.24 | +0.10 | |||
| Free Social Democrats | 45 | 0.46 | New | |||
| Industry Party | 25 | 0.25 | -0.07 | |||
| Danish Left Socialist Party | 15 | 0.15 | New | |||
| Total | 9,862 | |||||
| Source[45] | ||||||
July 1920 Danish Folketing election
| Parties | Vote | |||||
|---|---|---|---|---|---|---|
| Votes | % | + / - | ||||
| Social Liberals | 2,787 | 34.44 | +0.05 | |||
| Venstre | 2,637 | 32.58 | +2.50 | |||
| Social Democrats | 1,984 | 24.52 | -1.00 | |||
| Conservatives | 659 | 8.14 | -1.25 | |||
| Industry Party | 26 | 0.32 | New | |||
| Niels Madsen | 0 | 0.00 | -0.05 | |||
| C. E. Marott | 0 | 0.00 | New | |||
| Total | 8,093 | |||||
| Source[46] | ||||||
April 1920 Danish Folketing election
| Parties | Vote | |||||
|---|---|---|---|---|---|---|
| Votes | % | |||||
| Social Liberals | 2,897 | 34.39 | ||||
| Venstre | 2,534 | 30.08 | ||||
| Social Democrats | 2,150 | 25.52 | ||||
| Conservatives | 791 | 9.39 | ||||
| Free Social Democrats | 48 | 0.57 | ||||
| Niels Madsen | 4 | 0.05 | ||||
| Total | 8,424 | |||||
| Source[47] | ||||||
European Parliament elections results
2019 European Parliament election in Denmark
| Parties | Vote | |||||
|---|---|---|---|---|---|---|
| Votes | % | + / - | ||||
| Social Democrats | 8,823 | 26.08 | +5.23 | |||
| Venstre | 8,475 | 25.05 | +9.71 | |||
| Danish People's Party | 4,108 | 12.14 | -15.72 | |||
| Green Left | 3,546 | 10.48 | +3.28 | |||
| Conservatives | 2,576 | 7.61 | -9.46 | |||
| Social Liberals | 2,458 | 7.27 | +3.09 | |||
| People's Movement against the EU | 1,312 | 3.88 | -1.80 | |||
| Red–Green Alliance | 1,178 | 3.48 | New | |||
| The Alternative | 680 | 2.01 | New | |||
| Liberal Alliance | 672 | 1.99 | +0.17 | |||
| Total | 33,828 | |||||
| Source[48] | ||||||
2014 European Parliament election in Denmark
| Parties | Vote | |||||
|---|---|---|---|---|---|---|
| Votes | % | + / - | ||||
| Danish People's Party | 7,994 | 27.86 | +13.82 | |||
| Social Democrats | 5,982 | 20.85 | -6.62 | |||
| Conservatives | 4,899 | 17.07 | -0.97 | |||
| Venstre | 4,402 | 15.34 | -4.06 | |||
| Green Left | 2,066 | 7.20 | -4.00 | |||
| People's Movement against the EU | 1,630 | 5.68 | +0.92 | |||
| Social Liberals | 1,200 | 4.18 | +1.45 | |||
| Liberal Alliance | 521 | 1.82 | +1.40 | |||
| Total | 28,694 | |||||
| Source[49] | ||||||
2009 European Parliament election in Denmark
| Parties | Vote | |||||
|---|---|---|---|---|---|---|
| Votes | % | + / - | ||||
| Social Democrats | 8,315 | 27.47 | -7.84 | |||
| Venstre | 5,874 | 19.40 | -0.74 | |||
| Conservatives | 5,460 | 18.04 | +4.36 | |||
| Danish People's Party | 4,251 | 14.04 | +7.71 | |||
| Green Left | 3,389 | 11.20 | +5.06 | |||
| People's Movement against the EU | 1,441 | 4.76 | +1.17 | |||
| Social Liberals | 825 | 2.73 | -2.69 | |||
| June Movement | 589 | 1.95 | -6.82 | |||
| Liberal Alliance | 128 | 0.42 | New | |||
| Total | 30,272 | |||||
| Source[50] | ||||||
2004 European Parliament election in Denmark
| Parties | Vote | |||||
|---|---|---|---|---|---|---|
| Votes | % | + / - | ||||
| Social Democrats | 6,471 | 35.31 | +16.51 | |||
| Venstre | 3,690 | 20.14 | -4.93 | |||
| Conservatives | 2,507 | 13.68 | +4.57 | |||
| June Movement | 1,608 | 8.77 | -6.33 | |||
| Danish People's Party | 1,160 | 6.33 | +0.66 | |||
| Green Left | 1,126 | 6.14 | +0.81 | |||
| Social Liberals | 994 | 5.42 | -4.96 | |||
| People's Movement against the EU | 658 | 3.59 | -2.18 | |||
| Christian Democrats | 112 | 0.61 | -0.88 | |||
| Total | 18,326 | |||||
| Source[51] | ||||||
1999 European Parliament election in Denmark
| Parties | Vote | |||||
|---|---|---|---|---|---|---|
| Votes | % | + / - | ||||
| Venstre | 4,813 | 25.07 | +3.46 | |||
| Social Democrats | 3,610 | 18.80 | +0.56 | |||
| June Movement | 2,899 | 15.10 | +1.80 | |||
| Social Liberals | 1,993 | 10.38 | -0.05 | |||
| Conservatives | 1,748 | 9.11 | -7.31 | |||
| People's Movement against the EU | 1,107 | 5.77 | -2.20 | |||
| Danish People's Party | 1,088 | 5.67 | New | |||
| Green Left | 1,023 | 5.33 | -2.40 | |||
| Centre Democrats | 631 | 3.29 | +2.70 | |||
| Christian Democrats | 286 | 1.49 | +0.95 | |||
| Progress Party | 108 | 0.56 | -2.60 | |||
| Total | 19,198 | |||||
| Source[52] | ||||||
1994 European Parliament election in Denmark
| Parties | Vote | |||||
|---|---|---|---|---|---|---|
| Votes | % | + / - | ||||
| Venstre | 4,427 | 21.61 | +2.28 | |||
| Social Democrats | 3,736 | 18.24 | -8.94 | |||
| Conservatives | 3,363 | 16.42 | +3.65 | |||
| June Movement | 2,724 | 13.30 | New | |||
| Social Liberals | 2,137 | 10.43 | +5.81 | |||
| People's Movement against the EU | 1,632 | 7.97 | -4.73 | |||
| Green Left | 1,583 | 7.73 | +0.97 | |||
| Progress Party | 648 | 3.16 | -3.09 | |||
| Centre Democrats | 121 | 0.59 | -8.00 | |||
| Christian Democrats | 111 | 0.54 | -1.28 | |||
| Total | 20,482 | |||||
| Source[53] | ||||||
1989 European Parliament election in Denmark
| Parties | Vote | |||||
|---|---|---|---|---|---|---|
| Votes | % | + / - | ||||
| Social Democrats | 4,739 | 27.18 | +5.33 | |||
| Venstre | 3,371 | 19.33 | +3.39 | |||
| Conservatives | 2,226 | 12.77 | -8.43 | |||
| People's Movement against the EU | 2,214 | 12.70 | -4.31 | |||
| Centre Democrats | 1,497 | 8.59 | +2.05 | |||
| Green Left | 1,178 | 6.76 | +0.52 | |||
| Progress Party | 1,089 | 6.25 | +3.06 | |||
| Social Liberals | 805 | 4.62 | -0.70 | |||
| Christian Democrats | 318 | 1.82 | -0.29 | |||
| Total | 17,437 | |||||
| Source[54] | ||||||
1984 European Parliament election in Denmark
| Parties | Vote | |||||
|---|---|---|---|---|---|---|
| Votes | % | |||||
| Social Democrats | 4,381 | 21.85 | ||||
| Conservatives | 4,251 | 21.20 | ||||
| People's Movement against the EU | 3,410 | 17.01 | ||||
| Venstre | 3,195 | 15.94 | ||||
| Centre Democrats | 1,312 | 6.54 | ||||
| Green Left | 1,251 | 6.24 | ||||
| Social Liberals | 1,067 | 5.32 | ||||
| Progress Party | 639 | 3.19 | ||||
| Christian Democrats | 423 | 2.11 | ||||
| Left Socialists | 121 | 0.60 | ||||
| Total | 20,050 | |||||
| Source[55] | ||||||
Referendums
2022 Danish European Union opt-out referendum[56]
| Option | Votes | % |
|---|---|---|
| ✓ YES | 23,544 | 66.01 |
| X NO | 12,125 | 33.99 |
2015 Danish European Union opt-out referendum[57]
| Option | Votes | % |
|---|---|---|
| X NO | 19,616 | 53.12 |
| ✓ YES | 17,315 | 46.88 |
2014 Danish Unified Patent Court membership referendum[58]
| Option | Votes | % |
|---|---|---|
| ✓ YES | 18,200 | 65.24 |
| X NO | 9,696 | 34.76 |
2009 Danish Act of Succession referendum[59]
| Option | Votes | % |
|---|---|---|
| ✓ YES | 24,741 | 85.64 |
| X NO | 4,148 | 14.36 |
2000 Danish euro referendum[60]
| Option | Votes | % |
|---|---|---|
| X NO | 17,910 | 52.14 |
| ✓ YES | 16,442 | 47.86 |
1998 Danish Amsterdam Treaty referendum[61]
| Option | Votes | % |
|---|---|---|
| ✓ YES | 16,756 | 56.23 |
| X NO | 13,045 | 43.77 |
1993 Danish Maastricht Treaty referendum[62]
| Option | Votes | % |
|---|---|---|
| ✓ YES | 19,905 | 59.75 |
| X NO | 13,407 | 40.25 |
1992 Danish Maastricht Treaty referendum[63]
| Option | Votes | % |
|---|---|---|
| ✓ YES | 16,536 | 51.89 |
| X NO | 15,329 | 48.11 |
1986 Danish Single European Act referendum[64]
| Option | Votes | % |
|---|---|---|
| ✓ YES | 17,765 | 61.76 |
| X NO | 10,999 | 38.24 |
1972 Danish European Communities membership referendum[65]
| Option | Votes | % |
|---|---|---|
| ✓ YES | 22,038 | 73.70 |
| X NO | 7,863 | 26.30 |
1953 Danish constitutional and electoral age referendum[66]
| Option | Votes | % |
|---|---|---|
| ✓ YES | 10,890 | 87.33 |
| X NO | 1,580 | 12.67 |
| 21 years | 6,903 | 53.83 |
| 23 years | 5,920 | 46.17 |
1939 Danish constitutional referendum[67]
| Option | Votes | % |
|---|---|---|
| ✓ YES | 7,644 | 90.96 |
| X NO | 760 | 9.04 |
References
- "Middelfartkredsen". kmdvalg.dk (in Danish). Retrieved 2023-06-04.
- "Beretning om Forhandlingerne paa Rigsdagen". Rigsdagstidende. II: Spalte 3892 ff.
- "Nye valgkredse fordeler stemmerne anderledes". dr.dk (in Danish). Retrieved 2023-06-04.
- "Beretning om nye valgkredse som følge af kommunalreformen" (in Danish). Retrieved 2023-06-04.
- "Det danske valgsystem: Valg til Folketinget". valg.im (in Danish). Retrieved 2023-06-04.
- "45 Middelfart". dataforsyningen.dk (in Danish). Retrieved 2023-06-04.
- "Beretning om Forhandlingerne paa Rigsdagen". Rigsdagstidende. II: Spalte 3892 ff.
- "Valgresultater fra tidligere valg:". kmdvalg (in Danish). Retrieved 2023-06-04.
- "FOLKETINGSVALG TIRSDAG 1. NOVEMBER 2022". valg.im (in Danish). Retrieved 2023-06-27.
- "FOLKETINGSVALG ONSDAG 5. JUNI 2019". valg.im (in Danish). Retrieved 2023-06-27.
- "FOLKETINGSVALG TORSDAG 18. JUNI 2015". valg.im (in Danish). Retrieved 2023-06-27.
- "FOLKETINGSVALG TORSDAG 15. SEPTEMBER 2011". valg.im (in Danish). Retrieved 2023-06-27.
- "Folketingsvalget den 13. november 2007". valg.im (in Danish). Retrieved 2023-06-27.
- "valg2005.book" (PDF). valg.im (in Danish). Retrieved 2023-06-27.
- "BMTABEL" (PDF). valg.im (in Danish). Retrieved 2023-06-27.
- "VALG98" (PDF). valg.im (in Danish). Retrieved 2023-06-27.
- "VALG94" (PDF). valg.im (in Danish). Retrieved 2023-06-27.
- "VALG90" (PDF). valg.im (in Danish). Retrieved 2023-06-27.
- "Folketingsvalget den 10. maj 1988". valg.im (in Danish). Retrieved 2023-06-27.
- "Folketingsvalget den 8.september 1987". dst.dk (in Danish). Retrieved 2023-06-27.
- "Folketingsvalget den 10. januar 1984". dst.dk (in Danish). Retrieved 2023-06-27.
- "Folketingsvalget den 8. december 1981". dst.dk (in Danish). Retrieved 2023-06-27.
- "Folketingsvalget den 23. oktober 1979". dst.dk (in Danish). Retrieved 2023-06-27.
- "Folketingsvalget den 15. februar 1977". dst.dk (in Danish). Retrieved 2023-06-27.
- "Folketingsvalget den 9. januar 1975". dst.dk (in Danish). Retrieved 2023-06-27.
- "Folketingsvalget den 4. december 1973". dst.dk (in Danish). Retrieved 2023-06-27.
- "Folketingsvalget den 21. september 1971 samt folkeafstemningen". dst.dk (in Danish). Retrieved 2023-06-27.
- "Folketingsvalget den 23. januar 1968". dst.dk (in Danish). Retrieved 2023-06-27.
- "Folketingsvalget den 22. november 1966". dst.dk (in Danish). Retrieved 2023-06-27.
- "Folketingsvalget den 22. september 1964". dst.dk (in Danish). Retrieved 2023-06-27.
- "Folketingsvalget den 15. november 1960". dst.dk (in Danish). Retrieved 2023-06-27.
- "Folketingsvalget den 14. maj 1957". dst.dk (in Danish). Retrieved 2023-06-27.
- "Folketingsvalget den 22. september 1953". dst.dk (in Danish). Retrieved 2023-06-27.
- "Rigsdagsvalgene og folkeafstemningerne i april og maj 1953". dst.dk (in Danish). Retrieved 2023-06-27.
- "Folketingsvalget den 5. september 1950". dst.dk (in Danish). Retrieved 2023-06-27.
- "Folketingsvalget den 28. oktober 1947". dst.dk (in Danish). Retrieved 2023-06-27.
- "Rigsdagsvalgene i oktober og november 1945". dst.dk (in Danish). Retrieved 2023-06-27.
- "Rigsdagsvalgene i marts og april 1943". dst.dk (in Danish). Retrieved 2023-06-27.
- "Rigsdagsvalgene og Folkeafstemningen i april og maj 1939". dst.dk (in Danish). Retrieved 2023-06-27.
- "Folketingsvalget den 22. oktober 1935". dst.dk (in Danish). Retrieved 2023-06-27.
- "Folketingsvalget den 16. november 1932". dst.dk (in Danish). Retrieved 2023-06-27.
- "Folketingsvalget den 24. april 1929". dst.dk (in Danish). Retrieved 2023-06-27.
- "Folketingsvalget den 2. december 1926". dst.dk (in Danish). Retrieved 2023-06-27.
- "Folketingsvalget den 11. april 1924". dst.dk (in Danish). Retrieved 2023-06-27.
- "Rigsdagsvalgene september-oktober 1920". dst.dk (in Danish). Retrieved 2023-06-27.
- "Rigsdagsvalgene juli-august 1920". dst.dk (in Danish). Retrieved 2023-06-27.
- "Folketingsvalget den 26. april 1920". dst.dk (in Danish). Retrieved 2023-06-27.
- "EUROPA-PARLAMENTSVALG SØNDAG 26. MAJ 2019". dst.dk (in Danish). Retrieved 2023-07-01.
- "EUROPA-PARLAMENTSVALG SØNDAG 25. MAJ 2014". dst.dk (in Danish). Retrieved 2023-07-01.
- "EUROPA-PARLAMENTSVALG SØNDAG 7. JUNI 2009". dst.dk (in Danish). Retrieved 2023-07-01.
- "EUROPA-PARLAMENTSVALGET DEN 13. JUNI 2004" (PDF). im.dk (in Danish). Retrieved 2023-07-01.
- "VALGET TIL EUROPA-PARLAMENTET DEN 10. JUNI 1999" (PDF). im.dk (in Danish). Retrieved 2023-07-01.
- "VALGET TIL EUROPA-PARLAMENTET DEN 9. JUNI 1994" (PDF). im.dk (in Danish). Retrieved 2023-07-01.
- "Valget til Europa-parlamentet den 15. juni 1989". dst.dk (in Danish). Retrieved 2023-07-01.
- "Valget til Europa-Parlamentet den 14. juni 1984". dst.dk (in Danish). Retrieved 2023-07-01.
- "FOLKEAFSTEMNING ONSDAG 1. JUNI 2022". dst.dk (in Danish). Retrieved 2023-07-05.
- "FOLKEAFSTEMNING TORSDAG 3. DECEMBER 2015". dst.dk (in Danish). Retrieved 2023-07-05.
- "FOLKEAFSTEMNING SØNDAG 25. MAJ 2014". dst.dk (in Danish). Retrieved 2023-07-05.
- "FOLKEAFSTEMNING SØNDAG 7. JUNI 2009". dst.dk (in Danish). Retrieved 2023-07-05.
- "FOLKEAFSTEMNINGEN DEN 28. SEPTEMBER 2000 OM DANMARKS DELTAGELSE I DEN FÆLLES VALUTA" (PDF). valg.im (in Danish). Retrieved 2023-07-05.
- "FOLKEAFSTEMNINGEN DEN 28. MAJ 1998OM DANMARKS TILTRÆDELSE AF AMSTERDAMTRAKTATEN" (PDF). valg.im (in Danish). Retrieved 2023-07-05.
- "FOLKEAFSTEMNINGEN DEN 18. MAJ 1993 OM DANMARKS TILTRÆDELSE AF EDINBURGH-AFGØRELSEN OG MAASTRICHT-TRAKTATEN". dst.dk (in Danish). Retrieved 2023-07-05.
- "Folkeafstemningen den 1. juni 1992 om Danmarks tiltrædelse af traktaten om Den Europæiske Union". dst.dk (in Danish). Retrieved 2023-07-05.
- "Vejledende folkeafstemning torsdag den 27. februar 1986 om Danmarks tiltrædelse af EF- pakken". dst.dk (in Danish). Retrieved 2023-07-05.
- "Folkeafstemningen om Danmarks tiltrædelse af De europæiske Fælleskaber 2. oktober 1972". dst.dk (in Danish). Retrieved 2023-07-05.
- "Publikationsfortegnelse vedrørende Folkeafstemninger". dst.dk (in Danish). Retrieved 2023-07-05.
- "Publikationsfortegnelse vedrørende Folkeafstemninger". dst.dk (in Danish). Retrieved 2023-07-05.