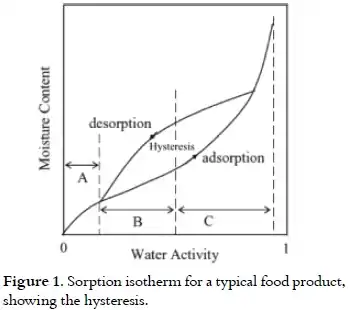
Moisture sorption isotherm
At equilibrium, the relationship between water content and equilibrium relative humidity of a material can be displayed graphically by a curve, the so-called moisture sorption isotherm. For each humidity value, a sorption isotherm indicates the corresponding water content value at a given, constant temperature. If the composition or quality of the material changes, then its sorption behaviour also changes. Because of the complexity of sorption process the isotherms cannot be determined explicitly by calculation, but must be recorded experimentally for each product.

The relationship between water content and water activity (aw) is complex. An increase in aw is usually accompanied by an increase in water content, but in a non-linear fashion. This relationship between water activity and moisture content at a given temperature is called the moisture sorption isotherm. These curves are determined experimentally and constitute the fingerprint of a food system.[1]
BET theory (Brunauer-Emmett-Teller) provides a calculation to describe the physical adsorption of gas molecules on a solid surface. Because of the complexity of the process, these calculations are only moderately successful; however, Stephen Brunauer was able to classify sorption isotherms into five generalized shapes as shown in Figure 2.

He found that Type II and Type III isotherms require highly porous materials or desiccants, with first monolayer adsorption, followed by multilayer adsorption and finally leading to capillary condensation, explaining these materials high moisture capacity at high relative humidity.[2]
Care must be used in extracting data from isotherms, as the representation for each axis may vary in its designation. Brunauer provided the vertical axis as moles of gas adsorbed divided by the moles of the dry material, and on the horizontal axis he used the ratio of partial pressure of the gas just over the sample, divided by its partial pressure at saturation. More modern isotherms showing the sorption of water vapor, on the vertical axis, provide the ratio of the weight of water adsorbed divided by its dry weight , or that ratio converted into a percentage. On the horizontal axis they provide relative humidity or water activity of the air presented to the material.
Sorption Isotherms are named as such because the equilibrium established must be for a constant temperature and this temperature should be specified. Normally, materials hold less moisture when they are hotter, and more moisture when they are colder. Occasionally, a set of isotherms are provided on one graph that shows each curve at a different temperature. Such a set of adsorption isotherms is provided in Figure 3 as measured by Dini on a Type V silica gel.[3]

References
- Bell, L.N., and Labuza, T.P. 2000. "Practical Aspects of Moisture Sorption Isotherm Measurement and Use". 2nd Edition AACC Eagan Press, Eagan, MN
- Brunauer, S. “The Adsorption of Gases and Vapors, Volume 1,” Oxford University Press, 1943, p.49
- Dini, S., “Analysis of Cross-Cooled Desiccant Cooling Systems”, Ph.D. Thesis, Illinois Institute of Technology; 1981