Saint-Maxime-du-Mont-Louis, Quebec
Saint-Maxime-du-Mont-Louis is a municipality in Quebec, Canada. Located in the administrative region of Gaspésie–Îles-de-la-Madeleine and the regional county municipality of La Haute-Gaspésie, the municipality comprises the communities of Mont-Louis, Ruisseau-des-Olives, L'Anse-Pleureuse, Les Côtes-du-Portage and Gros-Morne.
Saint-Maxime-du-Mont-Louis | |
|---|---|
 | |
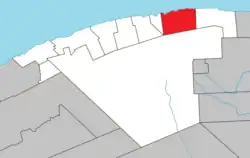
 Location within La Haute-Gaspésie RCM. | |
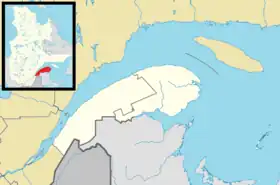
 Saint-Maxime- du-Mont-Louis Location in eastern Quebec. | |
| Coordinates: 49°14′N 65°44′W[1] | |
| Country | |
| Province | |
| Region | Gaspésie–Îles-de-la-Madeleine |
| RCM | La Haute-Gaspésie |
| Constituted | June 10, 1884 |
| Government | |
| • Mayor | Claude Bélanger |
| • Federal riding | Haute-Gaspésie—La Mitis—Matane—Matapédia |
| • Prov. riding | Gaspé |
| Area | |
| • Total | 229.50 km2 (88.61 sq mi) |
| • Land | 231.60 km2 (89.42 sq mi) |
| There is an apparent contradiction between two authoritative sources | |
| Elevation | 15.20 m (49.87 ft) |
| Population | |
| • Total | 1 047 |
| • Density | 4.8/km2 (12/sq mi) |
| • Pop 2006-2011 | |
| • Dwellings | 598 |
| Time zone | UTC−5 (EST) |
| • Summer (DST) | UTC−4 (EDT) |
| Postal code(s) | |
| Area code(s) | 418 and 581 |
| Highways | |
| Website | www |
The municipality had a population of 1,118 as of the Canada 2011 Census.[3]
The eponymous Mount Louis is one of two prominent hills that line the Bay of Mont-Louis (the other being Mount Saint-Pierre). The 465-metre-high (1,526 ft) hill was named after King Louis XIV of France.[1][5]
History

The place was first inhabited by twelve families in 1697 and fifty-three in 1699, but was abandoned by 1702. Later that century, fishing businesses set up in the Mont-Louis Bay, east of the mouth of the Mont-Louis River. It was considered at that time as the best location on the Saint Lawrence River for cod fishing. In 1758, the post was destroyed by General James Wolfe during his Gulf of St. Lawrence Campaign.[1]
By 1863, Mont-Louis had grown to 200 inhabitants, and four years later, the Parish of Saint-Maxime-du-Mont-Louis was founded, which was named after Maxime Tardif (1821–1850), a secretary to Bishop Pierre-Flavien Turgeon. In 1884, the municipality was established, taking its name from the parish.[1]
Demographics
Population
| 2021 | 2011 | |
|---|---|---|
| Population | 1,047 (-7.7% from 2016) | 1,118 (-6.4% from 2006) |
| Land area | 232.67 km2 (89.83 sq mi) | 231.60 km2 (89.42 sq mi) |
| Population density | 4.5/km2 (12/sq mi) | 4.8/km2 (12/sq mi) |
| Median age | 56.8 (M: 56.8, F: 57.2) | 50.8 (M: 50.7, F: 51.1) |
| Private dwellings | 500 (total) | 598 (total) |
| Median household income | $42,137 |
|
|
|
Climate
The locality has a humid continental climate (Dfb) in spite of its marine position with quite cold and snowy winters combined with warm but relatively short summers. Due to its seasonal lag, September is quite some way above the 10 °C (50 °F) threshold for continental above subarctic, but the fifth-warmest month May is some way cooler than that. However, the lag is not as intense as in other eastern Canadian localities, with July being significantly warmer than August.
| Climate data for Mont-Louis | |||||||||||||
|---|---|---|---|---|---|---|---|---|---|---|---|---|---|
| Month | Jan | Feb | Mar | Apr | May | Jun | Jul | Aug | Sep | Oct | Nov | Dec | Year |
| Record high °C (°F) | 12 (54) |
15.6 (60.1) |
20 (68) |
30 (86) |
31 (88) |
36.7 (98.1) |
34.5 (94.1) |
35.6 (96.1) |
32.2 (90.0) |
26.7 (80.1) |
21.7 (71.1) |
17.8 (64.0) |
36.7 (98.1) |
| Average high °C (°F) | −7.2 (19.0) |
−6.1 (21.0) |
−0.2 (31.6) |
5.7 (42.3) |
12.8 (55.0) |
19.1 (66.4) |
22.1 (71.8) |
20.9 (69.6) |
15.8 (60.4) |
9.3 (48.7) |
3 (37) |
−3.6 (25.5) |
7.6 (45.7) |
| Daily mean °C (°F) | −11.7 (10.9) |
−10.6 (12.9) |
−4.7 (23.5) |
1.8 (35.2) |
8.1 (46.6) |
14 (57) |
17.3 (63.1) |
16.3 (61.3) |
11.4 (52.5) |
5.5 (41.9) |
−0.3 (31.5) |
−7.4 (18.7) |
3.3 (37.9) |
| Average low °C (°F) | −16.1 (3.0) |
−15.1 (4.8) |
−9.1 (15.6) |
−2.1 (28.2) |
3.3 (37.9) |
8.9 (48.0) |
12.5 (54.5) |
11.7 (53.1) |
7 (45) |
1.7 (35.1) |
−3.5 (25.7) |
−11.2 (11.8) |
−1 (30) |
| Record low °C (°F) | −35 (−31) |
−30 (−22) |
−25.6 (−14.1) |
−17 (1) |
−10 (14) |
−1.1 (30.0) |
1.1 (34.0) |
1.7 (35.1) |
−3.3 (26.1) |
−9.4 (15.1) |
−20 (−4) |
−27.8 (−18.0) |
−35 (−31) |
| Average precipitation mm (inches) | 64.1 (2.52) |
47.6 (1.87) |
64.8 (2.55) |
62.1 (2.44) |
66.7 (2.63) |
76 (3.0) |
84.7 (3.33) |
91.6 (3.61) |
83.5 (3.29) |
94.1 (3.70) |
70 (2.8) |
79.8 (3.14) |
885 (34.8) |
| Average rainfall mm (inches) | 4.3 (0.17) |
1.8 (0.07) |
12.4 (0.49) |
35.9 (1.41) |
64.2 (2.53) |
76 (3.0) |
84.7 (3.33) |
91.6 (3.61) |
83.5 (3.29) |
91.6 (3.61) |
37.4 (1.47) |
13.3 (0.52) |
596.5 (23.48) |
| Average snowfall cm (inches) | 59.9 (23.6) |
45.9 (18.1) |
52.3 (20.6) |
26.2 (10.3) |
2.5 (1.0) |
0 (0) |
0 (0) |
0 (0) |
0 (0) |
2.5 (1.0) |
32.6 (12.8) |
66.6 (26.2) |
288.5 (113.6) |
| Source: Environment Canada[4] | |||||||||||||
See also
References
- "Saint-Maxime-du-Mont-Louis (Municipalité)" (in French). Commission de toponymie du Québec. Retrieved 2011-12-15.
- "Saint-Maxime-du-Mont-Louis". Répertoire des municipalités (in French). Ministère des Affaires municipales, des Régions et de l'Occupation du territoire. Retrieved 2011-12-15.
- "2011 Community Profiles". 2011 Canadian Census. Statistics Canada. March 21, 2019. Retrieved 2014-02-03.
- Environment Canada, Canadian Climate Normals 1971–2000, accessed 2011-12-15
- "Mont Louis". Peakery. Archived from the original on 2012-07-12. Retrieved 2011-12-15.
- "2021 Community Profiles". 2021 Canadian Census. Statistics Canada. February 4, 2022. Retrieved 2022-04-27.
- "2006 Community Profiles". 2006 Canadian Census. Statistics Canada. August 20, 2019.
- "2001 Community Profiles". 2001 Canadian Census. Statistics Canada. July 18, 2021.
- Statistics Canada: 1996, 2001, 2006, 2011 census