List of National Hockey League attendance figures
The National Hockey League is one of the top attended professional sports in the world, as well as one of the top two attended indoor sports in both average and total attendance. As of the 2018–19 season the NHL averaged 18,250 live spectators per game, and 22,002,081 total for the season.[1]
Leader
| Year | Team | Arena | Home Games | Average Attendance | Total Attendance | Capacity Percentage |
|---|---|---|---|---|---|---|
| 2022–23 | Montreal Canadiens | Bell Centre | 41 | 21,078 | 864,180 | 100.0[2] |
| 2021–22 | Tampa Bay Lightning | Amalie Arena | 41 | 19,092 | 782,772 | 100.0[3] |
| 2020-21 *** | Dallas Stars | American Airlines Center | 28 | 4,341[4] | 121,534 | 23.4%[5] |
| 2019-20 | Chicago Blackhawks | United Center | 34 | 21,441 | 729,000 | 108.7%[6] |
| 2018-19 | 40 | 21,399 | 855,972 | 108.5%[7] | ||
| 2017-18 | 41 | 21,653 | 887,794 | 109.8%[8] | ||
| 2016-17 | 41 | 21,751 | 891,827 | 110.3%[9] | ||
| 2015-16 | 41 | 22,859 | 896,240 | 110.9% [10] | ||
| 2014-15 | 41 | 21,769 | 892,532 | 110.4% [11] | ||
| 2013-14 | 41 | 22,623 | 927,545 | 117.6% [12] | ||
| 2012-13 | 24 | 21,755 | 522,619 | 110.4% [13] | ||
| 2011-12 | 41 | 21,533 | 882,874 | 109.2% [14] | ||
| 2010-11 | 41 | 21,423 | 878,356 | 108.7%[15] | ||
| 2009-10 | 40 | 21,356 | 854,267 | 108.3%[16] | ||
| 2008-09 | 41 | 22,247 | 912,155 | 111.2%[17] | ||
| 2007-08 | Montreal Canadiens | Bell Centre | 41 | 21,273 | 872,193 | 100.0%[18] |
| 2006-07 | 41 | 21,273 | 872,193 | 100.0%[19] | ||
| 2005-06 | 41 | 21,273 | 872,194 | —[20] | ||
| 2004-05 | No NHL Season due to 2004–05 NHL lockout | |||||
| 2003-04 | Montreal Canadiens | Bell Centre | 41 | 20,555 | 842,767 | —[21] |
| 2002-03 | 41 | 20,672 | 847,586 | —[22] | ||
| 2001-02 | Detroit Red Wings | Joe Louis Arena | 41 | 20,058 | 822,378 | —[23] |
| 2000-01 | Montreal Canadiens | Bell Centre | 41 | 20,105 | 824,308 | —[24] |
*** Attendance capacity partially reduced due to government Covid-19 restrictions [25]
2021–22 attendance statistics
| Team | Arena | Home Games | Average Attendance | Total Attendance | Capacity Percentage | |
|---|---|---|---|---|---|---|
| 1. | Tampa Bay Lightning | Amalie Arena | 41 | 19,092 | 782,772 | 100.0[26] |
| 2. | Washington Capitals | Capital One Arena | 41 | 18,573 | 761,493 | 100.4 |
| 3. | Minnesota Wild | Xcel Energy Center | 41 | 18,542 | 760,226 | 100.4 |
| 4. | Nashville Predators | Bridgestone Arena | 41 | 18,495 | 758,317 | 100.6 |
| 5. | Chicago Blackhawks | United Center | 41 | 18,489 | 758,082 | 93.8 |
| 6. | Vegas Golden Knights | T-Mobile Arena | 41 | 18,100 | 742,124 | 104.2 |
| 7. | Dallas Stars | American Airlines Center | 41 | 17,896 | 733,769 | 96.6 |
| 8. | Boston Bruins | TD Garden | 41 | 17,850 | 731,850 | 100.0 |
| 9. | St. Louis Blues | Enterprise Center | 41 | 17,716 | 726,392 | 97.9 |
| 10. | Pittsburgh Penguins | PPG Paints Arena | 41 | 17,684 | 725,046 | 97.2 |
| 11. | Colorado Avalanche | Pepsi Center | 41 | 17,498 | 717,458 | 97.2 |
| 12. | Vancouver Canucks*** | Rogers Arena | 41 | 17,285 | 708,711 | 91.4 |
| 13. | Carolina Hurricanes | PNC Arena | 41 | 17,210 | 705,611 | 92.1 |
| 14. | Seattle Kraken | Climate Pledge Arena | 41 | 17,151 | 703,191 | 100.3 |
| 15. | Detroit Red Wings | Little Caesars Arena | 41 | 16,984 | 696,367 | 87.0 |
| 16. | New York Islanders | UBS Arena | 41 | 16,942 | 694,658 | 99.0 |
| 17. | New York Rangers | Madison Square Garden | 41 | 16,839 | 690,411 | 93.5 |
| 18. | Philadelphia Flyers | Wells Fargo Center | 41 | 16,540 | 678,163 | 84.7 |
| 19. | Columbus Blue Jackets | Nationwide Arena | 41 | 16,237 | 665,722 | 89.5 |
| 20. | Toronto Maple Leafs*** | Scotiabank Arena | 41 | 15,586 | 639,039 | 82.8 |
| 21. | Montreal Canadiens*** | Bell Centre | 41 | 15,495 | 635,297 | 72.8 |
| 22. | Edmonton Oilers*** | Rogers Place | 41 | 14,927 | 612,010 | 80.1 |
| 23. | Los Angeles Kings | Staples Center | 41 | 14,828 | 607,977 | 81.3 |
| 24. | Florida Panthers | BB&T Center | 41 | 14,811 | 607,269 | 86.9 |
| 25. | Calgary Flames*** | Scotiabank Saddledome | 41 | 14,284 | 585,644 | 74.1 |
| 26. | Anaheim Ducks | Honda Center | 41 | 13,083 | 536,403 | 76.2 |
| 27. | New Jersey Devils | Prudential Center | 41 | 12,744 | 522,519 | 77.2 |
| 28. | Winnipeg Jets*** | Bell MTS Place | 41 | 12,716 | 521,357 | 84.8 |
| 29. | San Jose Sharks | SAP Center | 41 | 12,573 | 515,533 | 71.6 |
| 30. | Arizona Coyotes | Gila River Arena | 41 | 11,601 | 475,659 | 67.7 |
| 31. | Buffalo Sabres | KeyBank Center | 41 | 9,997 | 409,908 | 53.7 |
| 32. | Ottawa Senators*** | Canadian Tire Centre | 41 | 9,155 | 375,368 | 47.8 |
| Total | 1,312 | 15,841 | 20,784,346 |
*** Attendance capacity partially reduced due to government Covid-19 restrictions
2019–20 attendance statistics
2018–19 attendance statistics
Notes
- The New York Islanders move half of their home schedule to their former arena, Nassau Coliseum, while continuing to play half their home games at Barclays Center.
- The Scottrade Center was renamed Enterprise Center.
- The Air Canada Centre was renamed Scotiabank Arena.
- Totals do not include two outdoor regular-season and international games.
- The Chicago Blackhawks hosted the Boston Bruins during the 2019 NHL Winter Classic, played at Notre Dame Stadium in Notre Dame, Indiana, on January 1, 2019.
- The Philadelphia Flyers hosted the Pittsburgh Penguins during the 2019 NHL Stadium Series, played at Lincoln Financial Field in Philadelphia on February 23, 2019.
- For the 2018 NHL Global Series, the New Jersey Devils and Edmonton Oilers played at the Scandinavium in Gothenburg, Sweden on October 6, 2018, with New Jersey acting as the home team for the game.
- For the 2018 NHL Global Series, the Florida Panthers and Winnipeg Jets played two games at Hartwall Arena in Helsinki, Finland on November 1 and 2, 2018, with both teams splitting the hosting duties as the home team.
2017–18 attendance statistics
Little Caesars Arena
.jpg.webp)
T-Mobile Arena
Bridgestone Arena

PNC Arena
Notes
- The Vegas Golden Knights began their inaugural season at T-Mobile Arena in Paradise, Nevada during the 2017-18 season.
- The Detroit Red Wings began play at Little Caesars Arena during the season.
- The Verizon Center was renamed Capital One Arena
- The MTS Centre was renamed Bell MTS Place
- Totals do not include three outdoor regular season games.
- The Ottawa Senators hosted the Montreal Canadiens during the NHL 100 Classic, played at TD Place Stadium in Lansdowne Park, Ottawa, on December 16, 2017.
- The Buffalo Sabres and New York Rangers played during the 2018 NHL Winter Classic, played at Citi Field in Queens, New York, on January 1, 2018.
- The Washington Capitals hosted the Toronto Maple Leafs during the 2018 NHL Stadium Series, played at Navy-Marine Corps Memorial Stadium in Annapolis, Maryland on March 3, 2018.
2016–17 attendance statistics
Rogers Place

Nationwide Arena
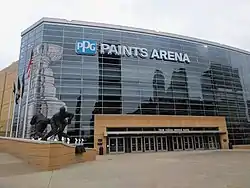
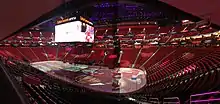
PPG Paints Arena
Scotiabank Saddledome
Notes:
- The Detroit Red Wings will move to Little Caesars Arena for the 2017–18 season.
2015–16 attendance statistics
.jpg.webp)
Barclays Center
_PLAYERS_(4314238200).jpg.webp)
Rexall Place
Joe Louis Arena
.jpg.webp)
SAP Center at San Jose
Notes:
- The New York Islanders moved from Nassau Coliseum to Barclays Center in Brooklyn, New York.
- Totals do not include three outdoor regular season games.
- The Boston Bruins played the Montreal Canadiens outdoors in the Winter Classic at Gillette Stadium in Foxborough, Massachusetts.
- The Minnesota Wild played the Chicago Blackhawks outdoors in the 2016 NHL Stadium Series at TCF Bank Stadium in Minneapolis, Minnesota.
- The Colorado Avalanche played the Detroit Red Wings outdoors in the 2016 NHL Stadium Series at Coors Field in Denver, Colorado.
- The Edmonton Oilers will move to Rogers Place the following season.
2014–15 attendance statistics

Gila River Arena
Honda Center
Prudential Center
Rogers Arena
Notes:
- Totals do not include two outdoor regular season games.[28]
- The Washington Capitals played the Chicago Blackhawks outdoors in the Winter Classic at Nationals Park in Washington, D.C.
- The San Jose Sharks hosted the 2015 NHL Stadium Series at Levi's Stadium in Santa Clara, California, against the Los Angeles Kings.
- Jobing.com Arena renamed Gila River Arena.
2013–14 attendance statistics
Staples Center
Madison Square Garden
PNC Arena

BB&T Center
Notes:
- Totals include six outdoor regular season games.
- The Detroit Red Wings played the Toronto Maple Leafs outdoors in the Winter Classic at Michigan Stadium in Ann Arbor, Michigan
- The inaugural NHL Stadium Series had four games: Anaheim Ducks versus Los Angeles Kings at Los Angeles' Dodger Stadium, Pittsburgh Penguins versus Chicago Blackhawks at Chicago's Soldier Field, and two games at Yankee Stadium, with the New York Rangers playing visitor to both the New Jersey Devils and the New York Islanders.
- The Vancouver Canucks played the Ottawa Senators outdoors in the NHL Heritage Classic at BC Place, in Vancouver, British Columbia.
2012–13 attendance statistics

First Niagara Center

Amalie Arena

MTS Centre

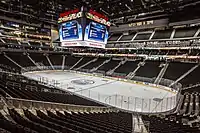
American Airlines Center
2011–12 attendance statistics
Scotiabank Place
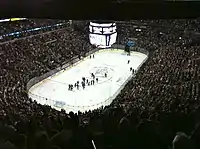
United Center

Pepsi Center
Verizon Center
Notes:
- Totals do not include four regular-season opening games played in Europe, and one outdoor regular season games.
- The Buffalo Sabres played one home game against the Anaheim Ducks at Hartwall Areena in Helsinki, Finland.
- The Anaheim Ducks played one home game against the New York Rangers at the Ericsson Globe in Stockholm, Sweden.
- The Los Angeles Kings played two home games, one against the New York Rangers at Ericsson Globe in Stockholm, Sweden, and one against the Buffalo Sabres at O2 World in Berlin, Germany.
- The Philadelphia Flyers played the New York Rangers outdoors in the Winter Classic at Citizens Bank Park in Philadelphia, Pennsylvania.
See also
References
- "NHL Attendance Relatively Flat For '15-16 Season; Panthers Up Big In South Florida". SportsBusiness Daily. Archived from the original on 18 June 2016. Retrieved 28 June 2016.
- "NHL Attendance". sportsbusinessjournal.com. Retrieved 2023-05-15.
- "2021-2022 NHL Attendance - National Hockey League - ESPN". ESPN.com. Archived from the original on 2022-05-01. Retrieved 2022-07-31.
- Fan attendance was limited in all stadiums due to the COVID-19 pandemic. 11 teams did not have any home fans the entire season.
- "NHL Attendance". Hockey-Reference.com. Retrieved 2021-05-19.
- "2019-2020 NHL Attendance - National Hockey League - ESPN". Espn.go.com. Retrieved 2014-09-13.
- "2018-2019 NHL Attendance - National Hockey League - ESPN". Espn.go.com. Retrieved 2014-09-13.
- "2017-2018 NHL Attendance - National Hockey League - ESPN". Espn.go.com. Retrieved 2014-09-13.
- "2016-2017 NHL Attendance - National Hockey League - ESPN". Espn.go.com. Retrieved 2014-09-13.
- "2015-2016 NHL Attendance - National Hockey League - ESPN". Espn.go.com. Retrieved 2014-09-13.
- "2014-2015 NHL Attendance - National Hockey League - ESPN". Espn.go.com. Archived from the original on 2014-05-13. Retrieved 2014-09-13.
- "2013-2014 NHL Attendance - National Hockey League - ESPN". Espn.go.com. Retrieved 2014-09-13.
- "2012-2013 NHL Attendance - National Hockey League - ESPN". Espn.go.com. Retrieved 2013-09-13.
- "2011-2012 NHL Attendance - National Hockey League - ESPN". Espn.go.com. Retrieved 2013-09-13.
- "2010-2011 NHL Attendance - National Hockey League - ESPN". ESPN.com. Archived from the original on 2021-04-21. Retrieved 2021-03-19.
- "2009-2010 NHL Attendance - National Hockey League - ESPN". ESPN.com. Retrieved 2021-03-19.
- "2008-2009 NHL Attendance - National Hockey League - ESPN". ESPN.com. Retrieved 2021-03-19.
- "2007-2008 NHL Attendance - National Hockey League - ESPN". ESPN.com. Retrieved 2021-03-19.
- "2006-2007 NHL Attendance - National Hockey League - ESPN". ESPN.com. Retrieved 2021-03-19.
- "2005-2006 NHL Attendance - National Hockey League - ESPN". ESPN.com. Retrieved 2021-03-19.
- "2003-2004 NHL Attendance - National Hockey League - ESPN". ESPN.com. Retrieved 2021-03-19.
- "2002-2003 NHL Attendance - National Hockey League - ESPN". ESPN.com. Retrieved 2021-03-19.
- "2001-2002 NHL Attendance - National Hockey League - ESPN". ESPN.com. Retrieved 2021-03-19.
- "2000-2001 NHL Attendance - National Hockey League - ESPN". ESPN.com. Retrieved 2021-03-19.
- AlBaroudi, Wajih (2021-12-15). "Raptors, Maple Leafs, Senators limiting seating capacity to 50% starting Saturday after new Ontario rule". CBSSports.com. Archived from the original on 2023-01-01.
- "2021-2022 NHL Attendance - National Hockey League - ESPN". ESPN.com. Retrieved 2022-07-31.
- "2019-2020 NHL Attendance - National Hockey League - ESPN". Espn.go.com. Retrieved 2014-09-13.
- Jones, Mark (April 13, 2015). "NHL Attendance Increases Again in 2014-15 Season". Bleacher Report. Retrieved 12 May 2016.
| |||||||||
This article is issued from Wikipedia. The text is licensed under Creative Commons - Attribution - Sharealike. Additional terms may apply for the media files.