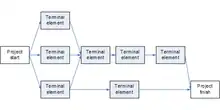
Project network
A project network diagram is a graph that displays the order in which a project’s activities are to be completed. Derived from the work breakdown structure, the terminal elements of a project are organized sequentially based on the relationship among them. It is typically drawn from left to right to reflect project chronology.[1]

Techniques
Activity-on-Node
The Activity-on-Node (AON) technique uses nodes to represent individual project activities and path arrows to designate the sequence of activity completion.[2] Nodes are labelled using information pertaining to the activity. According to Project Management, nodes should at least display the following information:[3]
- Identifier
- Descriptive label
- Activity duration
- Early start time
- Early finish time
- Late start time
- Late finish time
- Activity float (slack)

Start and finish times are used to determine the critical path of a project. Activity float, or slack, time is used in project crashing.
Other techniques
The condition for a valid project network is that it doesn't contain any circular references.
Project dependencies can also be depicted by a predecessor table. Although such a form is very inconvenient for human analysis, project management software often offers such a view for data entry.
An alternative way of showing and analyzing the sequence of project work is the design structure matrix or dependency structure matrix.
See also
References
- "Project Network Diagram". projectauditors.com. Retrieved April 23, 2014.
- Kramer, S. W. & Jenkins, J. L. (2006). Understanding the basics of CPM calculations: what is scheduling software really telling you? Paper presented at PMI® Global Congress 2006—North America, Seattle, WA. Newtown Square, PA: Project Management Institute.
- Pinto, Jeffrey K. (2019). Project management : achieving competitive advantage (Fifth ed.). New York, NY. pp. 316–319. ISBN 978-0-13-473033-2. OCLC 1007502136.
{{cite book}}: CS1 maint: location missing publisher (link)