Noise curve
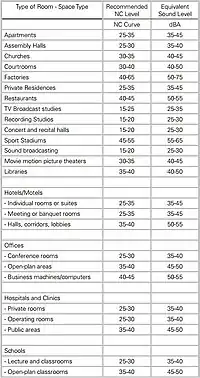
Noise curves are a common way to characterise background noise in unoccupied buildings and spaces.[1] Their purpose is to produce a single-value representation of a complete sound spectrum. International standards organizations (ISO,[2] ANSI[3] and ASA) recognize the need to objectify judgements on the amount of ambient noise in enclosed spaces, and provide us with definitions for various noise curves.[4] The ANSI/ASA S12.2-2008 standard, for example, recommends an NC value of 25-35 for schools and 15-18 for concert halls.[5]


Background noise may have several undesirable effects. Noise can be an annoyance that creates fatigue and negatively affects productivity, safety and the ability to communicate. Therefore, standard methodologies for quantifying noise have been developed. Noise curves reflect different standardized means of creating a single number rating for the background noise spectrum in a space. Different rooms, locations, regulations, and applications may allow different acceptable noise ratings. In most cases, the goal is that background noise should not interfere with the purpose of the room, e.g. the noise of an office air-conditioning system and consistent noise of traffic outside the building should not interfere with telephone calls or conversations. In other cases, special noise may also be tolerated or even introduced at higher levels, for example to create acoustic "privacy", or to help mask other more irritating noise sources.
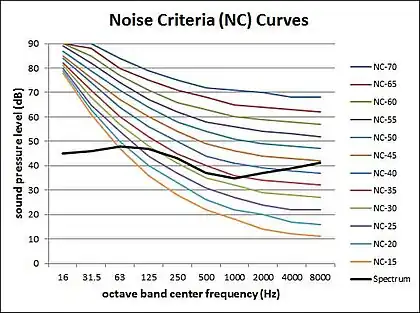
The process of determining the single value for a particular room is first to measure the sound frequency spectrum created by the background noise in the room while the room is unoccupied. This spectrum is then superimposed onto a template graph containing the noise curves. The result is determined by the lowest curve which is not touched by the measured spectrum at any position in the audio frequency range.
Noise curves serve as uniform measuring standards and are referred to by many noise regulations covering a variety of locations from concert halls, rock concerts, lecture rooms and offices to clay target shooting ranges. There are five major methods and standards for noise curves:[4]
- Noise Criterion Curves (NC)
- Noise Rating Curves (NR)
- Preferred Noise Criterion Curves (PNC)
- Room Criteria Curves (RC)
- Room Noise Criteria (RNC)