Nottingham West (UK Parliament constituency)
Nottingham West was a borough constituency in the city of Nottingham. It returned one Member of Parliament (MP) to the House of Commons of the Parliament of the United Kingdom.
| Nottingham West | |
|---|---|
| Former Borough constituency for the House of Commons | |
| 1955–1983 | |
| Seats | one |
| Created from | Nottingham Central and Nottingham North West |
| Replaced by | Nottingham South and Nottingham North[1] |
| 1885–1950 | |
| Seats | one |
The constituency was created for the 1885 general election, and abolished for the 1950 general election. However, a new Nottingham West constituency was created for the 1955 general election, and was in turn abolished for the 1983 general election.
Boundaries
1885–1918: The Borough of Nottingham wards of Broxtowe, Forest, St Albans, Sherwood, and Wollaton.
1918–1955: The County Borough of Nottingham wards of Broxtowe, St Albans, and Wollaton.
The constituency was renamed Nottingham North West from 1950 to 1955, but its boundaries remained unchanged.
1955–1974: The County Borough of Nottingham wards of Abbey, Broxtowe, Robin Hood, and Wollaton.
1974–1983: The County Borough of Nottingham wards of Abbey, Broxtowe, Clifton, Robin Hood, University, and Wollaton.
Members of Parliament
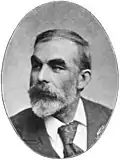
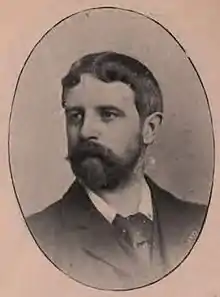
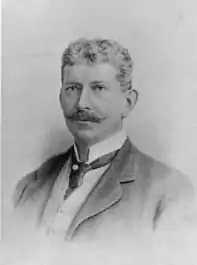
MPs 1885-1950
MPs 1955-1983
| Election | Member | Party | |
|---|---|---|---|
| 1955 | constituency re-established | ||
| 1955 | Tom O'Brien | Labour | |
| 1959 | Peter Tapsell | Conservative | |
| 1964 | Michael English | Labour | |
| 1983 | constituency abolished | ||
Elections
Elections in the 1880s

| Party | Candidate | Votes | % | ±% | |
|---|---|---|---|---|---|
| Liberal | Charles Seely | 6,669 | 60.3 | ||
| Conservative | Edward Cope | 3,797 | 34.3 | ||
| Social Democratic Federation | John Burns | 598 | 5.4 | ||
| Majority | 2,872 | 26.0 | |||
| Turnout | 11,064 | 74.1 | |||
| Registered electors | 14,929 | ||||
| Liberal win (new seat) | |||||

| Party | Candidate | Votes | % | ±% | |
|---|---|---|---|---|---|
| Lib-Lab | Henry Broadhurst | 5,458 | 54.2 | −6.1 | |
| Liberal Unionist | Charles Seely | 4,609 | 45.8 | +11.5 | |
| Majority | 849 | 8.4 | −17.6 | ||
| Turnout | 10,067 | 67.4 | −6.7 | ||
| Registered electors | 14,929 | ||||
| Lib-Lab hold | Swing | −8.8 | |||
Elections in the 1890s
| Party | Candidate | Votes | % | ±% | |
|---|---|---|---|---|---|
| Liberal Unionist | Charles Seely | 5,610 | 51.4 | +5.6 | |
| Lib-Lab | Henry Broadhurst | 5,309 | 48.6 | −5.6 | |
| Majority | 301 | 2.8 | N/A | ||
| Turnout | 10,919 | 81.4 | +14.0 | ||
| Registered electors | 13,411 | ||||
| Liberal Unionist gain from Lib-Lab | Swing | +5.6 | |||

| Party | Candidate | Votes | % | ±% | |
|---|---|---|---|---|---|
| Liberal | James Yoxall | 6,088 | 52.2 | +3.6 | |
| Liberal Unionist | Arthur Goldsmith Sparrow | 5,575 | 47.8 | −3.6 | |
| Majority | 513 | 4.4 | N/A | ||
| Turnout | 11,663 | 80.4 | −1.0 | ||
| Registered electors | 14,510 | ||||
| Liberal gain from Liberal Unionist | Swing | +3.6 | |||
Elections in the 1900s

| Party | Candidate | Votes | % | ±% | |
|---|---|---|---|---|---|
| Liberal | James Yoxall | 6,023 | 51.6 | −0.6 | |
| Liberal Unionist | Lepel Griffin | 5,639 | 48.4 | +0.6 | |
| Majority | 384 | 3.2 | −1.2 | ||
| Turnout | 11,662 | 78.4 | −2.0 | ||
| Registered electors | 14,873 | ||||
| Liberal hold | Swing | −0.6 | |||
| Party | Candidate | Votes | % | ±% | |
|---|---|---|---|---|---|
| Liberal | James Yoxall | 8,107 | 60.6 | +9.0 | |
| Liberal Unionist | William Laurence Pemberton Rowley | 5,262 | 39.4 | −9.0 | |
| Majority | 2,845 | 21.2 | +18.0 | ||
| Turnout | 13,369 | 81.0 | +2.6 | ||
| Registered electors | 16,506 | ||||
| Liberal hold | Swing | +9.0 | |||
Elections in the 1910s

| Party | Candidate | Votes | % | ±% | |
|---|---|---|---|---|---|
| Liberal | James Yoxall | 8,955 | 57.4 | −3.2 | |
| Liberal Unionist | Henry Lygon | 6,652 | 42.6 | +3.2 | |
| Majority | 2,303 | 14.8 | −6.4 | ||
| Turnout | 15,607 | 89.3 | +8.3 | ||
| Registered electors | 17,476 | ||||
| Liberal hold | Swing | −3.2 | |||
| Party | Candidate | Votes | % | ±% | |
|---|---|---|---|---|---|
| Liberal | James Yoxall | 8,141 | 57.8 | +0.4 | |
| Conservative | Bernard Swanwick Wright | 5,949 | 42.2 | −0.4 | |
| Majority | 2,192 | 15.6 | +0.8 | ||
| Turnout | 14,090 | 80.6 | −8.7 | ||
| Registered electors | 17,476 | ||||
| Liberal hold | Swing | +0.4 | |||
| Party | Candidate | Votes | % | ±% | |
|---|---|---|---|---|---|
| Labour | Arthur Hayday | 7,286 | 56.8 | New | |
| Liberal | Arthur Richardson | 5,552 | 43.2 | −14.6 | |
| Majority | 1,734 | 13.6 | N/A | ||
| Turnout | 12,838 | 42.6 | −38.0 | ||
| Registered electors | 30,105 | ||||
| Labour gain from Liberal | Swing | N/A | |||
Elections in the 1920s
| Party | Candidate | Votes | % | ±% | |
|---|---|---|---|---|---|
| Labour | Arthur Hayday | 10,787 | 49.0 | −7.8 | |
| Unionist | George Herbert Powell | 6,050 | 27.5 | New | |
| Liberal | Alec Lionel Rea | 5,163 | 23.4 | −19.6 | |
| Majority | 4,737 | 21.5 | +7.9 | ||
| Turnout | 22,000 | 72.5 | +29.9 | ||
| Registered electors | 30,332 | ||||
| Labour hold | Swing | +6.0 | |||
| Party | Candidate | Votes | % | ±% | |
|---|---|---|---|---|---|
| Labour | Arthur Hayday | 12,366 | 62.7 | +13.7 | |
| Unionist | James Langham Litchfield | 7,370 | 37.3 | +9.8 | |
| Majority | 4,996 | 25.4 | +3.9 | ||
| Turnout | 19,736 | 63.5 | −9.0 | ||
| Registered electors | 31,093 | ||||
| Labour hold | Swing | +2.0 | |||
| Party | Candidate | Votes | % | ±% | |
|---|---|---|---|---|---|
| Labour | Arthur Hayday | 12,782 | 56.6 | −6.1 | |
| Constitutionalist | Charles Loseby | 9,790 | 43.4 | +6.1 | |
| Majority | 2,992 | 13.2 | −12.2 | ||
| Turnout | 22,572 | 71.5 | +8.0 | ||
| Registered electors | 31,574 | ||||
| Labour hold | Swing | −6.1 | |||
| Party | Candidate | Votes | % | ±% | |
|---|---|---|---|---|---|
| Labour | Arthur Hayday | 18,593 | 55.1 | −1.5 | |
| Liberal | Walter Edward Barron | 8,276 | 24.5 | New | |
| Unionist | Charles Loseby | 6,893 | 20.4 | −23.0 | |
| Majority | 10,317 | 30.6 | +17.4 | ||
| Turnout | 33,762 | 79.8 | +8.3 | ||
| Registered electors | 42,314 | ||||
| Labour hold | Swing | +10.8 | |||
Elections in the 1930s
| Party | Candidate | Votes | % | ±% | |
|---|---|---|---|---|---|
| Conservative | Arthur Caporn | 20,596 | 57.9 | +37.5 | |
| Labour | Arthur Hayday | 14,963 | 42.1 | −13.0 | |
| Majority | 5,633 | 15.8 | −14.8 | ||
| Turnout | 35,559 | 76.4 | −3.4 | ||
| Conservative gain from Labour | Swing | ||||
| Party | Candidate | Votes | % | ±% | |
|---|---|---|---|---|---|
| Labour | Arthur Hayday | 19,697 | 53.7 | +11.6 | |
| Conservative | Arthur Caporn | 16,987 | 46.3 | −11.6 | |
| Majority | 2,710 | 7.4 | N/A | ||
| Turnout | 36,684 | 71.4 | −5.0 | ||
| Labour gain from Conservative | Swing | ||||
Elections in the 1940s
| Party | Candidate | Votes | % | ±% | |
|---|---|---|---|---|---|
| Labour | Tom O'Brien | 24,887 | 59.6 | +5.9 | |
| Conservative | Bernard Stephen Townroe | 9,711 | 23.2 | −23.1 | |
| Liberal | Samuel Arthur John Young | 7,184 | 17.2 | New | |
| Majority | 15,176 | 36.4 | +29.0 | ||
| Turnout | 41,782 | 76.3 | +4.9 | ||
| Labour hold | Swing | ||||
Elections in the 1950s
| Party | Candidate | Votes | % | ±% | |
|---|---|---|---|---|---|
| Labour | Tom O'Brien | 25,539 | 54.14 | ||
| Conservative | Francis Michael Richardson | 21,631 | 45.86 | ||
| Majority | 3,908 | 8.28 | |||
| Turnout | 47,170 | 76.12 | |||
| Registered electors | 61,969 | ||||
| Labour win (new seat) | |||||
| Party | Candidate | Votes | % | ±% | |
|---|---|---|---|---|---|
| Conservative | Peter Tapsell | 22,052 | 50.19 | +4.33 | |
| Labour | Tom O'Brien | 21,888 | 49.81 | −4.33 | |
| Majority | 164 | 0.38 | N/A | ||
| Turnout | 43,940 | 70.84 | −5.28 | ||
| Registered electors | 62,030 | ||||
| Conservative gain from Labour | Swing | +4.33 | |||
Elections in the 1960s
| Party | Candidate | Votes | % | ±% | |
|---|---|---|---|---|---|
| Labour | Michael English | 23,035 | 52.59 | +2.78 | |
| Conservative | Peter Tapsell | 20,763 | 47.41 | −2.78 | |
| Majority | 2,272 | 5.18 | N/A | ||
| Turnout | 43,798 | 81.80 | +10.96 | ||
| Registered electors | 53,542 | ||||
| Labour gain from Conservative | Swing | +2.78 | |||
| Party | Candidate | Votes | % | ±% | |
|---|---|---|---|---|---|
| Labour | Michael English | 23,859 | 57.95 | +5.36 | |
| Conservative | David J Penfold | 17,311 | 42.05 | −5.36 | |
| Majority | 6,548 | 15.90 | +10.72 | ||
| Turnout | 41,170 | 78.33 | −3.47 | ||
| Registered electors | 52,561 | ||||
| Labour hold | Swing | +5.36 | |||
Elections in the 1970s
| Party | Candidate | Votes | % | ±% | |
|---|---|---|---|---|---|
| Labour | Michael English | 21,255 | 52.80 | −5.15 | |
| Conservative | Martin W Suthers | 19,003 | 47.20 | +5.15 | |
| Majority | 2,252 | 5.60 | −10.30 | ||
| Turnout | 40,258 | 70.92 | |||
| Labour hold | Swing | ||||
| Party | Candidate | Votes | % | ±% | |
|---|---|---|---|---|---|
| Labour | Michael English | 27,592 | 45.50 | −7.30 | |
| Conservative | Peter Lloyd | 21,795 | 35.94 | −11.26 | |
| Liberal | Andrew Marshall Johnson | 11,260 | 18.57 | New | |
| Majority | 5,797 | 9.56 | +3.96 | ||
| Turnout | 60,647 | 78.84 | +7.92 | ||
| Labour hold | Swing | ||||
| Party | Candidate | Votes | % | ±% | |
|---|---|---|---|---|---|
| Labour | Michael English | 27,373 | 49.70 | +4.20 | |
| Conservative | Peter Lloyd | 18,108 | 32.88 | −3.06 | |
| Liberal | Andrew Marshall Johnson | 9,598 | 17.43 | −1.14 | |
| Majority | 9,265 | 16.82 | +7.26 | ||
| Turnout | 55,079 | 70.93 | −7.91 | ||
| Labour hold | Swing | +3.63 | |||
| Party | Candidate | Votes | % | ±% | |
|---|---|---|---|---|---|
| Labour | Michael English | 26,301 | 46.54 | −3.15 | |
| Conservative | Margaret Ethel Stoneman | 23,801 | 42.12 | +9.24 | |
| Liberal | Michael John Willis | 5,497 | 9.73 | −7.70 | |
| National Front | Terence John Wilkinson | 718 | 1.27 | New | |
| Workers Revolutionary | Arthur Ufton James | 192 | 0.34 | New | |
| Majority | 2,500 | 4.42 | −12.40 | ||
| Turnout | 56,509 | 73.24 | +2.31 | ||
| Labour hold | Swing | −6.20 | |||
References
- "'Nottingham West', Feb 1974 - May 1983". ElectionWeb Project. Cognitive Computing Limited. Retrieved 23 March 2016.
- British parliamentary election results, 1885-1918 (Craig)
- British Parliamentary Election Results 1918-1949, FWS Craig
- British parliamentary election results, 1950-1973 by FWS Craig
- Kimber, Richard. "UK General Election results 1955". Political Science Resources. Retrieved 17 April 2016.
- Kimber, Richard. "UK General Election results 1959". Political Science Resources. Archived from the original on 8 October 2016. Retrieved 17 April 2016.
- Kimber, Richard. "UK General Election results 1964". Political Science Resources. Retrieved 17 April 2016.
- Kimber, Richard. "UK General Election results 1966". Political Science Resources. Retrieved 17 April 2016.
- Kimber, Richard. "UK General Election results 1970". Political Science Resources. Archived from the original on 29 November 2014. Retrieved 23 March 2016.
- Kimber, Richard. "UK General Election results February 1974". Political Science Resources. Archived from the original on 4 March 2016. Retrieved 23 March 2016.
- Kimber, Richard. "UK General Election results October 1974". Political Science Resources. Retrieved 23 March 2016.
- Kimber, Richard. "UK General Election results 1979". Political Science Resources. Archived from the original on 4 March 2016. Retrieved 23 March 2016.