Odense East (nomination district)
Odense East nominating district is one of the 92 nominating districts that exists for Danish elections following the 2007 municipal reform.[3][4][5] It is one of the three nomination districts in Odense Municipality, the others being Odense West and Odense South.[6] It was created in 1970[7] and has maintained its boundaries since then.
| Odense East | |
|---|---|
| Odense Øst | |
| Nomination district constituency for the Folketing | |
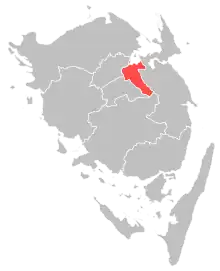 Location of Odense East within Funen | |
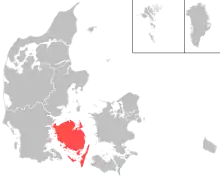 Location of Funen within Denmark | |
| Municipalities | Odense |
| Constituency | Funen |
| Electorate | 53,406 (2022)[1] |
| Current constituency | |
| Created | 1970[2] |
In general elections, the district is a very strong area for parties commonly associated with the red bloc.[8]
General elections results
General elections in the 2020s
| Parties | Vote | |||||
|---|---|---|---|---|---|---|
| Votes | % | + / - | ||||
| Social Democrats | 12,411 | 30.17 | +2.08 | |||
| Green Left | 4,299 | 10.45 | +2.35 | |||
| Moderates | 3,952 | 9.61 | New | |||
| Venstre | 3,579 | 8.70 | -8.27 | |||
| Red–Green Alliance | 2,928 | 7.12 | -2.91 | |||
| Liberal Alliance | 2,921 | 7.10 | +4.55 | |||
| Conservatives | 2,008 | 4.88 | +0.19 | |||
| Social Liberals | 1,933 | 4.70 | -8.50 | |||
| Denmark Democrats | 1,803 | 4.38 | New | |||
| Independent Greens | 1,725 | 4.19 | New | |||
| The Alternative | 1,549 | 3.77 | -0.67 | |||
| New Right | 971 | 2.36 | +0.77 | |||
| Danish People's Party | 850 | 2.07 | -4.35 | |||
| Christian Democrats | 160 | 0.39 | -0.58 | |||
| Millah Kongsbach | 44 | 0.11 | New | |||
| Total | 41,133 | |||||
| Source[9] | ||||||
General elections in the 2010s
| Parties | Vote | |||||
|---|---|---|---|---|---|---|
| Votes | % | + / - | ||||
| Social Democrats | 12,015 | 28.09 | -2.04 | |||
| Venstre | 7,259 | 16.97 | +4.43 | |||
| Social Liberals | 5,646 | 13.20 | +8.63 | |||
| Red–Green Alliance | 4,291 | 10.03 | -2.71 | |||
| Green Left | 3,464 | 8.10 | +2.45 | |||
| Danish People's Party | 2,745 | 6.42 | -11.05 | |||
| Conservatives | 2,006 | 4.69 | +1.86 | |||
| The Alternative | 1,901 | 4.44 | -1.51 | |||
| Liberal Alliance | 1,091 | 2.55 | -5.11 | |||
| Stram Kurs | 872 | 2.04 | New | |||
| New Right | 682 | 1.59 | New | |||
| Christian Democrats | 417 | 0.97 | +0.50 | |||
| Klaus Riskær Pedersen Party | 390 | 0.91 | New | |||
| Total | 42,779 | |||||
| Source[10] | ||||||
| Parties | Vote | |||||
|---|---|---|---|---|---|---|
| Votes | % | + / - | ||||
| Social Democrats | 12,493 | 30.13 | -2.49 | |||
| Danish People's Party | 7,245 | 17.47 | +7.20 | |||
| Red–Green Alliance | 5,282 | 12.74 | +4.04 | |||
| Venstre | 5,199 | 12.54 | -3.75 | |||
| Liberal Alliance | 3,176 | 7.66 | +3.41 | |||
| The Alternative | 2,466 | 5.95 | New | |||
| Green Left | 2,343 | 5.65 | -7.18 | |||
| Social Liberals | 1,895 | 4.57 | -5.31 | |||
| Conservatives | 1,172 | 2.83 | -1.90 | |||
| Christian Democrats | 194 | 0.47 | +0.08 | |||
| Total | 41,465 | |||||
| Source[11] | ||||||
| Parties | Vote | |||||
|---|---|---|---|---|---|---|
| Votes | % | + / - | ||||
| Social Democrats | 13,425 | 32.62 | +1.37 | |||
| Venstre | 6,704 | 16.29 | +2.65 | |||
| Green Left | 5,279 | 12.83 | -6.00 | |||
| Danish People's Party | 4,227 | 10.27 | -2.98 | |||
| Social Liberals | 4,066 | 9.88 | +4.23 | |||
| Red–Green Alliance | 3,581 | 8.70 | +5.99 | |||
| Conservatives | 1,948 | 4.73 | -6.92 | |||
| Liberal Alliance | 1,748 | 4.25 | +1.67 | |||
| Christian Democrats | 159 | 0.39 | -0.06 | |||
| Michael Ellegård | 9 | 0.02 | +0.01 | |||
| Lars Grønbæk Larsen | 4 | 0.01 | New | |||
| Total | 41,150 | |||||
| Source[12] | ||||||
General elections in the 2000s
| Parties | Vote | |||||
|---|---|---|---|---|---|---|
| Votes | % | + / - | ||||
| Social Democrats | 12,459 | 31.25 | -4.37 | |||
| Green Left | 7,507 | 18.83 | +11.47 | |||
| Venstre | 5,439 | 13.64 | -1.50 | |||
| Danish People's Party | 5,282 | 13.25 | +1.24 | |||
| Conservatives | 4,645 | 11.65 | -1.25 | |||
| Social Liberals | 2,251 | 5.65 | -4.74 | |||
| Red–Green Alliance | 1,080 | 2.71 | -1.42 | |||
| New Alliance | 1,028 | 2.58 | New | |||
| Christian Democrats | 181 | 0.45 | -0.50 | |||
| Michael Ellegård | 3 | 0.01 | New | |||
| Total | 39,875 | |||||
| Source[13] | ||||||
| Parties | Vote | |||||
|---|---|---|---|---|---|---|
| Votes | % | + / - | ||||
| Social Democrats | 13,643 | 35.62 | -1.39 | |||
| Venstre | 5,798 | 15.14 | -2.46 | |||
| Conservatives | 4,940 | 12.90 | -1.53 | |||
| Danish People's Party | 4,601 | 12.01 | +0.84 | |||
| Social Liberals | 3,980 | 10.39 | +5.41 | |||
| Green Left | 2,819 | 7.36 | -0.82 | |||
| Red–Green Alliance | 1,580 | 4.13 | +1.04 | |||
| Centre Democrats | 470 | 1.23 | -0.41 | |||
| Christian Democrats | 362 | 0.95 | -0.44 | |||
| Minority Party | 110 | 0.29 | New | |||
| Total | 38,303 | |||||
| Source[14] | ||||||
| Parties | Vote | |||||
|---|---|---|---|---|---|---|
| Votes | % | + / - | ||||
| Social Democrats | 14,263 | 37.01 | -8.42 | |||
| Venstre | 6,782 | 17.60 | +2.24 | |||
| Conservatives | 5,562 | 14.43 | +5.74 | |||
| Danish People's Party | 4,303 | 11.17 | +4.27 | |||
| Green Left | 3,151 | 8.18 | -2.38 | |||
| Social Liberals | 1,920 | 4.98 | +0.96 | |||
| Red–Green Alliance | 1,191 | 3.09 | -0.04 | |||
| Centre Democrats | 632 | 1.64 | -1.61 | |||
| Christian People's Party | 535 | 1.39 | -0.01 | |||
| Progress Party | 197 | 0.51 | -0.47 | |||
| Total | 38,536 | |||||
| Source[15] | ||||||
General elections in the 1990s
| Parties | Vote | |||||
|---|---|---|---|---|---|---|
| Votes | % | + / - | ||||
| Social Democrats | 17,958 | 45.43 | -1.55 | |||
| Venstre | 6,073 | 15.36 | +0.36 | |||
| Green Left | 4,173 | 10.56 | +1.23 | |||
| Conservatives | 3,434 | 8.69 | -3.32 | |||
| Danish People's Party | 2,728 | 6.90 | New | |||
| Social Liberals | 1,591 | 4.02 | -0.33 | |||
| Centre Democrats | 1,284 | 3.25 | +1.46 | |||
| Red–Green Alliance | 1,237 | 3.13 | -0.39 | |||
| Christian People's Party | 552 | 1.40 | +0.34 | |||
| Progress Party | 387 | 0.98 | -4.83 | |||
| Democratic Renewal | 109 | 0.28 | New | |||
| Svend Jensen | 7 | 0.02 | New | |||
| Total | 39,533 | |||||
| Source[16] | ||||||
| Parties | Vote | |||||
|---|---|---|---|---|---|---|
| Votes | % | + / - | ||||
| Social Democrats | 18,339 | 46.98 | -2.88 | |||
| Venstre | 5,854 | 15.00 | +6.01 | |||
| Conservatives | 4,690 | 12.01 | -0.24 | |||
| Green Left | 3,642 | 9.33 | -1.50 | |||
| Progress Party | 2,267 | 5.81 | +0.46 | |||
| Social Liberals | 1,699 | 4.35 | +1.37 | |||
| Red–Green Alliance | 1,373 | 3.52 | +1.46 | |||
| Centre Democrats | 697 | 1.79 | -1.49 | |||
| Christian People's Party | 414 | 1.06 | -0.04 | |||
| Michael Ellegård | 39 | 0.10 | New | |||
| Leif Nybo | 12 | 0.03 | New | |||
| Else Lundgaard | 6 | 0.02 | New | |||
| Bjørn Henriksen | 5 | 0.01 | New | |||
| Total | 39,037 | |||||
| Source[17] | ||||||
| Parties | Vote | |||||
|---|---|---|---|---|---|---|
| Votes | % | + / - | ||||
| Social Democrats | 18,778 | 49.86 | +9.37 | |||
| Conservatives | 4,615 | 12.25 | -2.52 | |||
| Green Left | 4,080 | 10.83 | -6.86 | |||
| Venstre | 3,385 | 8.99 | +4.53 | |||
| Progress Party | 2,013 | 5.35 | -2.75 | |||
| Centre Democrats | 1,237 | 3.28 | +0.31 | |||
| Social Liberals | 1,124 | 2.98 | -1.64 | |||
| Red–Green Alliance | 775 | 2.06 | New | |||
| Common Course | 509 | 1.35 | -1.05 | |||
| The Greens | 484 | 1.29 | -0.26 | |||
| Christian People's Party | 415 | 1.10 | +0.05 | |||
| Justice Party of Denmark | 201 | 0.53 | New | |||
| Tage Abildgart | 23 | 0.06 | New | |||
| Humanist Party | 14 | 0.04 | New | |||
| Mogens Trondhjem | 6 | 0.02 | New | |||
| Total | 37,659 | |||||
| Source[18] | ||||||
General elections in the 1980s
| Parties | Vote | |||||
|---|---|---|---|---|---|---|
| Votes | % | + / - | ||||
| Social Democrats | 15,386 | 40.49 | +0.82 | |||
| Green Left | 6,722 | 17.69 | -2.64 | |||
| Conservatives | 5,611 | 14.77 | -0.79 | |||
| Progress Party | 3,079 | 8.10 | +3.64 | |||
| Social Liberals | 1,756 | 4.62 | -0.41 | |||
| Venstre | 1,695 | 4.46 | +0.75 | |||
| Centre Democrats | 1,129 | 2.97 | +0.07 | |||
| Common Course | 913 | 2.40 | +0.07 | |||
| The Greens | 590 | 1.55 | +0.24 | |||
| Communist Party of Denmark | 458 | 1.21 | -0.04 | |||
| Christian People's Party | 398 | 1.05 | -0.24 | |||
| Left Socialists | 255 | 0.67 | -0.64 | |||
| Carl Erik Jørgensen | 3 | 0.01 | New | |||
| Total | 37,995 | |||||
| Source[19] | ||||||
| Parties | Vote | |||||
|---|---|---|---|---|---|---|
| Votes | % | + / - | ||||
| Social Democrats | 15,349 | 39.67 | -5.65 | |||
| Green Left | 7,866 | 20.33 | +5.04 | |||
| Conservatives | 6,021 | 15.56 | -2.14 | |||
| Social Liberals | 1,945 | 5.03 | +0.75 | |||
| Progress Party | 1,726 | 4.46 | +2.01 | |||
| Venstre | 1,436 | 3.71 | -1.32 | |||
| Centre Democrats | 1,122 | 2.90 | -0.43 | |||
| Common Course | 903 | 2.33 | New | |||
| The Greens | 507 | 1.31 | New | |||
| Left Socialists | 507 | 1.31 | -1.33 | |||
| Christian People's Party | 498 | 1.29 | -0.14 | |||
| Communist Party of Denmark | 484 | 1.25 | +0.23 | |||
| Justice Party of Denmark | 164 | 0.42 | -0.93 | |||
| Humanist Party | 96 | 0.25 | New | |||
| Socialist Workers Party | 32 | 0.08 | 0.00 | |||
| Marxist–Leninists Party | 26 | 0.07 | +0.01 | |||
| Henrik Nørregård Nielsen | 9 | 0.02 | New | |||
| Total | 38,691 | |||||
| Source[20] | ||||||
| Parties | Vote | |||||
|---|---|---|---|---|---|---|
| Votes | % | + / - | ||||
| Social Democrats | 17,245 | 45.32 | -0.47 | |||
| Conservatives | 6,734 | 17.70 | +6.78 | |||
| Green Left | 5,819 | 15.29 | -0.21 | |||
| Venstre | 1,913 | 5.03 | +0.30 | |||
| Social Liberals | 1,630 | 4.28 | +0.45 | |||
| Centre Democrats | 1,268 | 3.33 | -2.95 | |||
| Left Socialists | 1,004 | 2.64 | +0.02 | |||
| Progress Party | 933 | 2.45 | -3.43 | |||
| Christian People's Party | 546 | 1.43 | +0.25 | |||
| Justice Party of Denmark | 513 | 1.35 | +0.08 | |||
| Communist Party of Denmark | 390 | 1.02 | -0.79 | |||
| Socialist Workers Party | 29 | 0.08 | 0.00 | |||
| Marxist–Leninists Party | 24 | 0.06 | New | |||
| Carl Erik Jørgensen | 5 | 0.01 | New | |||
| Total | 38,053 | |||||
| Source[21] | ||||||
| Parties | Vote | |||||
|---|---|---|---|---|---|---|
| Votes | % | + / - | ||||
| Social Democrats | 15,672 | 45.79 | -6.91 | |||
| Green Left | 5,307 | 15.50 | +7.66 | |||
| Conservatives | 3,737 | 10.92 | +1.06 | |||
| Centre Democrats | 2,151 | 6.28 | +3.84 | |||
| Progress Party | 2,011 | 5.88 | -2.14 | |||
| Venstre | 1,619 | 4.73 | +0.14 | |||
| Social Liberals | 1,311 | 3.83 | +0.01 | |||
| Left Socialists | 898 | 2.62 | -1.03 | |||
| Communist Party of Denmark | 618 | 1.81 | -0.96 | |||
| Justice Party of Denmark | 435 | 1.27 | -1.30 | |||
| Christian People's Party | 403 | 1.18 | -0.17 | |||
| Communist Workers Party | 32 | 0.09 | -0.29 | |||
| Socialist Workers Party | 26 | 0.08 | New | |||
| Anders Bondo Christensen | 9 | 0.03 | New | |||
| Total | 34,229 | |||||
| Source[22] | ||||||
General elections in the 1970s
| Parties | Vote | |||||
|---|---|---|---|---|---|---|
| Votes | % | + / - | ||||
| Social Democrats | 18,790 | 52.70 | +1.88 | |||
| Conservatives | 3,517 | 9.86 | +2.02 | |||
| Progress Party | 2,858 | 8.02 | -2.31 | |||
| Green Left | 2,795 | 7.84 | +1.97 | |||
| Venstre | 1,635 | 4.59 | +0.56 | |||
| Social Liberals | 1,363 | 3.82 | +1.42 | |||
| Left Socialists | 1,302 | 3.65 | +1.19 | |||
| Communist Party of Denmark | 987 | 2.77 | -2.68 | |||
| Justice Party of Denmark | 915 | 2.57 | -0.35 | |||
| Centre Democrats | 870 | 2.44 | -2.04 | |||
| Christian People's Party | 483 | 1.35 | -0.77 | |||
| Communist Workers Party | 137 | 0.38 | New | |||
| Total | 35,652 | |||||
| Source[23] | ||||||
| Parties | Vote | |||||
|---|---|---|---|---|---|---|
| Votes | % | + / - | ||||
| Social Democrats | 18,335 | 50.82 | +7.77 | |||
| Progress Party | 3,726 | 10.33 | -0.19 | |||
| Conservatives | 2,830 | 7.84 | +2.27 | |||
| Green Left | 2,119 | 5.87 | -1.47 | |||
| Communist Party of Denmark | 1,965 | 5.45 | -0.67 | |||
| Centre Democrats | 1,615 | 4.48 | +3.20 | |||
| Venstre | 1,453 | 4.03 | -8.81 | |||
| Justice Party of Denmark | 1,053 | 2.92 | +1.51 | |||
| Left Socialists | 889 | 2.46 | +0.76 | |||
| Social Liberals | 866 | 2.40 | -3.81 | |||
| Christian People's Party | 764 | 2.12 | -1.82 | |||
| Pensioners' Party | 460 | 1.28 | New | |||
| Total | 36,075 | |||||
| Source[24] | ||||||
| Parties | Vote | |||||
|---|---|---|---|---|---|---|
| Votes | % | + / - | ||||
| Social Democrats | 15,376 | 43.05 | +7.07 | |||
| Venstre | 4,585 | 12.84 | +8.57 | |||
| Progress Party | 3,756 | 10.52 | -2.17 | |||
| Green Left | 2,620 | 7.34 | -2.09 | |||
| Social Liberals | 2,218 | 6.21 | -4.61 | |||
| Communist Party of Denmark | 2,185 | 6.12 | +1.60 | |||
| Conservatives | 1,989 | 5.57 | -3.38 | |||
| Christian People's Party | 1,406 | 3.94 | +1.23 | |||
| Left Socialists | 606 | 1.70 | +0.25 | |||
| Justice Party of Denmark | 504 | 1.41 | -1.11 | |||
| Centre Democrats | 458 | 1.28 | -5.38 | |||
| Hans Clausen Pilegaard | 8 | 0.02 | New | |||
| E. Just Jensen | 3 | 0.01 | New | |||
| Gunner Pedersen | 3 | 0.01 | New | |||
| Oscar Andersen | 0 | 0.00 | New | |||
| Ivan Folmer-Larsen | 0 | 0.00 | New | |||
| Total | 35,717 | |||||
| Source[25] | ||||||
| Parties | Vote | |||||
|---|---|---|---|---|---|---|
| Votes | % | + / - | ||||
| Social Democrats | 12,974 | 35.98 | -13.37 | |||
| Progress Party | 4,576 | 12.69 | New | |||
| Social Liberals | 3,902 | 10.82 | -2.32 | |||
| Green Left | 3,399 | 9.43 | -2.73 | |||
| Conservatives | 3,228 | 8.95 | -5.90 | |||
| Centre Democrats | 2,400 | 6.66 | New | |||
| Communist Party of Denmark | 1,630 | 4.52 | +2.39 | |||
| Venstre | 1,541 | 4.27 | -0.45 | |||
| Christian People's Party | 979 | 2.71 | +1.57 | |||
| Justice Party of Denmark | 908 | 2.52 | +1.21 | |||
| Left Socialists | 522 | 1.45 | +0.24 | |||
| Total | 36,059 | |||||
| Source[26] | ||||||
| Parties | Vote | |||||
|---|---|---|---|---|---|---|
| Votes | % | + / - | ||||
| Social Democrats | 17,811 | 49.35 | ||||
| Conservatives | 5,359 | 14.85 | ||||
| Social Liberals | 4,743 | 13.14 | ||||
| Green Left | 4,389 | 12.16 | ||||
| Venstre | 1,704 | 4.72 | ||||
| Communist Party of Denmark | 767 | 2.13 | ||||
| Justice Party of Denmark | 473 | 1.31 | ||||
| Left Socialists | 437 | 1.21 | ||||
| Christian People's Party | 411 | 1.14 | ||||
| Total | 36,094 | |||||
| Source[27] | ||||||
European Parliament elections results
2019 European Parliament election in Denmark
| Parties | Vote | |||||
|---|---|---|---|---|---|---|
| Votes | % | + / - | ||||
| Social Democrats | 7,716 | 23.83 | +0.86 | |||
| Green Left | 5,150 | 15.90 | +2.48 | |||
| Venstre | 4,609 | 14.23 | +5.04 | |||
| Social Liberals | 4,251 | 13.13 | +6.20 | |||
| Danish People's Party | 2,718 | 8.39 | -14.55 | |||
| Red–Green Alliance | 2,709 | 8.37 | New | |||
| Conservatives | 1,781 | 5.50 | -7.20 | |||
| The Alternative | 1,658 | 5.12 | New | |||
| People's Movement against the EU | 1,094 | 3.38 | -6.30 | |||
| Liberal Alliance | 694 | 2.14 | -0.02 | |||
| Total | 32,380 | |||||
| Source[28] | ||||||
2014 European Parliament election in Denmark
| Parties | Vote | |||||
|---|---|---|---|---|---|---|
| Votes | % | + / - | ||||
| Social Democrats | 5,896 | 22.97 | -8.45 | |||
| Danish People's Party | 5,889 | 22.94 | +11.06 | |||
| Green Left | 3,446 | 13.42 | -5.55 | |||
| Conservatives | 3,261 | 12.70 | -1.55 | |||
| People's Movement against the EU | 2,484 | 9.68 | +2.26 | |||
| Venstre | 2,358 | 9.19 | +0.19 | |||
| Social Liberals | 1,780 | 6.93 | +3.11 | |||
| Liberal Alliance | 555 | 2.16 | +1.50 | |||
| Total | 25,669 | |||||
| Source[29] | ||||||
2009 European Parliament election in Denmark
| Parties | Vote | |||||
|---|---|---|---|---|---|---|
| Votes | % | + / - | ||||
| Social Democrats | 8,140 | 31.42 | -7.77 | |||
| Green Left | 4,916 | 18.97 | +7.63 | |||
| Conservatives | 3,691 | 14.25 | +2.39 | |||
| Danish People's Party | 3,077 | 11.88 | +6.36 | |||
| Venstre | 2,333 | 9.00 | -1.33 | |||
| People's Movement against the EU | 1,922 | 7.42 | +2.31 | |||
| Social Liberals | 989 | 3.82 | -2.79 | |||
| June Movement | 671 | 2.59 | -6.66 | |||
| Liberal Alliance | 170 | 0.66 | New | |||
| Total | 25,909 | |||||
| Source[30] | ||||||
2004 European Parliament election in Denmark
| Parties | Vote | |||||
|---|---|---|---|---|---|---|
| Votes | % | + / - | ||||
| Social Democrats | 7,930 | 39.19 | +17.33 | |||
| Conservatives | 2,399 | 11.86 | +3.45 | |||
| Green Left | 2,295 | 11.34 | +2.61 | |||
| Venstre | 2,090 | 10.33 | -4.41 | |||
| June Movement | 1,871 | 9.25 | -9.15 | |||
| Social Liberals | 1,338 | 6.61 | -4.01 | |||
| Danish People's Party | 1,116 | 5.52 | -0.31 | |||
| People's Movement against the EU | 1,035 | 5.11 | -2.47 | |||
| Christian Democrats | 161 | 0.80 | -0.39 | |||
| Total | 20,235 | |||||
| Source[31] | ||||||
1999 European Parliament election in Denmark
| Parties | Vote | |||||
|---|---|---|---|---|---|---|
| Votes | % | + / - | ||||
| Social Democrats | 4,582 | 21.86 | +1.21 | |||
| June Movement | 3,857 | 18.40 | -0.38 | |||
| Venstre | 3,090 | 14.74 | +3.01 | |||
| Social Liberals | 2,226 | 10.62 | +2.32 | |||
| Green Left | 1,829 | 8.73 | -1.09 | |||
| Conservatives | 1,763 | 8.41 | -5.64 | |||
| People's Movement against the EU | 1,589 | 7.58 | -5.90 | |||
| Danish People's Party | 1,223 | 5.83 | New | |||
| Centre Democrats | 554 | 2.64 | +1.97 | |||
| Christian Democrats | 249 | 1.19 | +0.66 | |||
| Progress Party | 87 | 0.42 | -1.56 | |||
| Total | 20,962 | |||||
| Source[32] | ||||||
1994 European Parliament election in Denmark
| Parties | Vote | |||||
|---|---|---|---|---|---|---|
| Votes | % | + / - | ||||
| Social Democrats | 4,842 | 20.65 | -12.52 | |||
| June Movement | 4,404 | 18.78 | New | |||
| Conservatives | 3,295 | 14.05 | +3.57 | |||
| People's Movement against the EU | 3,160 | 13.48 | -8.32 | |||
| Venstre | 2,751 | 11.73 | +3.78 | |||
| Green Left | 2,303 | 9.82 | -3.00 | |||
| Social Liberals | 1,947 | 8.30 | +6.09 | |||
| Progress Party | 465 | 1.98 | -1.96 | |||
| Centre Democrats | 156 | 0.67 | -5.48 | |||
| Christian Democrats | 125 | 0.53 | -0.95 | |||
| Total | 23,448 | |||||
| Source[33] | ||||||
1989 European Parliament election in Denmark
| Parties | Vote | |||||
|---|---|---|---|---|---|---|
| Votes | % | + / - | ||||
| Social Democrats | 6,529 | 33.17 | +3.38 | |||
| People's Movement against the EU | 4,290 | 21.80 | -1.51 | |||
| Green Left | 2,524 | 12.82 | -0.37 | |||
| Conservatives | 2,063 | 10.48 | -6.26 | |||
| Venstre | 1,564 | 7.95 | +3.40 | |||
| Centre Democrats | 1,211 | 6.15 | +1.32 | |||
| Progress Party | 775 | 3.94 | +1.56 | |||
| Social Liberals | 435 | 2.21 | -0.13 | |||
| Christian Democrats | 292 | 1.48 | -0.11 | |||
| Total | 19,683 | |||||
| Source[34] | ||||||
1984 European Parliament election in Denmark
| Parties | Vote | |||||
|---|---|---|---|---|---|---|
| Votes | % | |||||
| Social Democrats | 6,392 | 29.79 | ||||
| People's Movement against the EU | 5,003 | 23.31 | ||||
| Conservatives | 3,592 | 16.74 | ||||
| Green Left | 2,831 | 13.19 | ||||
| Centre Democrats | 1,036 | 4.83 | ||||
| Venstre | 976 | 4.55 | ||||
| Progress Party | 510 | 2.38 | ||||
| Social Liberals | 503 | 2.34 | ||||
| Christian Democrats | 341 | 1.59 | ||||
| Left Socialists | 275 | 1.28 | ||||
| Total | 21,459 | |||||
| Source[35] | ||||||
Referendums
2022 Danish European Union opt-out referendum[36]
| Option | Votes | % |
|---|---|---|
| ✓ YES | 20,137 | 66.63 |
| X NO | 10,084 | 33.37 |
2015 Danish European Union opt-out referendum[37]
| Option | Votes | % |
|---|---|---|
| X NO | 18,159 | 55.13 |
| ✓ YES | 14,779 | 44.87 |
2014 Danish Unified Patent Court membership referendum[38]
| Option | Votes | % |
|---|---|---|
| ✓ YES | 14,521 | 58.27 |
| X NO | 10,401 | 41.73 |
2009 Danish Act of Succession referendum[39]
| Option | Votes | % |
|---|---|---|
| ✓ YES | 19,602 | 82.93 |
| X NO | 4,035 | 17.07 |
2000 Danish euro referendum[40]
| Option | Votes | % |
|---|---|---|
| X NO | 21,858 | 55.22 |
| ✓ YES | 17,728 | 44.78 |
1998 Danish Amsterdam Treaty referendum[41]
| Option | Votes | % |
|---|---|---|
| ✓ YES | 17,149 | 50.92 |
| X NO | 16,528 | 49.08 |
1993 Danish Maastricht Treaty referendum[42]
| Option | Votes | % |
|---|---|---|
| X NO | 20,550 | 50.97 |
| ✓ YES | 19,767 | 49.03 |
1992 Danish Maastricht Treaty referendum[43]
| Option | Votes | % |
|---|---|---|
| X NO | 23,151 | 60.27 |
| ✓ YES | 15,262 | 39.73 |
1986 Danish Single European Act referendum[44]
| Option | Votes | % |
|---|---|---|
| X NO | 18,436 | 58.14 |
| ✓ YES | 13,273 | 41.86 |
1972 Danish European Communities membership referendum[45]
| Option | Votes | % |
|---|---|---|
| ✓ YES | 21,431 | 57.72 |
| X NO | 15,700 | 42.28 |
References
- "Odense Østkredsen". kmdvalg.dk (in Danish). Retrieved 2023-06-04.
- "Forslag til Lov om ændring af lov om valg til Folketinget" (PDF). Folketingstidende. 4 June 1970.
- "Nye valgkredse fordeler stemmerne anderledes". dr.dk (in Danish). Retrieved 2023-06-04.
- "Beretning om nye valgkredse som følge af kommunalreformen" (in Danish). Retrieved 2023-06-04.
- "Det danske valgsystem: Valg til Folketinget". valg.im (in Danish). Retrieved 2023-06-04.
- "41 Odense Øst". dataforsyningen.dk (in Danish). Retrieved 2023-06-04.
- "Forslag til Lov om ændring af lov om valg til Folketinget" (PDF). Folketingstidende. 4 June 1970.
- "Valgresultater fra tidligere valg:". kmdvalg (in Danish). Retrieved 2023-06-04.
- "FOLKETINGSVALG TIRSDAG 1. NOVEMBER 2022". valg.im (in Danish). Retrieved 2023-06-27.
- "FOLKETINGSVALG ONSDAG 5. JUNI 2019". valg.im (in Danish). Retrieved 2023-06-27.
- "FOLKETINGSVALG TORSDAG 18. JUNI 2015". valg.im (in Danish). Retrieved 2023-06-27.
- "FOLKETINGSVALG TORSDAG 15. SEPTEMBER 2011". valg.im (in Danish). Retrieved 2023-06-27.
- "Folketingsvalget den 13. november 2007". valg.im (in Danish). Retrieved 2023-06-27.
- "valg2005.book" (PDF). valg.im (in Danish). Retrieved 2023-06-27.
- "BMTABEL" (PDF). valg.im (in Danish). Retrieved 2023-06-27.
- "VALG98" (PDF). valg.im (in Danish). Retrieved 2023-06-27.
- "VALG94" (PDF). valg.im (in Danish). Retrieved 2023-06-27.
- "VALG90" (PDF). valg.im (in Danish). Retrieved 2023-06-27.
- "Folketingsvalget den 10. maj 1988". valg.im (in Danish). Retrieved 2023-06-27.
- "Folketingsvalget den 8.september 1987". dst.dk (in Danish). Retrieved 2023-06-27.
- "Folketingsvalget den 10. januar 1984". dst.dk (in Danish). Retrieved 2023-06-27.
- "Folketingsvalget den 8. december 1981". dst.dk (in Danish). Retrieved 2023-06-27.
- "Folketingsvalget den 23. oktober 1979". dst.dk (in Danish). Retrieved 2023-06-27.
- "Folketingsvalget den 15. februar 1977". dst.dk (in Danish). Retrieved 2023-06-27.
- "Folketingsvalget den 9. januar 1975". dst.dk (in Danish). Retrieved 2023-06-27.
- "Folketingsvalget den 4. december 1973". dst.dk (in Danish). Retrieved 2023-06-27.
- "Folketingsvalget den 21. september 1971 samt folkeafstemningen". dst.dk (in Danish). Retrieved 2023-06-27.
- "EUROPA-PARLAMENTSVALG SØNDAG 26. MAJ 2019". dst.dk (in Danish). Retrieved 2023-07-01.
- "EUROPA-PARLAMENTSVALG SØNDAG 25. MAJ 2014". dst.dk (in Danish). Retrieved 2023-07-01.
- "EUROPA-PARLAMENTSVALG SØNDAG 7. JUNI 2009". dst.dk (in Danish). Retrieved 2023-07-01.
- "EUROPA-PARLAMENTSVALGET DEN 13. JUNI 2004" (PDF). im.dk (in Danish). Retrieved 2023-07-01.
- "VALGET TIL EUROPA-PARLAMENTET DEN 10. JUNI 1999" (PDF). im.dk (in Danish). Retrieved 2023-07-01.
- "VALGET TIL EUROPA-PARLAMENTET DEN 9. JUNI 1994" (PDF). im.dk (in Danish). Retrieved 2023-07-01.
- "Valget til Europa-parlamentet den 15. juni 1989". dst.dk (in Danish). Retrieved 2023-07-01.
- "Valget til Europa-Parlamentet den 14. juni 1984". dst.dk (in Danish). Retrieved 2023-07-01.
- "FOLKEAFSTEMNING ONSDAG 1. JUNI 2022". dst.dk (in Danish). Retrieved 2023-07-05.
- "FOLKEAFSTEMNING TORSDAG 3. DECEMBER 2015". dst.dk (in Danish). Retrieved 2023-07-05.
- "FOLKEAFSTEMNING SØNDAG 25. MAJ 2014". dst.dk (in Danish). Retrieved 2023-07-05.
- "FOLKEAFSTEMNING SØNDAG 7. JUNI 2009". dst.dk (in Danish). Retrieved 2023-07-05.
- "FOLKEAFSTEMNINGEN DEN 28. SEPTEMBER 2000 OM DANMARKS DELTAGELSE I DEN FÆLLES VALUTA" (PDF). valg.im (in Danish). Retrieved 2023-07-05.
- "FOLKEAFSTEMNINGEN DEN 28. MAJ 1998OM DANMARKS TILTRÆDELSE AF AMSTERDAMTRAKTATEN" (PDF). valg.im (in Danish). Retrieved 2023-07-05.
- "FOLKEAFSTEMNINGEN DEN 18. MAJ 1993 OM DANMARKS TILTRÆDELSE AF EDINBURGH-AFGØRELSEN OG MAASTRICHT-TRAKTATEN". dst.dk (in Danish). Retrieved 2023-07-05.
- "Folkeafstemningen den 1. juni 1992 om Danmarks tiltrædelse af traktaten om Den Europæiske Union". dst.dk (in Danish). Retrieved 2023-07-05.
- "Vejledende folkeafstemning torsdag den 27. februar 1986 om Danmarks tiltrædelse af EF- pakken". dst.dk (in Danish). Retrieved 2023-07-05.
- "Folkeafstemningen om Danmarks tiltrædelse af De europæiske Fælleskaber 2. oktober 1972". dst.dk (in Danish). Retrieved 2023-07-05.