Oderberg
Oderberg (German: [ˈoːdɐbɛʁk] ⓘ) is a town in the district of Barnim, in Brandenburg in northeastern Germany. It is situated 16 km east of Eberswalde, and 27 km southwest of Schwedt, close to the border with Poland, and in close vicinity of Berlin.
Oderberg | |
|---|---|
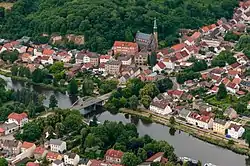 Aerial view of the town center | |
 Coat of arms | |
Location of Oderberg within Barnim district 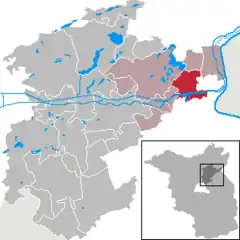 | |
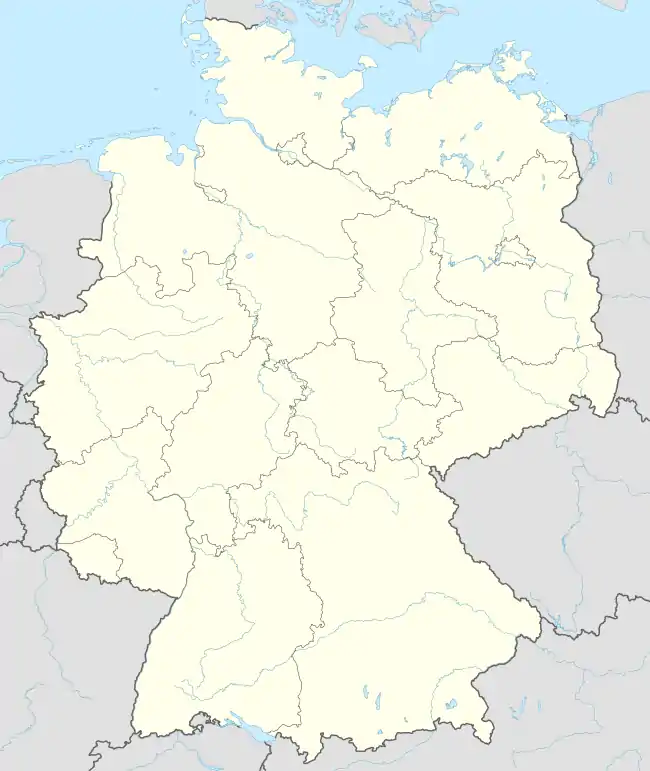 Oderberg 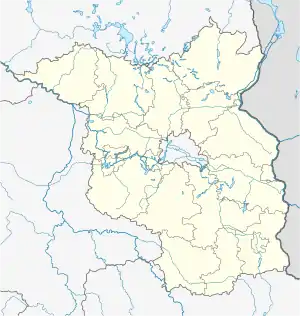 Oderberg | |
| Coordinates: 52°52′00″N 14°03′00″E | |
| Country | Germany |
| State | Brandenburg |
| District | Barnim |
| Municipal assoc. | Britz-Chorin-Oderberg |
| Government | |
| • Mayor (2019–24) | Martina Hähnel[1] |
| Area | |
| • Total | 35.31 km2 (13.63 sq mi) |
| Elevation | 5 m (16 ft) |
| Population (2021-12-31)[2] | |
| • Total | 2,117 |
| • Density | 60/km2 (160/sq mi) |
| Time zone | UTC+01:00 (CET) |
| • Summer (DST) | UTC+02:00 (CEST) |
| Postal codes | 16248 |
| Dialling codes | 033369 |
| Vehicle registration | BAR |
| Website | www |
Overview
The territory has many lakes, remnants from the ice age. The area is widely used for outdoor recreation, such as biking, walking and boating. As Biosphere region it is home to many species of wildlife. Oderberg is closest to the Oder river crossing leading directly to Cedynia, Poland.
History
From 1815 to 1947, Oderberg was part of the Prussian Province of Brandenburg, from 1947 to 1952 of the State of Brandenburg, from 1952 to 1990 of the East German Bezirk Frankfurt and since 1990 again of Brandenburg.
Demography
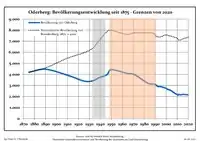
Development of population since 1875 within the current boundaries (Blue line: Population; Dotted line: Comparison to population development of Brandenburg state; Grey background: Time of Nazi rule; Red background: Time of communist rule)
|
|
|
Gallery
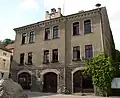 Town hall
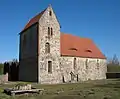 Church in Neuendorf
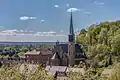 Saint Nicholas church
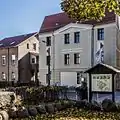 Museum
References
- Landkreis Barnim Wahl der Bürgermeisterin / des Bürgermeisters, accessed 30 June 2021.
- "Bevölkerungsentwicklung und Flächen der kreisfreien Städte, Landkreise und Gemeinden im Land Brandenburg 2021" (PDF). Amt für Statistik Berlin-Brandenburg (in German). June 2022.
- Detailed data sources are to be found in the Wikimedia Commons.Population Projection Brandenburg at Wikimedia Commons
Towns and municipalities in Barnim district | ||
|---|---|---|
Coat of Arms of Barnim district | ||
This article is issued from Wikipedia. The text is licensed under Creative Commons - Attribution - Sharealike. Additional terms may apply for the media files.