Optically stimulated luminescence thermochronometry
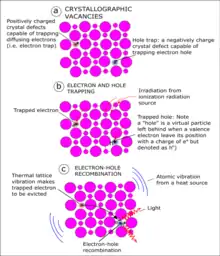
Optically stimulated luminescence (OSL) thermochronometry is a dating method used to determine the time since quartz[1][2] and/or feldspar[3][4] began to store charge as it cools through the effective closure temperature.[1] The closure temperature for quartz and Na-rich K-feldspar is 30-35 °C[1][5] and 25 °C[4] respectively. When quartz and feldspar are beneath the earth, they are hot. They cool when any geological process e.g. focused erosion causes their exhumation to the earth surface.[6] As they cool, they trap electron charges originating from within the crystal lattice. These charges are accommodated within crystallographic defects or vacancies in their crystal lattices as the mineral cools below the closure temperature.[7]

During detrapping of these electrons, luminescence is produced.[7] The luminescence or light emission from the mineral is assumed to be proportional to the trapped electron charge population.[7] The age recorded in standard OSL method is determined by counting the number of these trapped charges in an OSL detection system.[6][7] The OSL age is the cooling age of the quartz and/or feldspar.[1] This cooling history is a record of the mineral's thermal history, which is used to reconstruct the geological event.[1][8]
The sub-Quaternary period (104 to 105 years) is the geological age where OSL is a favourable dating technique[1][6] because of low closure temperature of quartz and feldspar used in this technique. The Quaternary period is marked by intense crustal erosion particularly within active mountain ranges, leading to high exhumation rate of crustal rocks[8] and formation of sub-Quaternary sediments. Previous techniques (e.g. Apatite Fission Track, Zircon Fission Track, and (Uranium-Thorium)/ Helium dating) could not adequately track the geological age records particularly in the last ~300 thousand years.[1][7][9] OSL dating is currently the only dating method that has been successfully applied to understand the cooling ages of the geological events.[1][8][10][11][12]
Theoretical concepts of electron trapping and detrapping for OSL measurement
In natural environment, crystal lattices of quartz and/or feldspar are bombarded with radiation released from radiogenic source[7] such as in -situ radioactive decay.[1][6] As the crystals are irradiated, charges are stored up in their crystallographic defects. The charge trapping process involves atomic-scale ionic substitution of both electron and hole within the crystal lattices of quartz and feldspar.[7] The electron diffusion happens in response to ionizing radiation as the minerals cools below their closure temperature.[5][13]
If quartz or feldspar gains are exposed to natural light source such as the sun, the trapped charges will be evicted in form of luminescence.[7] This natural process is called bleaching. Any other process that could heat up the sample will also cause the trapped electrons to escape from the crystal lattice known as thermal bleaching. Optical bleaching of the mineral leads to eviction of trapped charges in the minerals,[6][7] hence, careful sampling and handling must be followed to avoid using bleached sample for OSL thermochronometry. To artificially produce luminescence in the laboratory for luminescence study of the mineral, these two processes are adopted.[7]
Kinetic or rate equations for trapping and detrapping processes
A wide range of kinetic models have been developed to explain trapping and detrapping processes in quartz and feldspar crystals.[2][14] Two of these models are particularly useful in determining the cooling histories of quartz or feldspar[7][9] These models are known as the general order kinetic model[4] and band tail model.[15][16] The two models consider three major processes to characterize the mineral luminescence, which are: trapping process, thermal detrapping process and athermal detrapping process. Each of the processes are guided by different equations discussed below. These models are useful for the determining of cooling history of the mineral, which involves subtracting the differential sum of thermal detrapping and athermal detrapping from the trapping process[9] (i.e. Trapping – (Thermal detrapping + Athermal detrapping).
Rate equations
Trapping processThe process describes the rate at which a mineral acquires charge from its natural environment.[7] The process is defined by the equation below.
where is the ratio of electrons that are trapped (n) and the full storage capacity (N) in the mineral crystal. is the charge stored per unit time, known as dose rate (unit is Gy/ky). is the dose that correspond to the maximum storage capacity of the mineral. The probability that the mineral will get filled defines the and relationship. is an exponential factor greater than or equal to 1. |
Thermal detrappingThe equation describes how charges are evicted in form of luminescence from the mineral system when the mineral absorbed heat energy. This is where the general order kinetic model and the band tail model equations differs. 1. For the general order kinetic Model[4] 2. For the band tail Model[15][16]
Where frequency factor measured in per second (s−1), is the kinetic order, which is usually less than or equal to 1; is the activation energy measured in (eV), and are the activation energies at the conduction band and the valence band respectively in the crystal lattices of the mineral. is the Boltzmann constant (eV/K) and is the absolute temperature (K). |
Athermal detrappingThis equation describes the luminescence recorded as the signal fades out known as 'anomalous fading'.[17] This is determined without heating the mineral during fading experiment[7] The relationship is defined by this equation.
where represents the density of the crystal's recombination centers and r is the distance between the recombination centers and the electron traps. |
Determination of cooling history from the kinetic equations

By combining the four equations above, a single differential equation is developed to convert the luminescence into cooling rate. We have:
for the general order kinetic model; and
for the band tail model.
Any of the models can be used because the same series of laboratory experiments are followed for the estimation of all the parameters involved in the equations.[9] The inversion of measured for a range of temperature -time history or T-t path can be used to determine the cooling rate.[9] Sufficient number of T-t paths conducted in the laboratory is used to build a probability density function, which will help to determine the most likely cooling histories undergone by the mineral.[9]
Sample preparation
Bedrock samples from earth surface or boreholes are required earth materials for OSL dating.[7] Minerals (quartz and/or feldspar) are usually separated from the rock or sediment samples under regulated laboratory lighting system similar to procedures used in archaeological OSL dating.[1][6] The light source is usually a controlled red light condition to avoid luminescence signal resetting.[7] Crushing of sample are gently carried out to avoid generating heat that is strong enough to reset OSL signal in the minerals.[7] Crushed samples are separated by means of a sieve to get fine-grained. A range of values varying from 90 – 125 microns,[6] 100 – 200 microns and 180 – 212 microns[7][8] can be used for OSL measurement. The selected grains are chemically treated with HCl to digest carbonates and with H2O2 to remove organic materials[7] that can contaminate the sensitivity of OSL signal during measurement. Feldspar and quartz with densities of < 2.62 g cm−3 and < 2.68 g cm−3 respectively are separated from other heavier minerals by density separation.[7] Inclusions of zircon, apatite and feldspar in quartz as well as alpha-particles irradiated grain edges that can contaminate OSL signal are removed by etching in hydrofluoric acid (HF).[2][6][7]
OSL signal detection system
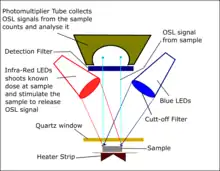
OSL ages are commonly measured using an automated RisThermal Luminescence Reader (e.g. TL-DA-20). It contains an internal beta-source (e.g. 90Sr/90Y) with optical stimulation emitted through laser diodes (LEDs). The reader also has a detection filter for transmission of stimulated luminescence signals. During this measurement, the mineral grain (quartz or feldspar) is glued on a heater strip (stainless-steel discs) using adhesive (commonly silicone spray). The mineral grain is stimulated with the light source.[6] This light is the series of light emitting diode.[6] This bombardment stimulates the electrons, which are trapped and begin to recombine in the crystal.[7] During this process, they give the OSL signal, which is collected or recorded in the ray sensitive photomultiplier tube.[6] The photomultiplier tube converts all the incident photons (i.e. light) to electronic charge. This is the basic principle of how the luminescence (light) emission from the minerals under investigation is measured.
OSL age determination

To determine the OSL age of the sample, the dose rate, () and the equivalent dose (). A dose is the quantity of natural radiation or energy absorbed by a mineral.[6] The dose rate is the effective radiation absorbed from naturally occurring ionizing source per unit time.[6][7]
The age is calculated by determining the ratio of equivalent dose () and the dose rate () using the equation below.
where is the age (yr), is measured in Gray (Gy). Note that 1 Gy is equivalent to 1 J.kg−1 (Joule per kilogram) and is Gy year−1[6]
Dose rate determination
For a single grain of mineral, the dose rate () can be determined by measuring the concentrations of uranium, potassium and thorium by direct mass spectrometric analysis of quartz or feldspar grains.[6] Ge-Gamma, INAA, X-ray flourescnce and ICP-MS or ICP-OES are spectrometers that can could be used.[6] Other methods for the determination the dose rate include: (1) overburden cosmic dose rate estimation, (2) water content attenuation method, and (3) disequilibrium dose rate correction method.[6] An average dose rate is usually calculated as representative of the dose rate.[6]
Equivalent dose determination
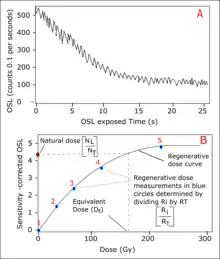
The equivalent dose () is also known as the dose response is determined from the dose response curve (see Plot B).[7] The single-aliquot regenerative (SAR) protocol is a commonly used method for the determination of the equivalent dose.[18] The protocol involves series of laboratory measurement of OSL signal (see Plot A), which is emitted by the aliquot after it has been optically stimulated at a known beta dose within a given time in seconds. The beta-source may be 90Sr/90Y in an automated RisThermal Luminescence Reader . During SAR protocol, the difference in the measurement for quartz and feldspar is mainly on the degree of heat required per time and the source of stimulation.
The first stage involves determination of the natural dose (see Plot B) preheating the aliquot to about 160 -130 °C (for feldspar)[18] for 10 s or 160-300 °C (for quartz)[19] when the natural luminescence signal (i.e. natural dose) is still intact. This is done to remove unstable signals in the mineral. After preheating, the aliquot is optically stimulated by Infrared light emitting diode (for feldspar) or Blue light emitting diode (for quartz) depending on which mineral (see OSL detection system) for 40 s at 125 °C (for feldspar) or 100 s at 125 °C (for quartz) and the natural OSL signal (NL) is measured and recorded in the photomultiplier tube. For the second stage, the aliquot is irradiated with a fixed known test dose (beta dose).[20] The aliquot is preheated at temperature less than 160 °C. The IRSL signal measurement is taken as a test dose IRSL response (NT) after it has been optically stimulated for 40 s at 125 °C (for feldspar) or 100 s at 125 °C (for quartz).[18][19][20] At this stage the aliquot is completely bleached.[20] A regenerative test dose is then started after bleaching.[20]
The same procedure as described above is followed but a range of regenerative dose is given at different temperature for sensitivity correction of OSL signal (See Plot B). For the regenerative dose measurement, the aliquot is irradiated with a known dose before preheating at 160-130 °C for 10 s or 160-300 °C for feldspar or quartz respectively while the signal response (Ri) is measured. A fixed test dose is by irradiating the aliquot and a preheating of the aliquot is carried out at a temperature less than 160 °C. The aliquot is optically stimulated at the same rate and the IRSL signal (RT) is measured. The steps are repeated for range of different regenerative dose including zero test dose.[20] During each of the tests, all OSL signals are recorded in the photomultiplier tube and the OSL counts are plotted against the OSL exposure time in seconds as shown in the OSL signal curve (first graph).[20]
For sensitivity correction, NL is plotted against NT representing the natural OSL signal while the plot of Ri against RT representing regenerative dose test (see Plot B). The natural dose is along the vertical axis because no laboratory dose is given at the stage. The regenerative dose measurement will vary with respect to the given dose at each stage. The equivalent dose () is determined by drawing a line (red discontinuous line in Plot B) from the natural dose to intercept with the regenerative dose curve. The point of interception with the curve represent the equivalent dose by reading its value on the horizontal axis (See Plot B).[18] The corresponding dose value at the horizontal axis is recorded for the equivalent dose ().[20]
Applications.

General applications
OSL finds application in all low-temperature (<50 °C) tectonic and sedimentary processes. These studies are mainly captured within the sub-Quaternary period including, but not limited to focused fluvial and/or glacial erosion, rock exhumation and evolution of topography in active tectonic regions.[1][8] Other applications include glaciation deposits, lagoon deposits, storm surge and tsunami deposits, lake deposits including shoreline migration history, fluvial erosion deposits, loess deposit records.[6] For example, the rate of slip on a normal faults plane can also be modelled, the rate of glacial or fluvial erosion of the earth surface can also be modelled as well as when sedimentary deposits are found within the sub-Quaternary period.[8]
In active tectonics regions, the application of OSL dating is very useful in tracking the thermal history and rate of rock exhumation towards the Earth's surface.[1][8] The closer the cooling ages, the higher the rate of erosion and/or exhumation of the rock unit under investigation.[1] When the OSL age of quartz or feldspar is known, the obtained ages are coupled with the existing thermal-mechanical equations e.g. Pecube[8][21] to reconstruct the thermal-mechanical history.
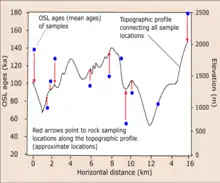
The OSL ages (see diagram), cooling ages, elevation data are plotted against the horizontal distance where samples and elevation data were collected to interpret the exhumation rate of rock or the evolution of the relief system through time.[1] For example, OSL dating has been applied in determined the cooling histories of some rapidly eroding active regions at sub-Quaternary time-scale (i.e. 104 to 105 years). These examples are Whataroa-Perth catchment area in the Southern Alps of New Zealand[1] and Namche Barwa-Gyala Peri dome in eastern Himalaya.[8] In the Namche Barwa-Gyala Peri dome, river erosion was prevalent[8] while glacial erosion was the main active process in the Whataroa-Perth catchment area.[1] In both studies, the rate of exhumation and evolution of the relief systems were estimated by inversion of OSL thermochronological ages.[1][8]
See also
References
- Herman, Frédéric; Rhodes, Edward J.; Braun, Jean; Heiniger, Lukas (2010b). "Uniform erosion rates and relief amplitude during glacial cycles in the Southern Alps of New Zealand, as revealed from OSL-thermochronology". Earth and Planetary Science Letters. 297 (1–2): 183–189. Bibcode:2010E&PSL.297..183H. doi:10.1016/j.epsl.2010.06.019. ISSN 0012-821X.
- Guralnik, B.; Ankjærgaard, C.; Jain, M.; Murray, A.S.; Müller, A.; Wälle, M.; Lowick, S.E.; Preusser, F.; Rhodes, E.J. (2015a). "OSL-thermochronometry using bedrock quartz: A note of caution". Quaternary Geochronology. 25: 37–48. doi:10.1016/j.quageo.2014.09.001. ISSN 1871-1014.
- King, G.E.; Herman, F.; Lambert, R.; Valla, P.G.; Guralnik, B. (2016a). "Multi-OSL-thermochronometry of feldspar". Quaternary Geochronology. 33: 76–87. doi:10.1016/j.quageo.2016.01.004. ISSN 1871-1014.
- Guralnik, Benny; Jain, Mayank; Herman, Frédéric; Ankjærgaard, Christina; Murray, Andrew S.; Valla, Pierre G.; Preusser, Frank; King, Georgina E.; Chen, Reuven (2015c). "OSL-thermochronometry of feldspar from the KTB borehole, Germany" (PDF). Earth and Planetary Science Letters. 423: 232–243. Bibcode:2015E&PSL.423..232G. doi:10.1016/j.epsl.2015.04.032. ISSN 0012-821X.
- Guralnik, Benny; Jain, Mayank; Herman, Frédéric; Paris, Richard B.; Harrison, T. Mark; Murray, Andrew S.; Valla, Pierre G.; Rhodes, Edward J. (2013). "Effective closure temperature in leaky and/or saturating thermochronometers". Earth and Planetary Science Letters. 384: 209–218. Bibcode:2013E&PSL.384..209G. doi:10.1016/j.epsl.2013.10.003. ISSN 0012-821X.
- Rhodes, Edward J. (2011). "Optically Stimulated Luminescence Dating of Sediments over the Past 200,000 Years". Annual Review of Earth and Planetary Sciences. 39 (1): 461–488. Bibcode:2011AREPS..39..461R. doi:10.1146/annurev-earth-040610-133425. ISSN 0084-6597.
- King, Georgina E.; Guralnik, Benny; Valla, Pierre G.; Herman, Frédéric (2016c). "Trapped-charge thermochronometry and thermometry: A status review". Chemical Geology. 446: 3–17. Bibcode:2016ChGeo.446....3K. doi:10.1016/j.chemgeo.2016.08.023. ISSN 0009-2541.
- King, Georgina E.; Herman, Frédéric; Guralnik, Benny (2016b). "Northward migration of the eastern Himalayan syntaxis revealed by OSL thermochronometry". Science. 353 (6301): 800–804. Bibcode:2016Sci...353..800K. doi:10.1126/science.aaf2637. ISSN 0036-8075. PMID 27540169.
- Herman, Frédéric; King, Georgina E. (2018). "Luminescence Thermochronometry: Investigating the Link between Mountain Erosion, Tectonics and Climate". Elements. 14 (1): 33–38. doi:10.2138/gselements.14.1.33. ISSN 1811-5209.
- Wu, Tzu-Shuan; Jain, Mayank; Guralnik, Benny; Murray, Andrew S.; Chen, Yue-Gau (2015). "Luminescence characteristics of quartz from Hsuehshan Range (Central Taiwan) and implications for thermochronometry". Radiation Measurements. 81: 104–109. Bibcode:2015RadM...81..104W. doi:10.1016/j.radmeas.2015.03.002. ISSN 1350-4487.
- Sarkar, Sharmistha; Mathew, George; Pande, Kanchan; Chauhan, Naveen; Singhvi, Ashok (2013-12-01). "Rapid denudation of Higher Himalaya during late Pliestocence, evidence from OSL thermochronology". Geochronometria. 40 (4): 304–310. doi:10.2478/s13386-013-0124-7. ISSN 1897-1695.
- Valla, Pierre G.; Lowick, Sally E.; Herman, Frédéric; Champagnac, Jean-Daniel; Steer, Philippe; Guralnik, Benny (2016). "Exploring IRSL 50 fading variability in bedrock feldspars and implications for OSL thermochronometry" (PDF). Quaternary Geochronology. 36: 55–66. doi:10.1016/j.quageo.2016.08.004. ISSN 1871-1014.
- Dodson, Martin H. (1973). "Closure temperature in cooling geochronological and petrological systems". Contributions to Mineralogy and Petrology. 40 (3): 259–274. Bibcode:1973CoMP...40..259D. doi:10.1007/bf00373790. ISSN 0010-7999.
- Chen, Reuven; Pagonis, Vasilis (2011). Thermally and Optically Stimulated Luminescence. doi:10.1002/9781119993766. ISBN 978-1-119-99376-6.
- Poolton, N. R. J.; Ozanyan, K. B.; Wallinga, J.; Murray, A. S.; Bøtter-Jensen, L. (2002). "Electrons in feldspar II: a consideration of the influence of conduction band-tail states on luminescence processes". Physics and Chemistry of Minerals. 29 (3): 217–225. Bibcode:2002PCM....29..217P. doi:10.1007/s00269-001-0218-2. ISSN 0342-1791.
- Li, Bo; Li, Sheng-Hua (2013). "The effect of band-tail states on the thermal stability of the infrared stimulated luminescence from K-feldspar". Journal of Luminescence. 136: 5–10. Bibcode:2013JLum..136....5L. doi:10.1016/j.jlumin.2012.08.043. ISSN 0022-2313.
- Huntley, D J (2006). "An explanation of the power-law decay of luminescence". Journal of Physics: Condensed Matter. 18 (4): 1359–1365. Bibcode:2006JPCM...18.1359H. doi:10.1088/0953-8984/18/4/020. ISSN 0953-8984.
- Murray, A.S.; Wintle, A.G. (2003). "The single aliquot regenerative dose protocol: potential for improvements in reliability". Radiation Measurements. 37 (4–5): 377–381. Bibcode:2003RadM...37..377M. doi:10.1016/s1350-4487(03)00053-2. ISSN 1350-4487.
- Murray, A.S.; Wintle, A.G. (2000). "Luminescence dating of quartz using an improved single-aliquot regenerative-dose protocol". Radiation Measurements. 32 (1): 57–73. Bibcode:2000RadM...32...57M. doi:10.1016/s1350-4487(99)00253-x. ISSN 1350-4487.
- Wallinga, Jakob; Murray, Andrew; Duller, Geoff (2000). "Underestimation of equivalent dose in single-aliquot optical dating of feldspars caused by preheating". Radiation Measurements. 32 (5–6): 691–695. Bibcode:2000RadM...32..691W. doi:10.1016/s1350-4487(00)00127-x. ISSN 1350-4487.
- Braun, Jean (2003). "Pecube: a new finite-element code to solve the 3D heat transport equation including the effects of a time-varying, finite amplitude surface topography". Computers & Geosciences. 29 (6): 787–794. Bibcode:2003CG.....29..787B. doi:10.1016/s0098-3004(03)00052-9. ISSN 0098-3004.